Exploring ANOVA, Experimental Design Principles, and Factor Analysis

Verified

Added on  2023/06/03

|6
|1074
|178
Homework Assignment
AI Summary
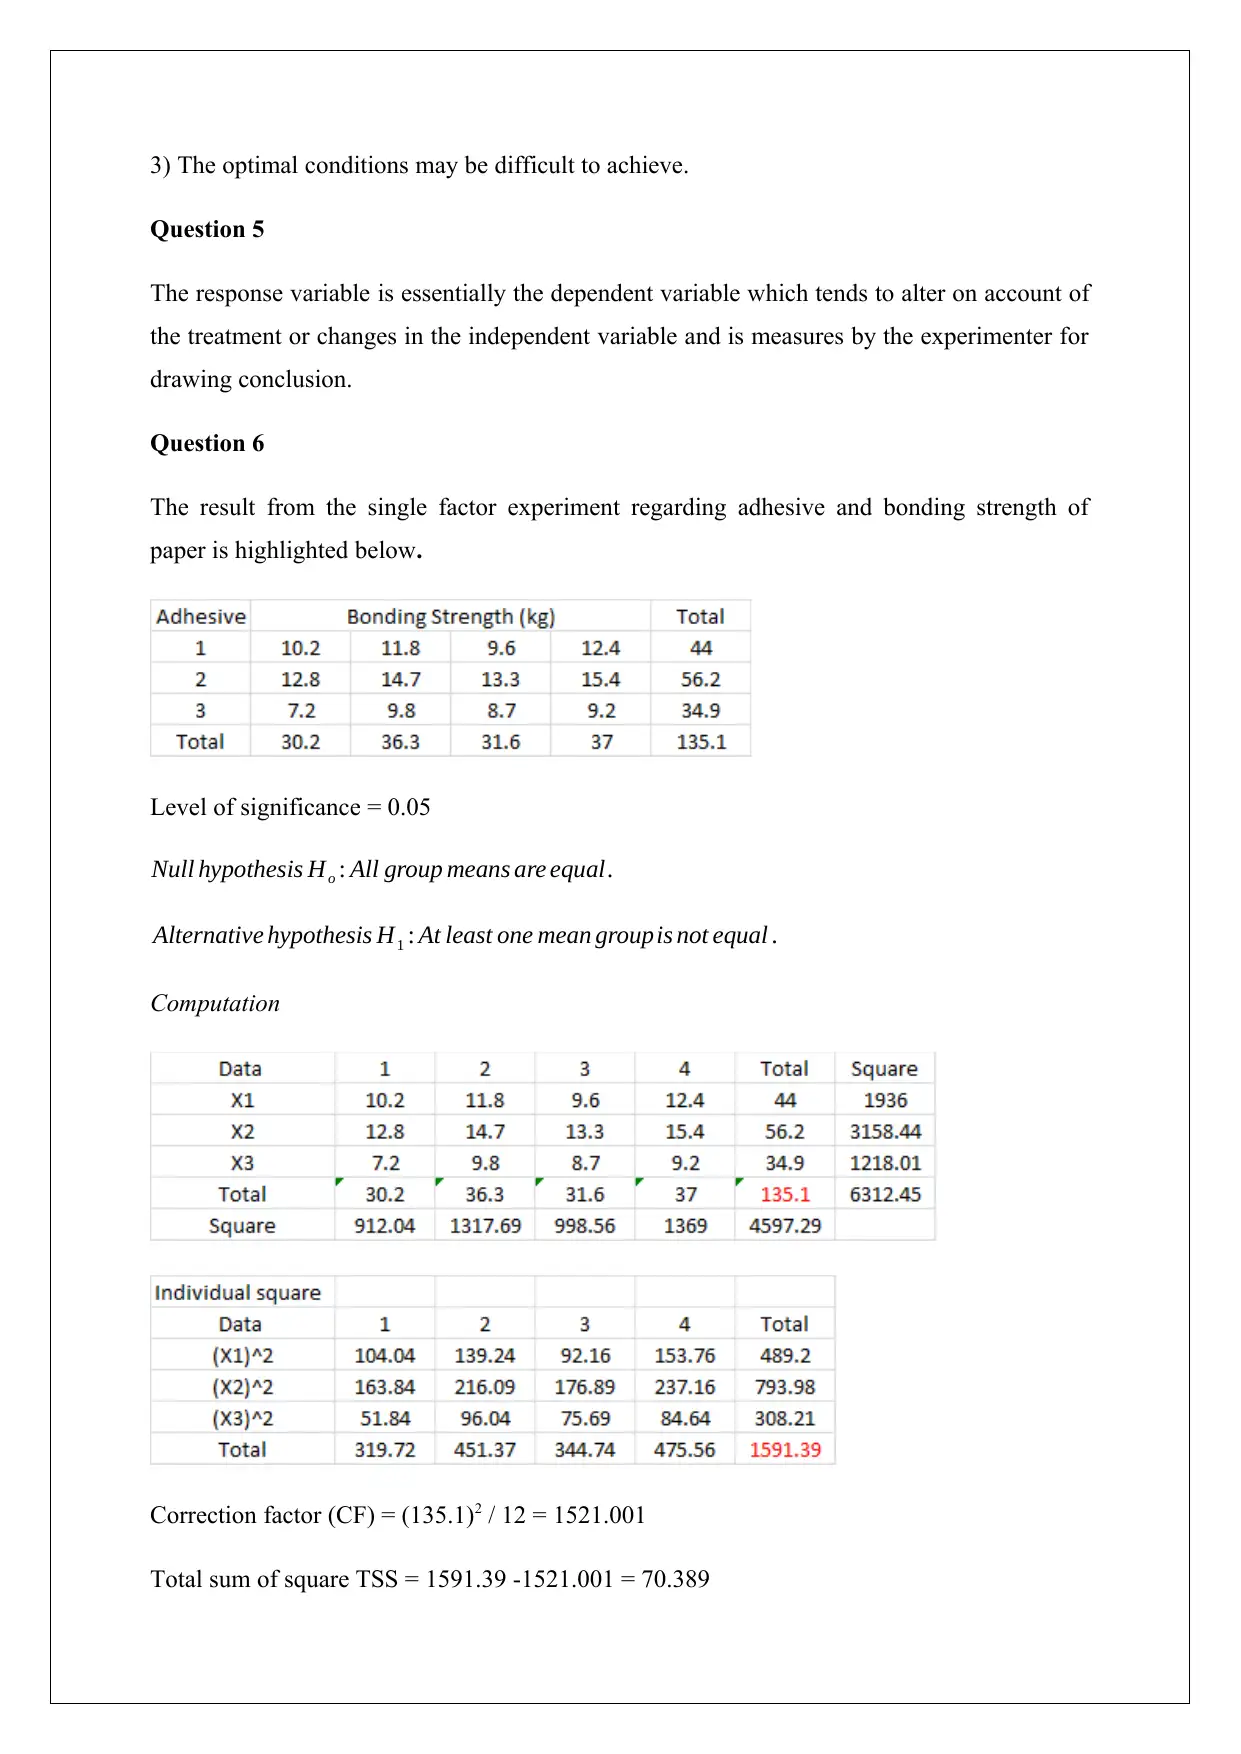
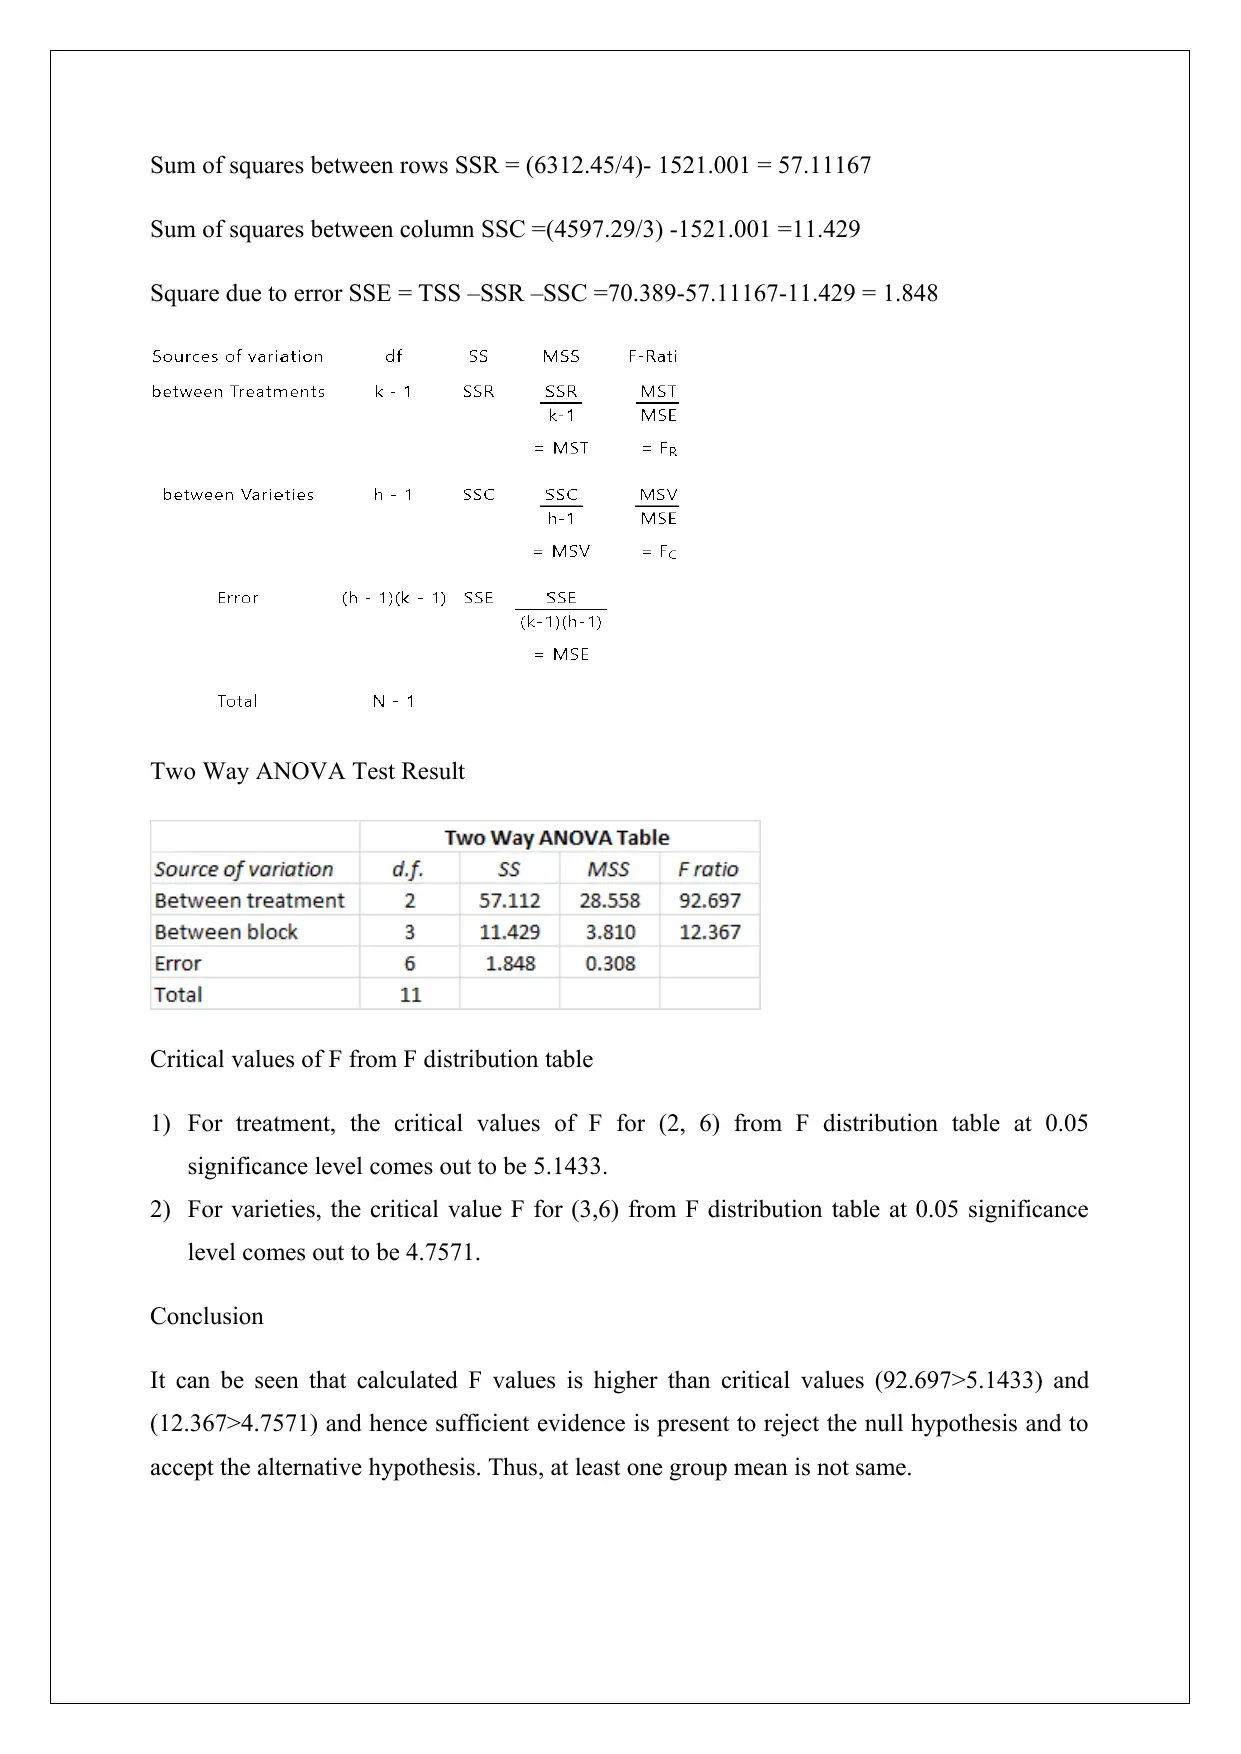
This assignment focuses on the principles of experimental design, including replication, randomization, and local control. It addresses how to manage controllable factors using a control group and differentiates between fixed and random effects in ANOVA. The solution contrasts OFAT (One Factor At a Time) with DOE (Design of Experiments), highlighting their respective advantages and disadvantages. It also includes a practical problem involving adhesive bonding strength analyzed using a two-way ANOVA test, interpreting F-values, and drawing conclusions about group means. Additional questions cover ANOVA table components, degrees of freedom, sum of squares, mean square for error, and test statistic values. The assignment further explores response and independent variables within the context of an experiment and assesses the assumptions of normality, randomness, and homoscedasticity based on residual plots.
Document Page
DESIGN OF EXPERIMENT
STUDENT ID:
[Pick the date]
tabler-icon-diamond-filled.svg

Paraphrase This Document

Need a fresh take? Get an instant paraphrase of this document with our AI Paraphraser
Document Page
Question 1
The three principles of experimental design are replication, randomization and local control.
Replication is the process where the experiment is repeated in order to estimate the
experimental error. Randomisation is a process where treatments are randomly assigned in
order to ascertain if the results obtained are significant or not. Local control ensured
application of standardised treatments so as to control the experimental error.
Question 2
The common approach to deal with such situations is to have a control group besides the
treatment group. By comparing the results of the treatment group with the control group, the
effect of the controllable factors can become immaterial since it would be captured within the
control group.
Question 3
Fixed effects in ANOVA refer to the factors having various levels which are introduced on
purpose by the researcher. In sharp contrast, random effects in ANOVA refer to those factors
which are obtaining during sampling and are not intended by the researcher.
Question 4
OFAT stands for One Factor At a Time and essentially implies method where only one factor
can be changed at a time while the others remain constant. This is in sharp contrast with DOE
where two or more factors are changed simultaneously.
Advantages of OFAT over DOE
1) Easier to understand and implement.
2) Preferred by non-experts having limited knowledge of statistical inference
3) In certain situations, OFAT is preferable to DOE.
Disadvantages of OFAT over DOE
1) Interaction estimation cannot be done through OFAT.
2) The amount of runs required to achieve same precision as DOE is quite high.
Document Page
3) The optimal conditions may be difficult to achieve.
Question 5
The response variable is essentially the dependent variable which tends to alter on account of
the treatment or changes in the independent variable and is measures by the experimenter for
drawing conclusion.
Question 6
The result from the single factor experiment regarding adhesive and bonding strength of
paper is highlighted below.
Level of significance = 0.05
Null hypothesis Ho : All group means are equal.
Alternative hypothesis H1 : At least one mean groupis not equal .
Computation
Correction factor (CF) = (135.1)2 / 12 = 1521.001
Total sum of square TSS = 1591.39 -1521.001 = 70.389
Document Page
Sum of squares between rows SSR = (6312.45/4)- 1521.001 = 57.11167
Sum of squares between column SSC =(4597.29/3) -1521.001 =11.429
Square due to error SSE = TSS –SSR –SSC =70.389-57.11167-11.429 = 1.848
Two Way ANOVA Test Result
Critical values of F from F distribution table
1) For treatment, the critical values of F for (2, 6) from F distribution table at 0.05
significance level comes out to be 5.1433.
2) For varieties, the critical value F for (3,6) from F distribution table at 0.05 significance
level comes out to be 4.7571.
Conclusion
It can be seen that calculated F values is higher than critical values (92.697>5.1433) and
(12.367>4.7571) and hence sufficient evidence is present to reject the null hypothesis and to
accept the alternative hypothesis. Thus, at least one group mean is not same.
tabler-icon-diamond-filled.svg

Paraphrase This Document

Need a fresh take? Get an instant paraphrase of this document with our AI Paraphraser
Document Page
Question 7
ANOVA Table
(a) Degree of freedom for single factor in experiment = 70.88 /14.18 = 5
(b) Number of degree of freedom for error = 23-5 = 18
(c) Sum of square for the factor = 108.63-37.75 = 70.88
(d) The mean square for error = 37.75/18 =2.10
(e) The value of test statistic = 14.18/2.10 =6.67
(f) 6 level of factor has been used in this experiment.
(g) 4 times the student has replicated the experiment.
(h) The sum of square for the block is 12 and hence, the ANOVA display would be changed.
ANOVA display
Reduction in the estimation of the experiment error = (2.10-1.72)/2.10 = 18%
Question 8
A) In the given case, the response variable is the product grain size while the independent
variable is the stirring rate and the underlying process. The experiment also contains a
nuisance or unwanted variable in the form of furnace type since none of the four furnaces are
same and comparable. Thereby the experiment seeks to understand the relation between the
variables of choice while accounting for the nuisance variable.
B) The analysis of variance model would be used as the preferred model for this experiment.
This would tend to outline two type of effects namely fixed effects and random effects. The
fixed effect is caused by the changes in process (stirring speed) with regards to the grain size.
Further, the random effect would highlight the magnitude of effect which is being produced
Document Page
on account of the nuisance variable or the differences in furnace. This model can successfully
predict whether the underlying relationship between the variables of interest is statistically
significant or not.
C) The respective degree of freedoms are summarised as indicated below.
Question 9
There are three main assumptions for ANOVA model as highlighted below.
1) Normality – Highlighted by residual normal distribution
2) Randomness
3) Homoscedasticity implying equality of variances
Based on the given diagrams, following conclusions can be made.
1) Normality – This assumption is satisfied as the normal probability plot for residuals is
almost linear which is indicative of the distribution being normal. Additional evidence is
provided by the histogram which seems to be approximately symmetric and fitting in a bell
curve indicating fulfilment of this assumption.
2) Randomness – This assumption is also fulfilled which is apparent from the random
positions occupied by the points in the scatter plot.
3) Homoscedasticity – Considering the versus fit scatter plot, it is apparent that over the
entire plot, the width of the points tend to remain constant and there is no major variation in
the width. This highlights that this assumption is also fulfilled.
chevron_up_icon
1 out of 6
circle_padding
hide_on_mobile
zoom_out_icon
[object Object]