Heat Capacity Ratio (Cp/Cv) Determination via Experimental Tests A & B
VerifiedAdded on 2023/06/03
|16
|3468
|399
Practical Assignment
AI Summary
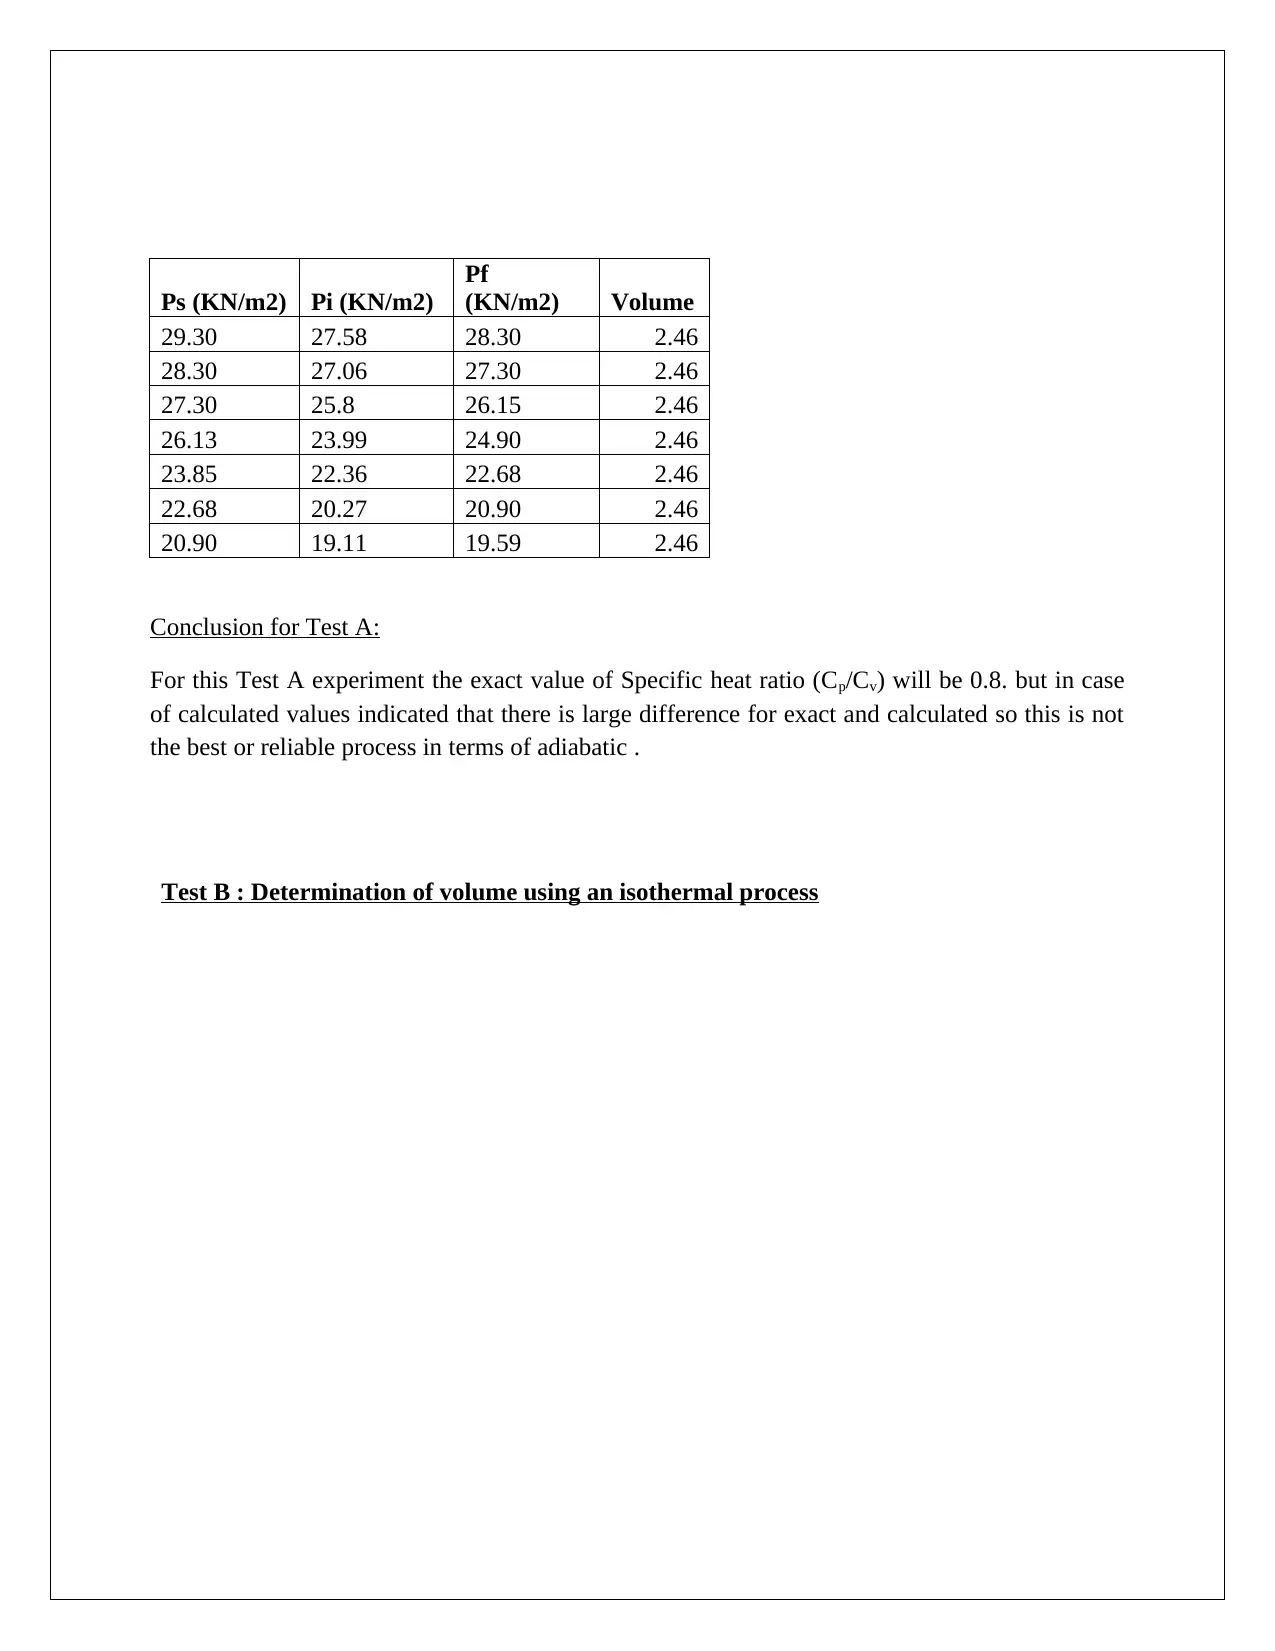
This document presents a practical assignment focusing on the determination of the heat capacity ratio (Cp/Cv) through two experimental tests, Test A and Test B. Test A involves determining the heat capacity ratio using pressure sensors and analyzing an adiabatic process, while Test B focuses on determining volume using an isothermal process. The document includes the theoretical background, equipment setup, methodology, measured values, results, and discussions for both tests. Test A explores the relationship between pressure, volume, and temperature in an adiabatic system, and Test B investigates the isothermal relationship between pressure and volume. The results from Test A show deviations from the expected specific heat ratio, while Test B provides insights into volume ratios under isothermal conditions. The experiment highlights practical applications of thermodynamics principles and the importance of accurate measurements in experimental settings. Desklib provides solved assignments and study resources for students.

2018
Test A and Test B
Test A and Test B
Paraphrase This Document
Need a fresh take? Get an instant paraphrase of this document with our AI Paraphraser

Test A: Determination of Heat capacity ratio (Cp/ Cv)
Abstract
The heat capacities are the most important thermo-physical properties of matter
and it can explained like the amount of heat essential (Q) to increase its temperature (T) by one
degree Celsius or kevin is called as the heat capacity of a substance ( C) . The unit is represented
Joule/Kelvin . When we elaborates the heat capacity ( C ) we also determine the specific heat
capacity and it is represented by (c) . The specific heat capacity of a substance may be defined as
the amount of heat essential required to increase the temperature of unit mass of it by 1 degree
Celsius or kelvin and its unit can be represented by Joule/Kg-Kelvin. Now after we can explain
the description of heat capacity ratio . The Heat capacity ratio or adiabatic index (k) or Poisson’s
constant is the ratio of heat capacities at constant pressure (Cp) to the constant volume (Cv) .
There are numerous experiments and ways by which we can give explanation of the heat
capacity ratio. One of the simplest experiment of heat capacity ratio is described for Test A. In
this experimental we will use different kind of pressure sensors which give the ideal of pressure
values at different stages .Based on these kind of values the ratio for heat capacity can be
calculated. Generally the heat capacity ratio is 1.4 for diatomic gas. In this experiment we can
calculated the value and comparison with the exact values (Ginnings et al.,1953).
Introduction
The test A set up gives the idea of adiabatic coefficient
So we can write ,
k =C p
Cv
where Cp and Cv are the constant pressure and constant volume respectively.
This is similar to the exponent in Poisson’s formula or ratio’s
pvk=constant
Theory for test A
Considering a system as shown in Figure 1

Figure 1: Piston arrangement
According to the above piston arrangement based system the q indicates that the gas or heat and
the gas or heat is expanded due to piston kind arrangement . We can observed from the figure 1
that whenever the gas molecules excited the molecules movement with highest rate. In this
experiment the kinetic energy (KE) of the gas molecules starts progressing. From the basis
concept of mechanics, for a moving object kinetic energy plays an significant role. After the
concept of heat the internal energy (U) concept comes in mind and it can define as the total
energy is the summation of the kinetic energy(K.E) and the potential energy (P.E). For this test A
the internal energy is fully depend on temperature or function of temperature. And it can be
explained by below forms :
dU =Cv dT
dH =Cp dT
The representation with units are following as :
dU - respresent change in internal energy (Kilo-Joule /Kg)
Cp and Cv is the specific heat for gas at constant pressure and constant volume
(Kilo-Joule/KgKelvin)
dT - change in temperature (Kelvin)
Enthalpy is the total heat content of system and it can be expressed f(T) It is denoted by H
(KJ/kg) or (J/Kg).
If case if no heat enter or leaves from the system then this type of system is called the adiabatic
process.
From the above know internal energy (dU) is
dU =Cv dT - (i)
dH ( Enthalpy )=Cp dT -- (ii)
⊘ This is a preview!⊘
Do you want full access?
Subscribe today to unlock all pages.

Trusted by 1+ million students worldwide

From the first law of basic engineering thermodynamics,
So,
dq=dU + dW
For an thermodynamics adiabatic process, heat transfer is zero , dq=0
That means dU =−dW
As we know dW = pdV
So dU =− pdV
dU =Cv dT =−pdV
Considering the P-V graph shown in Figure 2.
Figure 2 : PV curve for adiabatic process
According to ideal gas equation ,
PV =nRT
pdV =RdT
Cv dT =−RdT
Paraphrase This Document
Need a fresh take? Get an instant paraphrase of this document with our AI Paraphraser

Cv∫
Ti
T f
dT
T =−R∫
Ti
T f
dV
V
Cv ln T f
Ti
=−R ln V f
V i
PV
T = constant (ideal gas),
V i Pi
T i
= V s Ps
T s
T i
T s
= V i Pi
V s Ps
Cv [ln ( Pi
Ps
)+ ln ( V i
V s
)]=−R ln ( V f
V i
)
We know that PV = constant for an ideal gas,
PsVs = PfVf
Substituting this we get
CP
CV
=
ln( Ps
Pf )
ln( Pi
Ps )
From the above heat capacity ratio can be expressed in ( P¿¿ s+ Pf )
2 ¿at the temperature Ts
Equipment for test A:
Ti
T f
dT
T =−R∫
Ti
T f
dV
V
Cv ln T f
Ti
=−R ln V f
V i
PV
T = constant (ideal gas),
V i Pi
T i
= V s Ps
T s
T i
T s
= V i Pi
V s Ps
Cv [ln ( Pi
Ps
)+ ln ( V i
V s
)]=−R ln ( V f
V i
)
We know that PV = constant for an ideal gas,
PsVs = PfVf
Substituting this we get
CP
CV
=
ln( Ps
Pf )
ln( Pi
Ps )
From the above heat capacity ratio can be expressed in ( P¿¿ s+ Pf )
2 ¿at the temperature Ts
Equipment for test A:

a. A common base plate: The large and the small container are fixed by the common
base plate for test A.
b. A top plate: Air pump is attached with the top plate.
c. Sensors: There are two types of sensors are used for test A such as pressure and
temperature . In case of pressure sensors total two sensors basically used first is for
measuring the pressure inside the larger container and other for measurement of
vacuum in small container .The pressure sensor causes the reading by change in the
indication. By using these pressure sensors the pressure values reading are noted
down. But temperature sensor continuously measure the temperature of large and
small container.
d. Valves
(i) The valve V1 is connected with the large container In order to liberate the
pressure on to the atmosphere this valve is having main role.
(ii) The valve V3 is connected to the small container.
(iii) The valve V5 is used for connecting the pump on to the large vessel with the
top plate.
Methodology and Procedure:
Turn off the valves V1 as well as V3 and during this time make sure that there I no air
reaches the containers. After that you can open the valve V4. The V4 is mainly connected
between the pump and the container. Keep the large container in pressure
mode and start watching the pressure Ps. After some time when the
pressure reaches 30 kilo Newton / m2, the valve and pump is in closed
condition. The content of the container is allowed to be cooled in stages and
pressure P will fall gradually. Be careful before cooling and do not forget to
measure pressure Ps for this test.
After some time you can open the first valve V1 suddenly to escape a small amount of air to
escape from the large container. The instantaneous value that is Pi needs to be noted. And allow
the container to be stabilized and note down the pressure Pf for this case. Each time Ps values is
also noted as well measured. In this way operate the first valve V1 so that Pf Values will almost
equal to Ps Values. The procedure can be summarized in below steps are :
⊘ This is a preview!⊘
Do you want full access?
Subscribe today to unlock all pages.

Trusted by 1+ million students worldwide

1 First of all you have to connect the containers with the help of the mostly used equipment
that is common base plate.
2 Then you have pressurize the large container and use pump only because it will be
connected to the large container with the top plate.
3 Now the turn on for the valves gates.
4 Then close the remaining valves gates and make sure the large container is opened and
pressurize this valve.
5 After some time close the valve and permit the valve no 1 (V1) to open suddenly so that
air will enter into the large container.
6 Each time the note down the initial, intermediate and final pressure pressures are noted.
7 Based on these pressures and the given formula we can calculate the Specific heat ratio
CP
CV
. Then the experiment is repeated if any sudden fall in pressure .
8 The heat capacity ratio can be analyzed very well with the help of this experiment.
Measured Values for test A:
As described in the procedure each time the initial, intermediate and final pressure are noted and
the measured values are shown below in table 1.
Run Ps (KN/m2) Pi (KN/m2) Pf (KN/m2) ln (Ps/Pi) ln (Ps/Pf) Cp/Cv
1 29.30 27.58 28.30 0.060496 0.034725 0.57
2 28.30 27.06 27.30 0.044805 0.035975 0.80
3 27.30 25.8 26.15 0.056512 0.043037 0.76
4 26.13 23.99 24.90 0.085447 0.048216 0.56
5 23.85 22.36 22.68 0.064510 0.050301 0.78
6 22.68 20.27 20.90 0.112341 0.081734 0.73
7 20.90 19.11 19.59 0.089537 0.064729 0.72
Table 1
The heat capacity ( C ) v/s pressure (P ) graph is shown in Figure 3 are below :
Paraphrase This Document
Need a fresh take? Get an instant paraphrase of this document with our AI Paraphraser

1 2 3 4 5 6 7
0
5
10
15
20
25
30
35
Ps (KN/m2)
Pi (KN/m2)
Pf (KN/m2)
Cp/Cv
Figure 3
The initial expansion process can be measured as an adiabatic process (q=0).
Consider the P-V graph shown in Figure 4
1 2 3 4
0
10
20
30
40
50
60
Pf
P2s
P1s
Figure 4
Considering the P-V diagram(adiabatic process) in Figure 4 . There is no heat transfer (Q=0) or
exchange between the system as well as surrounding. The thermo-adiabatic process can occur
for an extremely short instance. A system may expand/contracts during an thermo-adiabatic
0
5
10
15
20
25
30
35
Ps (KN/m2)
Pi (KN/m2)
Pf (KN/m2)
Cp/Cv
Figure 3
The initial expansion process can be measured as an adiabatic process (q=0).
Consider the P-V graph shown in Figure 4
1 2 3 4
0
10
20
30
40
50
60
Pf
P2s
P1s
Figure 4
Considering the P-V diagram(adiabatic process) in Figure 4 . There is no heat transfer (Q=0) or
exchange between the system as well as surrounding. The thermo-adiabatic process can occur
for an extremely short instance. A system may expand/contracts during an thermo-adiabatic

process. In case if the system is said to be in an expansion state then the internal energy (U) will
always decreases and for compression stages then the internal energy (U) will always increases.
Results and Discussions Test A :
The following results can be obtained are below :
Run Ps (KN/m2) Pi (KN/m2) Pf (KN/m2) ln (Ps/Pi) ln (Ps/Pf) Cp/Cv
1 29.30 27.58 28.30 0.060496 0.034725 0.57
2 28.30 27.06 27.30 0.044805 0.035975 0.80
3 27.30 25.8 26.15 0.056512 0.043037 0.76
4 26.13 23.99 24.90 0.085447 0.048216 0.56
5 23.85 22.36 22.68 0.064510 0.050301 0.78
6 22.68 20.27 20.90 0.112341 0.081734 0.73
7 20.90 19.11 19.59 0.089537 0.064729 0.72
Cp/Cv=
ln ( Ps
Pf )
ln ( Pi
Ps )
0.034/0.060 = 0.57
0.035/0.044 = 0.80
0.043/0.056 = 0.76
0.048/0.085 = 0.56
0.050/0.064 = 0.78
0.081/0.112 = 0.73
0.064/0.089 = 0.72
⊘ This is a preview!⊘
Do you want full access?
Subscribe today to unlock all pages.

Trusted by 1+ million students worldwide

Ps (KN/m2) Pi (KN/m2)
Pf
(KN/m2) Volume
29.30 27.58 28.30 2.46
28.30 27.06 27.30 2.46
27.30 25.8 26.15 2.46
26.13 23.99 24.90 2.46
23.85 22.36 22.68 2.46
22.68 20.27 20.90 2.46
20.90 19.11 19.59 2.46
Conclusion for Test A:
For this Test A experiment the exact value of Specific heat ratio (Cp/Cv) will be 0.8. but in case
of calculated values indicated that there is large difference for exact and calculated so this is not
the best or reliable process in terms of adiabatic .
Test B : Determination of volume using an isothermal process
Paraphrase This Document
Need a fresh take? Get an instant paraphrase of this document with our AI Paraphraser

Abstract for Test B :
In this test B basically temperature will be remains constant and other parameters other than
temperature such as pressure and volume are changing and inversely proportional to each other
and this process is called an isothermal process. In this test B we can get clear understanding of
the volume ratio V 1
V 2
in an isothermal process. The expected values of volume ratio’s are already
mentioned in test B. In this experiment the volume ratio’s is not constant in all four runs so
simply we can say this isothermal process is relatively more consistent.
Introduction
The Mass of the two vessels large and small will be always conserved. This is the main
principle behind this experiment part II. This is an isothermal process and temperature will
remains same throughout the process but pressure and volume will be vary. Thermal indicates
the heat of a system and iso means equal or same so isothermal in general sense the equal heat
which means said to be thermal equilibrium(Ponce-Ortega et al.,2008).
Theory
We know that ,
Pressure (P) x Volume (V) = mRT,
Where m is the total mass of the containers
T indicate the equilibrium temperature,
Therefore the final equilibrium state of pressure
Pf = mRT
V ---------- (i)
Total m=m1 +m2
Pf = (m¿¿ 1+m2)
V RT ¿ - (ii)
Where
m1∧m2 are themasses of bothcontainers .
We know that,

Mass of 1 st Container=m1= V 1 P1 s
RT
Mass of 2nd Container ¿ m2= V 2 P2 s
RT
Substituting the values of m1∧m2 ∈equationii then we will get volume ratio,
V 1
V 2
= P2 S −Pf
Pf −P1 S
The PV graph is shown below figure 1.
Pressure
Volume (V)
Figure 1 : PV graph (Isothermal)
Equipments used for test B :
(iv) Common base plate: The large and the small container are attached by the
common base plate for test B.
(v) A top plate: The Air pump is fixed with the top plate.
(vi) Sensors: There are two types of sensors are used for test B such as pressure
and temperature . In case of pressure sensors total two sensors basically used
first is for measuring the pressure inside the larger container and other for
measurement of vacuum in small container. By using these pressure sensors
the pressure values reading are noted down. But temperature sensor
continuously measure the temperature of large and small container.
The below valves are also the part of equipment for test B so explained below :
RT
Mass of 2nd Container ¿ m2= V 2 P2 s
RT
Substituting the values of m1∧m2 ∈equationii then we will get volume ratio,
V 1
V 2
= P2 S −Pf
Pf −P1 S
The PV graph is shown below figure 1.
Pressure
Volume (V)
Figure 1 : PV graph (Isothermal)
Equipments used for test B :
(iv) Common base plate: The large and the small container are attached by the
common base plate for test B.
(v) A top plate: The Air pump is fixed with the top plate.
(vi) Sensors: There are two types of sensors are used for test B such as pressure
and temperature . In case of pressure sensors total two sensors basically used
first is for measuring the pressure inside the larger container and other for
measurement of vacuum in small container. By using these pressure sensors
the pressure values reading are noted down. But temperature sensor
continuously measure the temperature of large and small container.
The below valves are also the part of equipment for test B so explained below :
⊘ This is a preview!⊘
Do you want full access?
Subscribe today to unlock all pages.

Trusted by 1+ million students worldwide
1 out of 16
Related Documents

Your All-in-One AI-Powered Toolkit for Academic Success.
+13062052269
info@desklib.com
Available 24*7 on WhatsApp / Email
Unlock your academic potential
Copyright © 2020–2025 A2Z Services. All Rights Reserved. Developed and managed by ZUCOL.