Impact of Exports on GDP: An Analysis of the Australian Economy
VerifiedAdded on 2020/05/16
|25
|4871
|61
Report
AI Summary
This professional project examines the impact of exports on the Gross Domestic Product (GDP) of Australia. The study utilizes a quantitative research design, including a literature review and regression analysis, to validate existing theories on the relationship between exports and GDP. The research explores the influence of various factors, such as manufacturing costs, trade relations, climatic changes, currency exchange fluctuations, and factor endowments, on Australia's GDP. The project aims to identify the impact of exports on the Australian economy and evaluate the different elements of export affecting GDP, employing secondary data analysis from sources like the Australian Bureau of Statistics and the World Bank. The findings indicate a positive correlation between exports and GDP in Australia, contributing valuable insights into the country's economic dynamics and trade policies. This report is a contribution to Desklib, a platform offering AI-based study tools for students.
Running head: PROFESSIONAL PROJECT
Professional Project
Name of the student
Name of the university
Author note
Professional Project
Name of the student
Name of the university
Author note
Paraphrase This Document
Need a fresh take? Get an instant paraphrase of this document with our AI Paraphraser
2PROFESSIONAL PROJECT
Executive Summary
This study has illustrated the impact of exports of products on gross domestic product of a
country. This study has considered the Gross domestic product of Australia and their export
behaviour. The study had analysed relevant scholarly articles and peer reviewed journals to
prove the existing theories. The study had used a single research design to conduct quantitative
analysis to validate the existing theories. The study has proved that there is positive correlation
between exports and Gross domestic product of Australia.
3PROFESSIONAL PROJECT
Table of Contents
Chapter 1..........................................................................................................................................5
1.0 Introduction................................................................................................................................5
1.2 Research Aim and Objective.....................................................................................................6
1.3 Research Hypothesis..................................................................................................................6
1.4 Research Question.....................................................................................................................6
2.2 Gross Domestic Product............................................................................................................8
2.3 Relationship between Exports and Gross Domestic Product....................................................9
3.0 Research Methodology............................................................................................................10
3.1 Research Philosophy................................................................................................................10
3.2 Research Approach..................................................................................................................10
3.3 Research Purpose.....................................................................................................................11
3.4 Data Collection Method...........................................................................................................11
3.5 Data Analysis Technique.........................................................................................................11
3.6 Sampling Technique................................................................................................................12
3.7 Research Ethics........................................................................................................................12
3.8 Research Limitation.................................................................................................................12
4.0 Findings and Analysis..............................................................................................................13
4.1 Quantitative analysis................................................................................................................13
4.2 Different factors affecting GDP of Australia...........................................................................19
⊘ This is a preview!⊘
Do you want full access?
Subscribe today to unlock all pages.
Trusted by 1+ million students worldwide
4PROFESSIONAL PROJECT
4.3 Regression Analysis.................................................................................................................21
5.0 Conclusion...............................................................................................................................25
5.1 Objective 1- To find the impact of export on the GDP of a nation..........................................25
5.2 Objective 2- To evaluate the factors of export that impacts the GDP of a nation..................25
References......................................................................................................................................26
Paraphrase This Document
Need a fresh take? Get an instant paraphrase of this document with our AI Paraphraser
5PROFESSIONAL PROJECT
Chapter 1
1.0 Introduction
This study will illustrate the impact of exports of products on gross domestic product of a
country. This study will consider the Gross domestic product of Australia and their export
behaviour. The study will analyze relevant scholarly articles and peer reviewed journals to prove
the existing theories.
1.1 Background of the study
Gross domestic product represents the economic growth of the country as identifies the
trade activities and time span of activities. The national income of a country is used to calculate
the gross domestic product of the country. As stated by McCombie and Thirlwall, (2016),
increase in exports will have a positive impact on gross domestic product and vice versa.
However, the short-term impact of exports on gross domestic product will be different when
compared to the long-term impact of exports. The economic structure of an economy will
determine the way in which the export will influence the gross domestic product. There are
various elements of exports, which if changed there will be changes in pattern of gross domestic
product. Australia has been one of the largest exporters of agricultural products, which includes
livestock and wheat. Thus, the production cost in the country is less and is least in the production
of grains. Endowments patterns are influenced by the factors such as climatic change. The
change in climate will affect the production of agricultural products, which means that adverse
effect of climatic condition will diminish the value of Australia as an exporter (Belloumi, 2014).
6PROFESSIONAL PROJECT
This shows that fluctuation in the endowment factors can have both positive impact and negative
impact on the gross domestic product of Australia.
1.2 Research Aim and Objective
The study is aiming to identify the impact of exports on the economy of a country. The
different elements of export will have a positive or negative impact on the different elements of
Gross domestic product. The study will investigate how the elements of exports are affecting the
factors of gross domestic product. The impact of GDP is different in different countries as it
depends on the economic setting and the study will specifically identify the influence in the
Australian context.
Research objectives
To identify the impact of exports on Gross Domestic Product
To evaluate the different elements of export affecting Gross Domestic product
1.3 Research Hypothesis
H0 – Exports does not have any impact on Gross Domestic Product
H1 – Exports have impact on Gross Domestic Product
1.4 Research Question
What is the impact of exports on Gross Domestic Product?
What is the significance of exports on Gross Domestic Product?
⊘ This is a preview!⊘
Do you want full access?
Subscribe today to unlock all pages.
Trusted by 1+ million students worldwide
7PROFESSIONAL PROJECT
What are the different elements of exports?
What are the different factors affecting Gross Domestic Product?
What is the impact of factor endowment on Gross Domestic product?
2.0 Literature review
2.1 Exports
As stated by Ajmi et al., (2015), exports can be defined as the goods leaving the country
by depleting the natural resources. Exports of goods play a vital role in growth of an economy as
it contributes to the national income. Exports will increase the opportunity of employment and
account deficit of a country. The developing countries have been using exports to enter the
global market and globalization has helped various economies in increasing their market share
globally.
Manufacturing cost
Manufacturing cost will determine the amount of export a country can make. The
decrease in manufacturing will increase the export quantity especially for developing countries.
The foreign will acquire products at cheaper cost due to the less cost of manufacturing for the
product (Dritsakis & Stamatiou, 2017). This shows that inverse relationship between
manufacturing cost and exports of the country. These consist of various factors such as cost of
raw materials and cost of labours. When production cost increases, there is decrease in market
competitiveness for that country. Trade relations are developed based on import and export
activities and countries rich in resources use it to their advantage to monopolize the market.
Paraphrase This Document
Need a fresh take? Get an instant paraphrase of this document with our AI Paraphraser
8PROFESSIONAL PROJECT
Climatic change
The change in climate generally affects the countries exporting agricultural products to
the different countries. The adverse changes in the climatic condition will decrease the
production volume, which increases the demand. However, due to the decrease in production
volume, there will be fewer amounts of exports, which will add less value to the national income
of the country (Costinot, Donaldson & Smith, 2016). Therefore, the country having abundance of
resources in a particular department will be focused on protecting the resources form adverse
climatic conditions. On the contrary, increase in exports increase the contamination of
surrounding environment. Thus, with increase in exports, there will be short-term increase in the
gross domestic product of the country but in a long-term perspective; there will be decrease in
exports. This is mainly due to the increase in operational barrier.
2.2 Gross Domestic Product
As stated by Van den Berg, (2016), Gross domestic Product defines the market value of
all the goods in a given point of a time in a country. Therefore, GDO is the indicator of health
and size of any country. GDP includes income from all the sector and nothing is subtracted from
it. GDP can be divided into two factors such as Real GDP and Nominal GDP. The real GDP
measures the prices of the product that is being produced in a country. The nominal GDP will
consist of the monetary value of the goods which changes depending upon the changes in the
original prices of the goods.
Currency exchange fluctuation
9PROFESSIONAL PROJECT
The exchange value of currency fluctuates most of the times and the country having
stable exchange value are having a string economic setting. However, in most of the time
countries purposefully depreciates their monetary value to facilitate their export. As stated by
Aldcroft, (2017), appreciation in currency will decrease the export levels and increase imports of
the country. However, fluctuation in currency exchange rates will determine the underlying
economy of a country.
Factor Endowment
The factor endowment theory states that different countries will have abundance
resources in different areas. This defines comparative advantage in the global market. The heavy
endowed goods in a country will provide the economy with boost. Thus, most of the countries
focus on the abundant resources for improving market economy (Ju, Lin & Wang, 2015). The
country having abundance in capital to labour should be more efficient in developing
technological products rather than agricultural products. Thus, identify the resources for gaining
comparative advantage effective utilization of resources is required.
2.3 Relationship between Exports and Gross Domestic Product
The amount of exports of any country will have an impact on the growth of the economy.
Exports are an essential component of GDP and GDP can be denoted as GDP= consumption
spending +investment+ government spending + (exports -imports) (Farhani & Ozturk, 2015).
This equation shows that if the export component increases there will be increase in the GDP of
the country. Moreover, foreign trade is an important component of comparative analysis where
trade deficit signifies decrease in GDP and trade surplus signifies increase in GDP.
⊘ This is a preview!⊘
Do you want full access?
Subscribe today to unlock all pages.
Trusted by 1+ million students worldwide
10PROFESSIONAL PROJECT
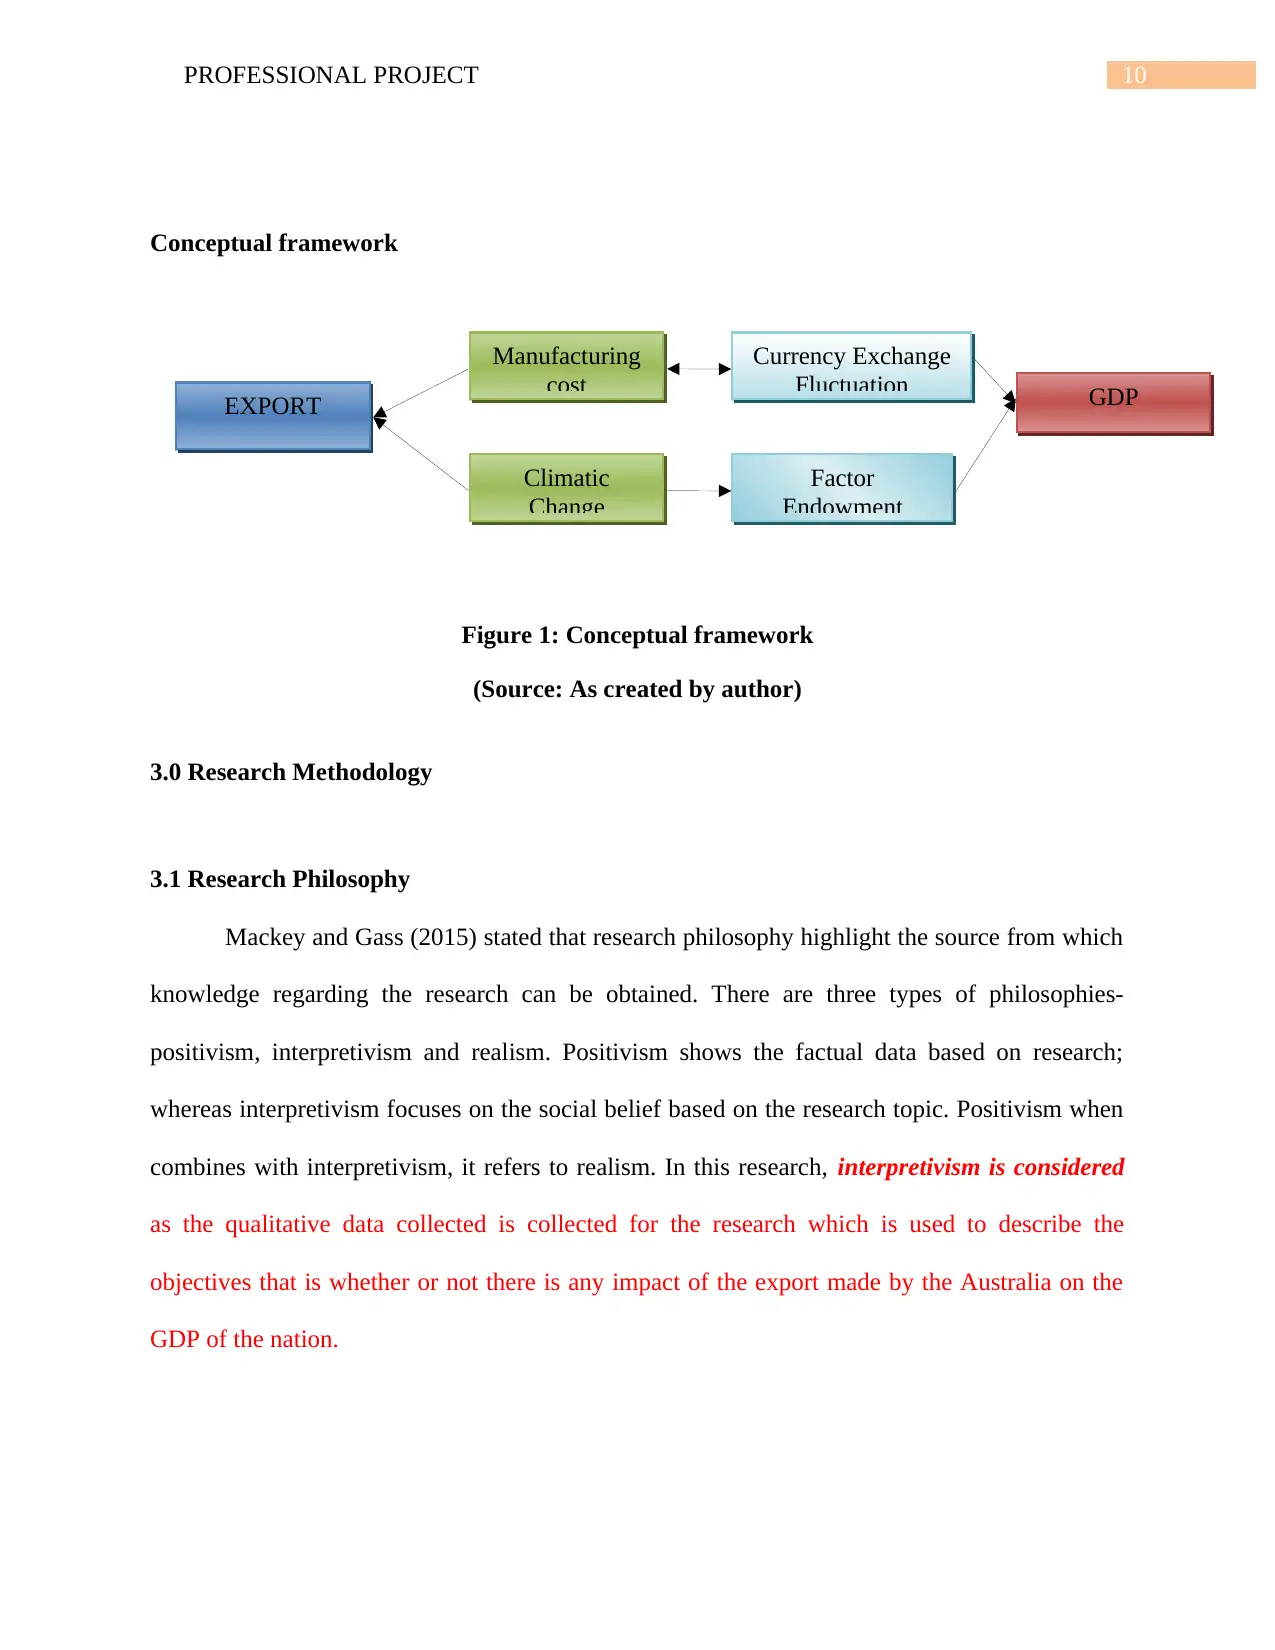
Conceptual framework
Figure 1: Conceptual framework
(Source: As created by author)
3.0 Research Methodology
3.1 Research Philosophy
Mackey and Gass (2015) stated that research philosophy highlight the source from which
knowledge regarding the research can be obtained. There are three types of philosophies-
positivism, interpretivism and realism. Positivism shows the factual data based on research;
whereas interpretivism focuses on the social belief based on the research topic. Positivism when
combines with interpretivism, it refers to realism. In this research, interpretivism is considered
as the qualitative data collected is collected for the research which is used to describe the
objectives that is whether or not there is any impact of the export made by the Australia on the
GDP of the nation.
EXPORT GDP
Climatic
Change
Manufacturing
cost
Factor
Endowment
Currency Exchange
Fluctuation
Paraphrase This Document
Need a fresh take? Get an instant paraphrase of this document with our AI Paraphraser
11PROFESSIONAL PROJECT
3.2 Research Approach
Deductive and inductive are the two types of research approach (Neuman, 2013).
Research question are first developed and the data collected are analyzed to answer those
questions in deductive approach. In inductive approach, data are first collected and analyzed to
find new direction in a research. In this research study, deductive approach is utilized as the data
collected obtained is analyzed to address the impact of export on GDP of Australia.
3.3 Research Purpose
Exploratory and descriptive are two research purposes used in research study. Flick
(2015) stated that when new theories are explored from data, exploratory purpose is used;
whereas when the objectives is described through the findings of the research, descriptive
purpose is followed. In this research, descriptive purpose is followed as the research objectives
are described through the obtained data from survey.
3.4 Data Collection Method
Data are collected through two ways- primary and secondary process. Panneerselvam
(2014) stated that primary data are collected directed from research respondents through survey,
interviews and questionnaires. Moreover, when research papers, articles, websites and journals
are considered to obtain data, this process is known as secondary data collection. In this research,
secondary data collection is utilized to obtain data based on research question. The selected
secondary sources are taken from the government site of “Australia Bureau of Statistics” for
characteristics of Australian exporters and GDP growth report published by The World Bank.
12PROFESSIONAL PROJECT
3.5 Data Analysis Technique
Primary and secondary data are analyzed through quantitative and qualitative data
analysis techniques respectively (Smith, 2015). In this research study, quantitative analysis
method is used. The obtained data is analyzed through regression analysis and the data is
evaluated in Microsoft Excel.
3.6 Sampling Technique
Bryman and Bell (2014) stated that the selection of samples for a research is done
through two different ways- probability and non-probability sampling technique. Probability
sampling technique refers to the situation when respondent get equal chance to participate in a
research (Neuman, 2013). On the other hand, when selective respondents are selected, non-
probability sampling technique is used. In this research, non-probability sampling technique is
used as only two websites are considered as sources to obtain the data.
3.7 Research Ethics
All the reports considered are based on the details of GDP growth for Australia and
export reports that is done from Australia. These data are not manipulated and the exact situation
is written in the report.
3.8 Research Limitation
This research only considers secondary data that does not represent the current situation
and illustrate only outdated data. Moreover, the research outcome only illustrates the scenario of
Australia and hence not applicable on an international level.
⊘ This is a preview!⊘
Do you want full access?
Subscribe today to unlock all pages.
Trusted by 1+ million students worldwide
1 out of 25
Related Documents


Your All-in-One AI-Powered Toolkit for Academic Success.
+13062052269
info@desklib.com
Available 24*7 on WhatsApp / Email
![[object Object]](/_next/static/media/star-bottom.7253800d.svg)
Unlock your academic potential
Copyright © 2020–2026 A2Z Services. All Rights Reserved. Developed and managed by ZUCOL.