EXSC 610: Analysis of ECG Waveforms and Heart Rate Methods
VerifiedAdded on 2022/12/14
|8
|1640
|1
Homework Assignment
AI Summary
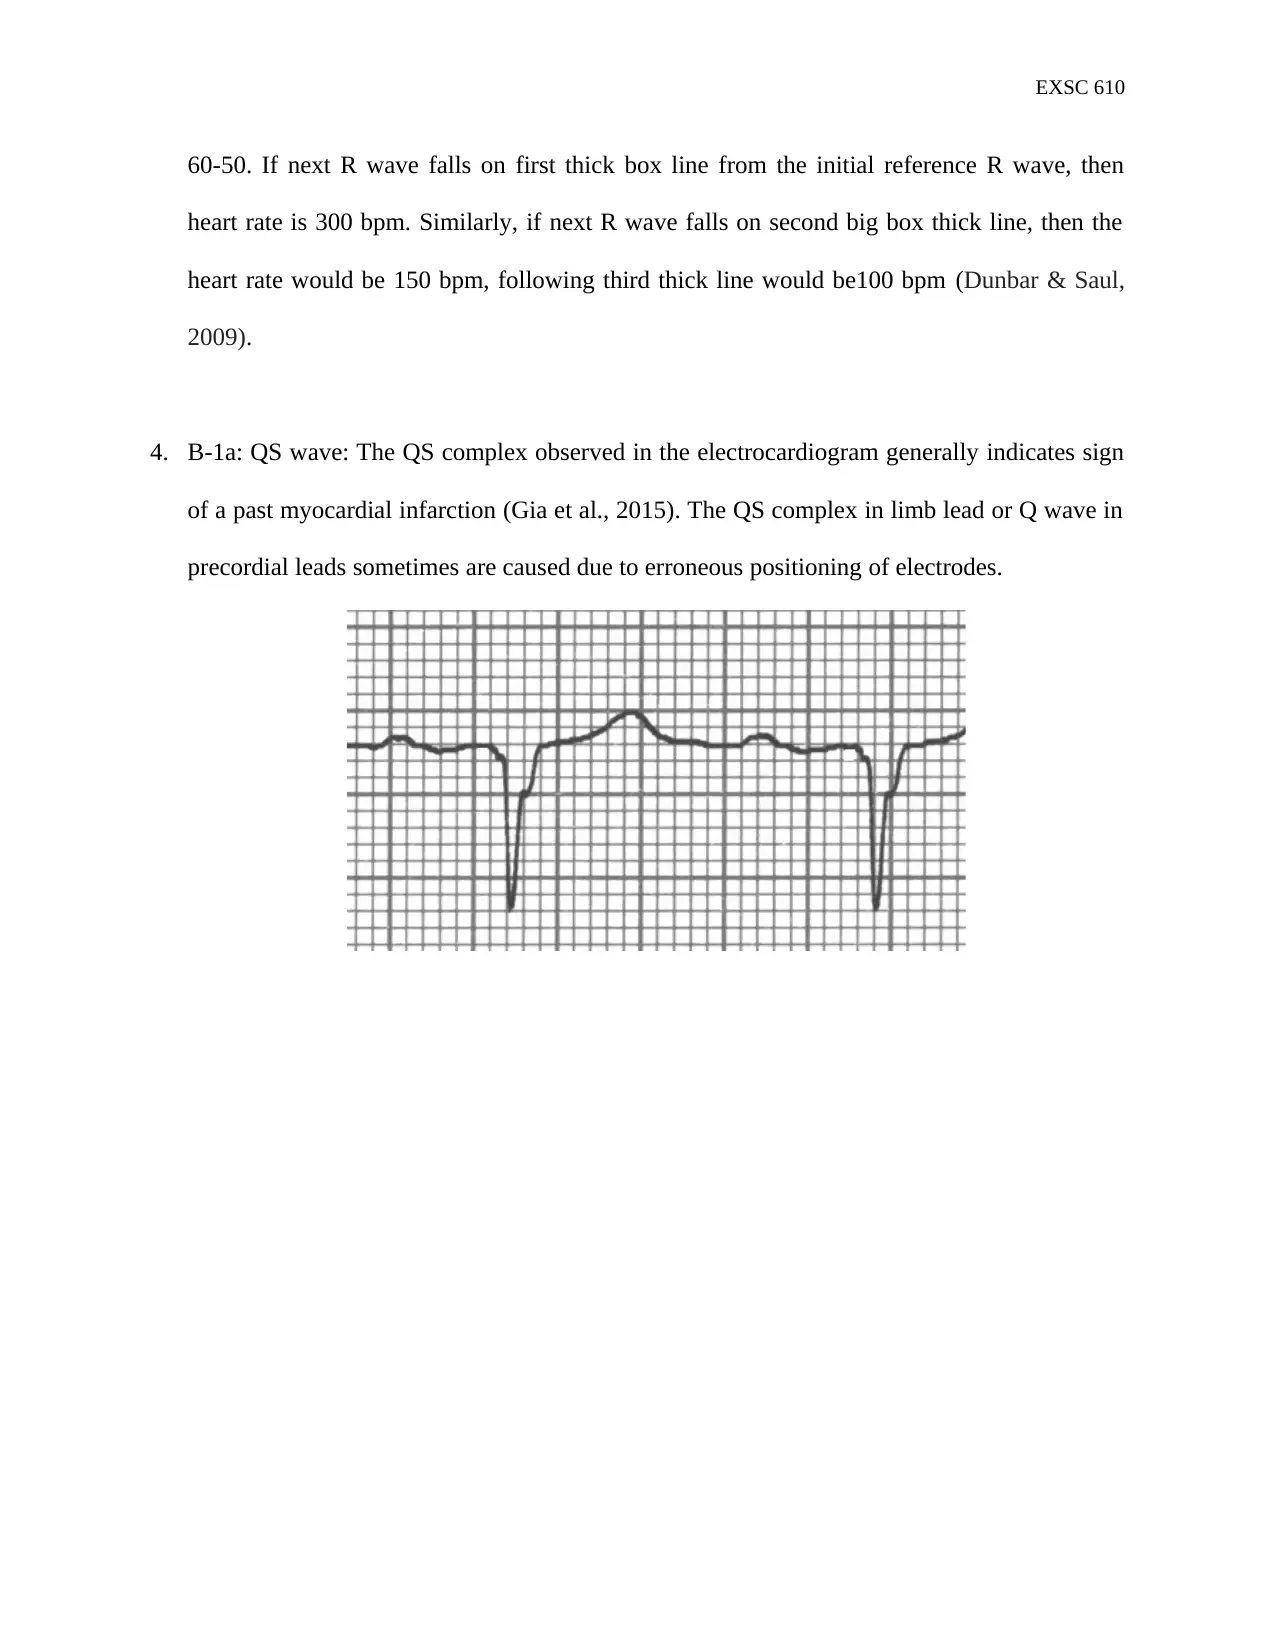
This document provides a comprehensive solution to an EXSC 610 assignment, focusing on the analysis of electrocardiograms (ECGs). The assignment delves into the interpretation of ECG waveforms, specifically the P wave, QRS complex, and T wave, explaining their physiological significance. It also details two methods for calculating heart rate: the 1500 method and the triplets method, providing step-by-step explanations for each. Furthermore, the solution analyzes specific QRS complex morphologies, including QS wave, R'r wave, and deep S wave, linking them to potential clinical implications such as myocardial infarction and ventricular hypertrophy. The document is well-referenced, citing the course textbook and additional scholarly sources to support the interpretations and methods described.

EXSC 610
1. P wave
P wave is the summation wave produced by depolarization front when it transits into atria.
Typically the right auricle depolarizes marginally earlier compared to the left atrium as the
depolarization surge initiates in sinoatrial node followed into right atrium, then journeys to
the left atrium (Dunbar & Saul, 2009). Depolarization front then carried via atria along with
semi-specialized conduction path which includes Bachmann's bundle which results into the
uniform formed waves (Elgendi, Meo & Abbott, 2016). The depolarization wave originating
somewhere else in atria namely the atrial ectopics results in the formation of P waves with
different morphology when compared to the normal.
QRS complex
The QRS complex reflects the combination of 3 graphical deflections observed in typical
electrocardiogram. It is generally the most significant and visible part of ECG tracing along
with being the main spike on the ECG line (Dunbar & Saul, 2009). The QRS complex
corresponds to depolarization of right and the left ventricles of human heart in addition to the
contraction of large muscles of the ventricles (Yochum, Renaud & Jacquir, 2016). In the
adults, QRS complex generally lasts from 0.06 second to 0.10 seconds, however, in children
along with time during the physical activities, it might be shorter. The Q wave, the R wave,
along with the S wave occur in quick succession therefore might not appear in all the leads,
thus leading to single event occuring together. The Q wave is the downward deflection,
following P wave immediately. The R wave is seen right after the Q wave as the upward
deflection followed by the S wave which is any descending deflection right after R wave. T
Paraphrase This Document
Need a fresh take? Get an instant paraphrase of this document with our AI Paraphraser

EXSC 610
wave comes after the S wave along with an extra U wave in some cases which follows T
wave.
T wave
The T wave signifies repolarization of ventricles. During the ventricle contraction which
generates the QRS complex, heart depolarizes (Dunbar & Saul, 2009). The repolarization
event of ventricle occurs in opposite direction of the depolarization, representing relaxation
of cardiac muscle of ventricles.T wave, indicated mostly by a positive rounded peak on he
ECG graph, comes after the S wave of the QRS complex. Interval from beginning of QRS
complex till the T wave’speak is denoted as absolute refractory period (Elgendi, Meo &
Abbott, 2016). The T wave is significant as it present wight before the event of next
depolarization.Absence or T-wave or presence of peculiarly shaped T-wave might signify
disruption of repolarization along with ventricular anomaly.
2. 1500 method of calculating heart rate
The 1500 method of calculating heart rate is the most accurate method which can precisely
calculate the heart rate when it is slow (Dunbar & Saul, 2009). The R-R intervals are
measured by counting the small boxes between the distance from one R wave to the next R
wave. At regular calibration where the speed of the paper being fed to the
electrocardiography device is 25mm/sec. The R to R interval is calculated in millimeters
which is one small box, therefore the total number of small boxes between two R waves are
counted, followed by dividing 1500 with the distance betwwen the two R-R waves in

EXSC 610
millimeters or number of small boxes for the determination of the rate of heart (Wasfy et al.,
2015).
Therefore, the 1500 method of calculating heart rate
Rate of heart = 1500 / (distance between in millimeters or number of small boxes flanked
between two consecutive R waves)
If the intervals between two consecutive R waves are fairly regular and consistent, on
measurement is sufficient to calculate the rate of heart. Howver, if the intervals between two
consecutive R waves are irregular and distance between the R waves is inconsistent, then
multiple R-R distances need to be measured and mean heart rate can be obtained. For the
highest accuracy, every R-R interval needs to be measure and the average rate of heart
measured will be most precise (Dunbar & Saul, 2009).
3. The triplets method for determining heart rate
The triplet method of determining the rate of rate from an electrocardiogram is a easier and a
quicker method of calculating the rate of heart (Dunbar & Saul, 2009). Firstly, it must be
established that QRS complexes are at regular intervals and the distance between the R-R
interval is fairly consistent. The consistency is important as varying R-R intervals will affect
the heart rate estimation by triplet method. The triplet method to calculate heart rate with
irregular varying R-R intervals can be used however the accurate rate would require
averaging several R-R intervals and calculating accordingly. Th easiest method to use triplets
method is by finding a R wave or a S wave which falls on a thick line of a big box. The
distance of the big boxes to the next R wave or the S if a S wave was initially used, is
counted using the "triplets rule" which goes in the following pattern of 300-150-100 or 75-
⊘ This is a preview!⊘
Do you want full access?
Subscribe today to unlock all pages.

Trusted by 1+ million students worldwide

EXSC 610
60-50. If next R wave falls on first thick box line from the initial reference R wave, then
heart rate is 300 bpm. Similarly, if next R wave falls on second big box thick line, then the
heart rate would be 150 bpm, following third thick line would be100 bpm (Dunbar & Saul,
2009).
4. B-1a: QS wave: The QS complex observed in the electrocardiogram generally indicates sign
of a past myocardial infarction (Gia et al., 2015). The QS complex in limb lead or Q wave in
precordial leads sometimes are caused due to erroneous positioning of electrodes.
Paraphrase This Document
Need a fresh take? Get an instant paraphrase of this document with our AI Paraphraser

EXSC 610
B-2a.R’r wave: RsR’ pattern is frequently occuring electrocardiographic phenomenon that is
highlighted by the anticipated increase of the R-wave amplitude which fails to occur, as
recorded by the consecutive precordial leads namely V1 to V5. The poor R-wave progression
is observed for patients with coronary artery disease (Yochum, Renaud & Jacquir, 2016).
Due to presence of a right bundle branch block, there might be two R waves which results in
classic “bunny ear” reading on the electrocardiogram of QRS complex.

EXSC 610
B-4a. Deep S wave: The occurrence of deep S wave in the leads V1 or the lead V2 is usually
suggestive of left ventricular hypertrophy (Dunbar & Saul, 2009). As the maximum electric
force of left ventricular hypertrophy moves towards left and posteriorly, presence of deep S
wave is observed. However, the interpretation of the hypertrophies in the congenital or the
acquired heart disease, presence of deep S wave might not be caused by left ventricular
hypertrophy, and may be due to either isolated else occurring along with the right ventricular
hypertrophy (Di et al., 2019).
⊘ This is a preview!⊘
Do you want full access?
Subscribe today to unlock all pages.

Trusted by 1+ million students worldwide

EXSC 610
References:
Berge, H. M., Gjesdal, K., Andersen, T. E., Solberg, E. E., & Steine, K. (2015). Prevalence of
abnormal ECGs in male soccer players decreases with the S eattle criteria, but is still
high. Scandinavian journal of medicine & science in sports, 25(4), 501-508.
Di, C., Ding, Y., Gao, P., Wang, Q., Wu, Y., & Lin, W. (2019). Irregular narrow QRS complex
tachycardia with intermittent P‐waves linked to two QRS complexes: What is the
mechanism?. Journal of Cardiovascular Electrophysiology.
Dunbar, C. C., & Saul, B. (2009). ECG interpretation for the clinical exercise physiologist.
Baltimore, MD: Lippincott Williams & Wilkins.
Elgendi, M., Meo, M., & Abbott, D. (2016). A proof-of-concept study: Simple and effective
detection of P and T waves in arrhythmic ECG signals. Bioengineering, 3(4), 26.
Gia, T. N., Jiang, M., Rahmani, A. M., Westerlund, T., Liljeberg, P., & Tenhunen, H. (2015,
October). Fog computing in healthcare internet of things: A case study on ecg feature
extraction. In 2015 IEEE International Conference on Computer and Information
Technology; Ubiquitous Computing and Communications; Dependable, Autonomic and
Secure Computing; Pervasive Intelligence and Computing (pp. 356-363). IEEE.
Wasfy, M. M., DeLuca, J., Wang, F., Berkstresser, B., Ackerman, K. E., Eisman, A., ... &
Baggish, A. L. (2015). ECG findings in competitive rowers: normative data and the
prevalence of abnormalities using contemporary screening recommendations. Br J Sports
Med, 49(3), 200-206.
Paraphrase This Document
Need a fresh take? Get an instant paraphrase of this document with our AI Paraphraser

EXSC 610
Yochum, M., Renaud, C., & Jacquir, S. (2016). Automatic detection of P, QRS and T patterns in
12 leads ECG signal based on CWT. Biomedical Signal Processing and Control, 25, 46-
52.
Yochum, M., Renaud, C., & Jacquir, S. (2016). Automatic detection of P, QRS and T patterns in
12 leads ECG signal based on CWT. Biomedical Signal Processing and Control, 25, 46-
52.
1 out of 8
Related Documents
Your All-in-One AI-Powered Toolkit for Academic Success.
+13062052269
info@desklib.com
Available 24*7 on WhatsApp / Email
Unlock your academic potential
Copyright © 2020–2025 A2Z Services. All Rights Reserved. Developed and managed by ZUCOL.


