Analyzing External Auditor Reliance on Internal Auditing Factors
VerifiedAdded on 2020/05/16
|49
|11052
|80
Report
AI Summary
This report examines the critical relationship between external and internal auditing, focusing on the reliance of external auditors on internal audit functions within Jordan. The study investigates the influence of three key factors: performance, competency, and objectivity, using descriptive statistics, correlation analysis, reliability analysis, and regression/ANOVA tables to analyze the data. The findings reveal strong positive correlations between internal auditor performance and external auditor factors such as nature, timing, and extent of work, suggesting a significant level of reliance. Specifically, the objectivity of internal auditors plays a crucial role in shaping the nature, timing, and scope of external audits. The report concludes with implications for practice and recommendations for enhancing the effectiveness of audit processes. This report provides a comprehensive analysis of the interplay between internal and external auditing in Jordan, highlighting the importance of internal audit functions in supporting and influencing the work of external auditors, and providing a valuable resource for students and professionals in the field of finance.
Running head: RELIANCE OF EXTERNAL AUDITING ON INTERNAL AUDITING
RELIANCE OF EXTERNAL AUDITING ON INTERNAL AUDITING
Name of the Student
Name of the University
Author Note
RELIANCE OF EXTERNAL AUDITING ON INTERNAL AUDITING
Name of the Student
Name of the University
Author Note
Paraphrase This Document
Need a fresh take? Get an instant paraphrase of this document with our AI Paraphraser
1RELIANCE OF EXTERNAL AUDITING ON INTERNAL AUDITING
Table of Contents
CHAPTER FOUR: RESULTS........................................................................................................2
Purpose of the study.....................................................................................................................2
Interpretation of the Descriptive Statistics Table........................................................................2
Interpretation of the Correlations Tables.....................................................................................4
Interpretation of the Reliability Analysis Tables.........................................................................5
Interpretation of the Regression and ANOVA Table..................................................................8
Summary....................................................................................................................................12
CHAPTER FIVE: DISCUSSION, CONCLUSIONS AND RECOMMENDATIONS................13
Discussion..................................................................................................................................13
Conclusion.................................................................................................................................15
Implications for practice............................................................................................................17
Recommendations......................................................................................................................17
References......................................................................................................................................18
Appendices....................................................................................................................................23
2RELIANCE OF EXTERNAL AUDITING ON INTERNAL AUDITING
CHAPTER FOUR: RESULTS
Purpose of the study
Purpose of the study was to explore and comprehend the influence of reliance by external
auditors on internal audits in Jordan. Three major factors were considered while conducting the
research, viz. Performance, Competency and Objectivity (Mekler et al. 2017). In-depth analysis
regarding the connection between the external and internal audit sectors within Jordan.
Hypotheses were constructed in relevance to determining the effect of the aforementioned three
factors. Reliability analysis has also been carried out to find the internal consistency between the
responses.
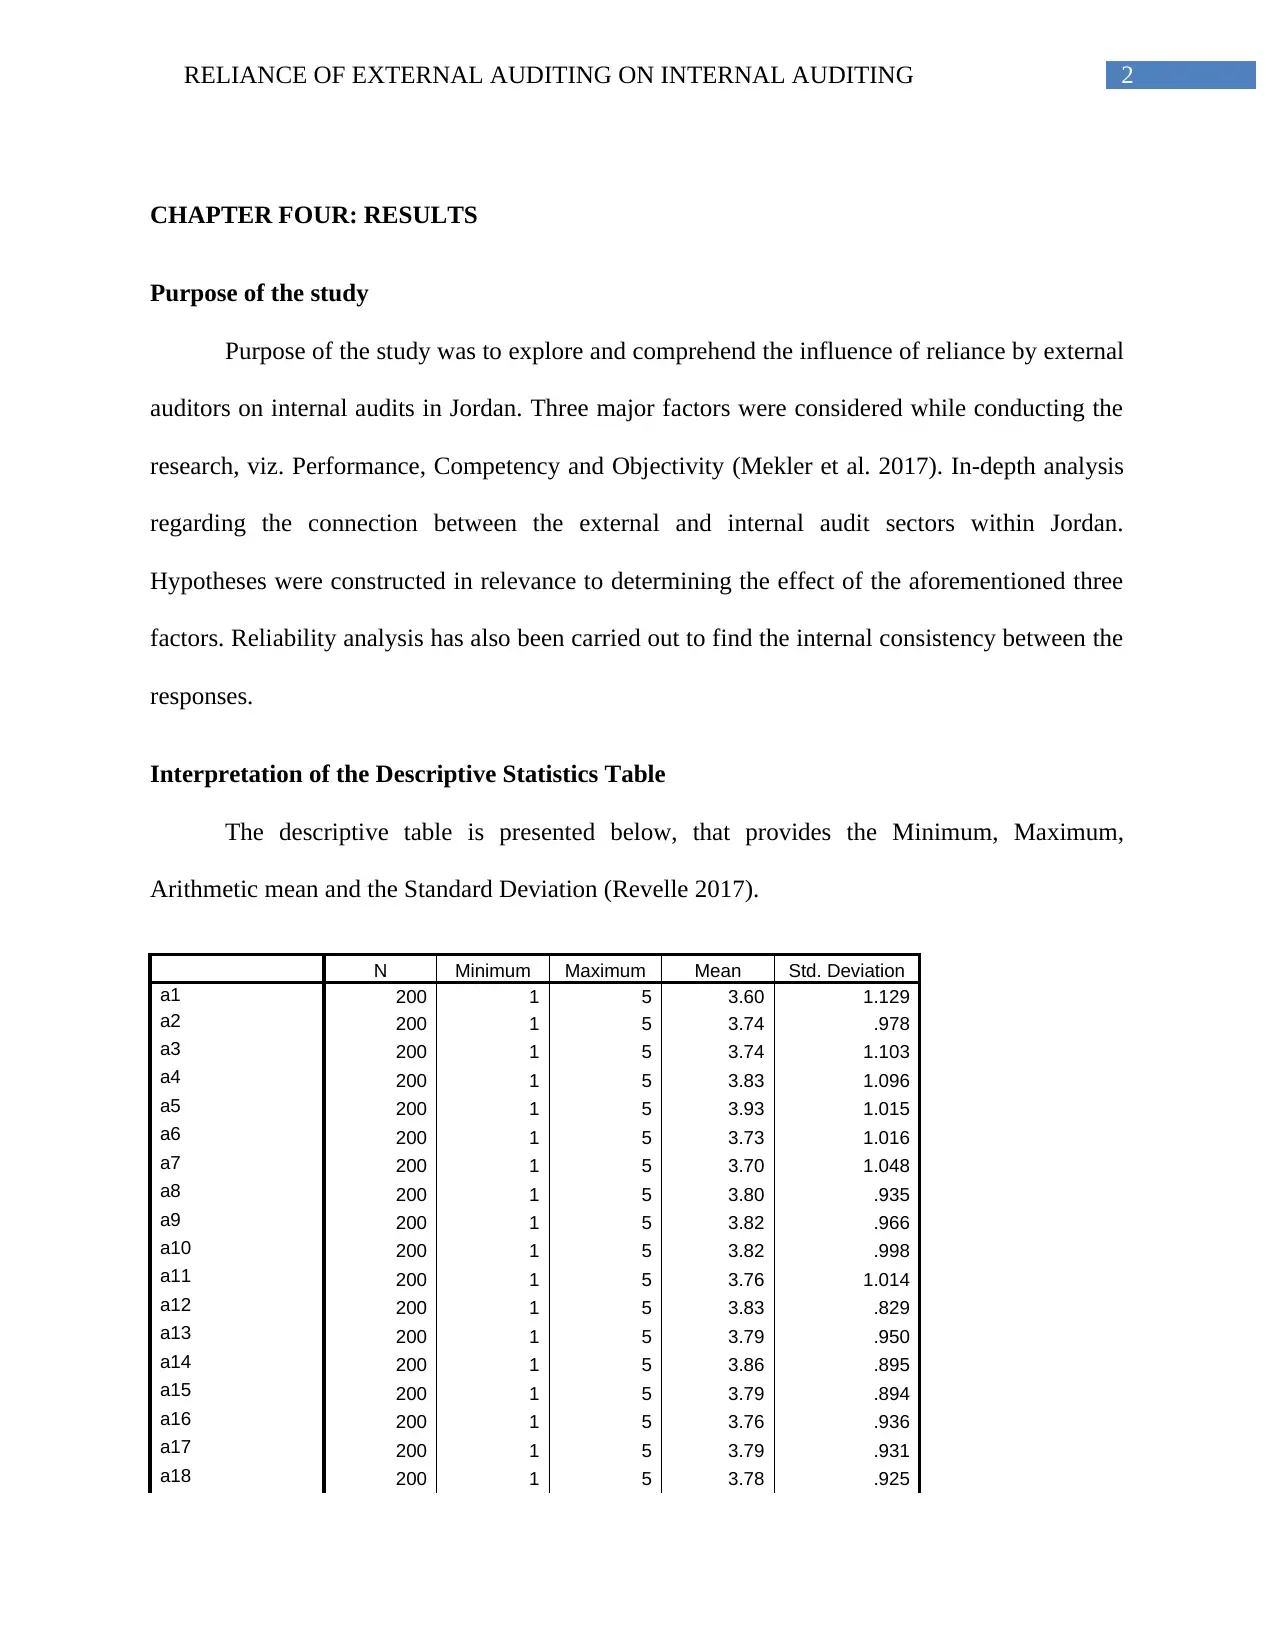
Interpretation of the Descriptive Statistics Table
The descriptive table is presented below, that provides the Minimum, Maximum,
Arithmetic mean and the Standard Deviation (Revelle 2017).
N Minimum Maximum Mean Std. Deviation
a1 200 1 5 3.60 1.129
a2 200 1 5 3.74 .978
a3 200 1 5 3.74 1.103
a4 200 1 5 3.83 1.096
a5 200 1 5 3.93 1.015
a6 200 1 5 3.73 1.016
a7 200 1 5 3.70 1.048
a8 200 1 5 3.80 .935
a9 200 1 5 3.82 .966
a10 200 1 5 3.82 .998
a11 200 1 5 3.76 1.014
a12 200 1 5 3.83 .829
a13 200 1 5 3.79 .950
a14 200 1 5 3.86 .895
a15 200 1 5 3.79 .894
a16 200 1 5 3.76 .936
a17 200 1 5 3.79 .931
a18 200 1 5 3.78 .925
CHAPTER FOUR: RESULTS
Purpose of the study
Purpose of the study was to explore and comprehend the influence of reliance by external
auditors on internal audits in Jordan. Three major factors were considered while conducting the
research, viz. Performance, Competency and Objectivity (Mekler et al. 2017). In-depth analysis
regarding the connection between the external and internal audit sectors within Jordan.
Hypotheses were constructed in relevance to determining the effect of the aforementioned three
factors. Reliability analysis has also been carried out to find the internal consistency between the
responses.
Interpretation of the Descriptive Statistics Table
The descriptive table is presented below, that provides the Minimum, Maximum,
Arithmetic mean and the Standard Deviation (Revelle 2017).
N Minimum Maximum Mean Std. Deviation
a1 200 1 5 3.60 1.129
a2 200 1 5 3.74 .978
a3 200 1 5 3.74 1.103
a4 200 1 5 3.83 1.096
a5 200 1 5 3.93 1.015
a6 200 1 5 3.73 1.016
a7 200 1 5 3.70 1.048
a8 200 1 5 3.80 .935
a9 200 1 5 3.82 .966
a10 200 1 5 3.82 .998
a11 200 1 5 3.76 1.014
a12 200 1 5 3.83 .829
a13 200 1 5 3.79 .950
a14 200 1 5 3.86 .895
a15 200 1 5 3.79 .894
a16 200 1 5 3.76 .936
a17 200 1 5 3.79 .931
a18 200 1 5 3.78 .925
⊘ This is a preview!⊘
Do you want full access?
Subscribe today to unlock all pages.
Trusted by 1+ million students worldwide
3RELIANCE OF EXTERNAL AUDITING ON INTERNAL AUDITING
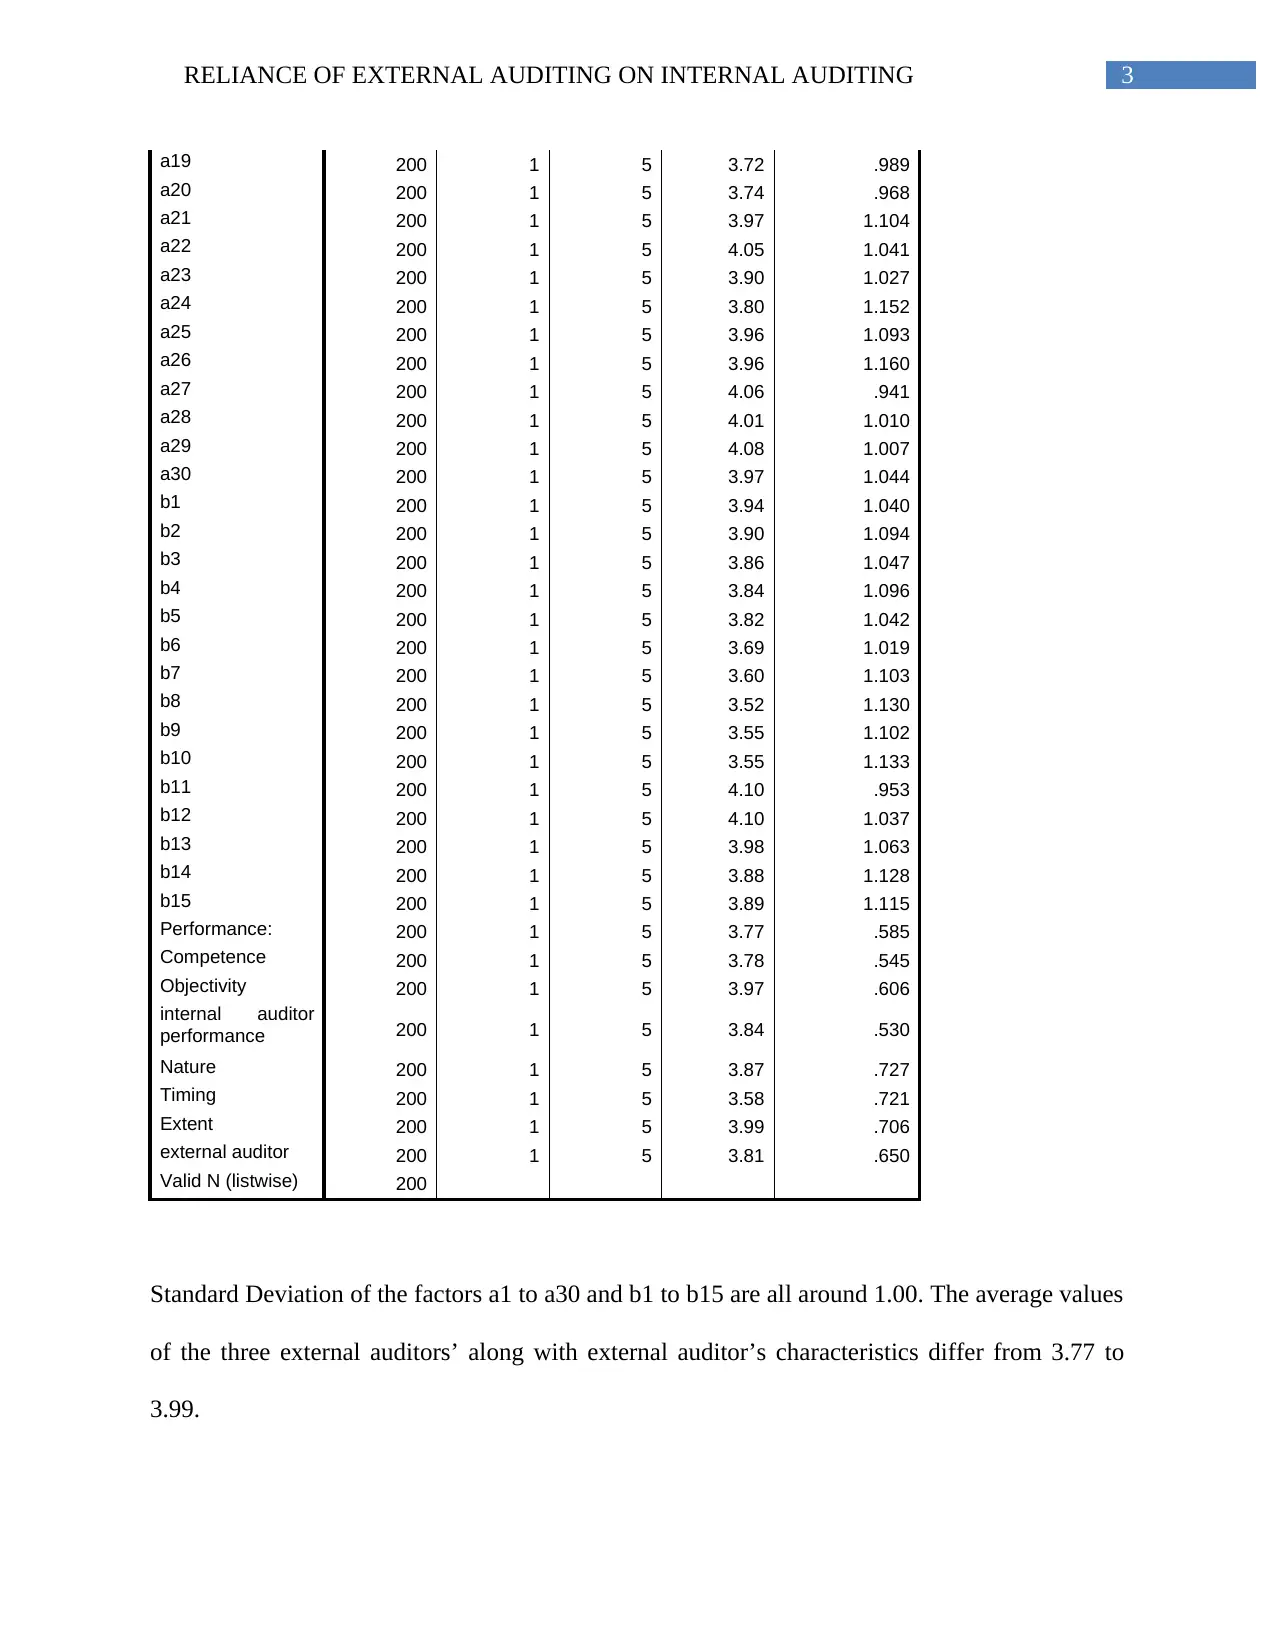
a19 200 1 5 3.72 .989
a20 200 1 5 3.74 .968
a21 200 1 5 3.97 1.104
a22 200 1 5 4.05 1.041
a23 200 1 5 3.90 1.027
a24 200 1 5 3.80 1.152
a25 200 1 5 3.96 1.093
a26 200 1 5 3.96 1.160
a27 200 1 5 4.06 .941
a28 200 1 5 4.01 1.010
a29 200 1 5 4.08 1.007
a30 200 1 5 3.97 1.044
b1 200 1 5 3.94 1.040
b2 200 1 5 3.90 1.094
b3 200 1 5 3.86 1.047
b4 200 1 5 3.84 1.096
b5 200 1 5 3.82 1.042
b6 200 1 5 3.69 1.019
b7 200 1 5 3.60 1.103
b8 200 1 5 3.52 1.130
b9 200 1 5 3.55 1.102
b10 200 1 5 3.55 1.133
b11 200 1 5 4.10 .953
b12 200 1 5 4.10 1.037
b13 200 1 5 3.98 1.063
b14 200 1 5 3.88 1.128
b15 200 1 5 3.89 1.115
Performance: 200 1 5 3.77 .585
Competence 200 1 5 3.78 .545
Objectivity 200 1 5 3.97 .606
internal auditor
performance 200 1 5 3.84 .530
Nature 200 1 5 3.87 .727
Timing 200 1 5 3.58 .721
Extent 200 1 5 3.99 .706
external auditor 200 1 5 3.81 .650
Valid N (listwise) 200
Standard Deviation of the factors a1 to a30 and b1 to b15 are all around 1.00. The average values
of the three external auditors’ along with external auditor’s characteristics differ from 3.77 to
3.99.
Paraphrase This Document
Need a fresh take? Get an instant paraphrase of this document with our AI Paraphraser
4RELIANCE OF EXTERNAL AUDITING ON INTERNAL AUDITING
Interpretation of the Correlations Tables
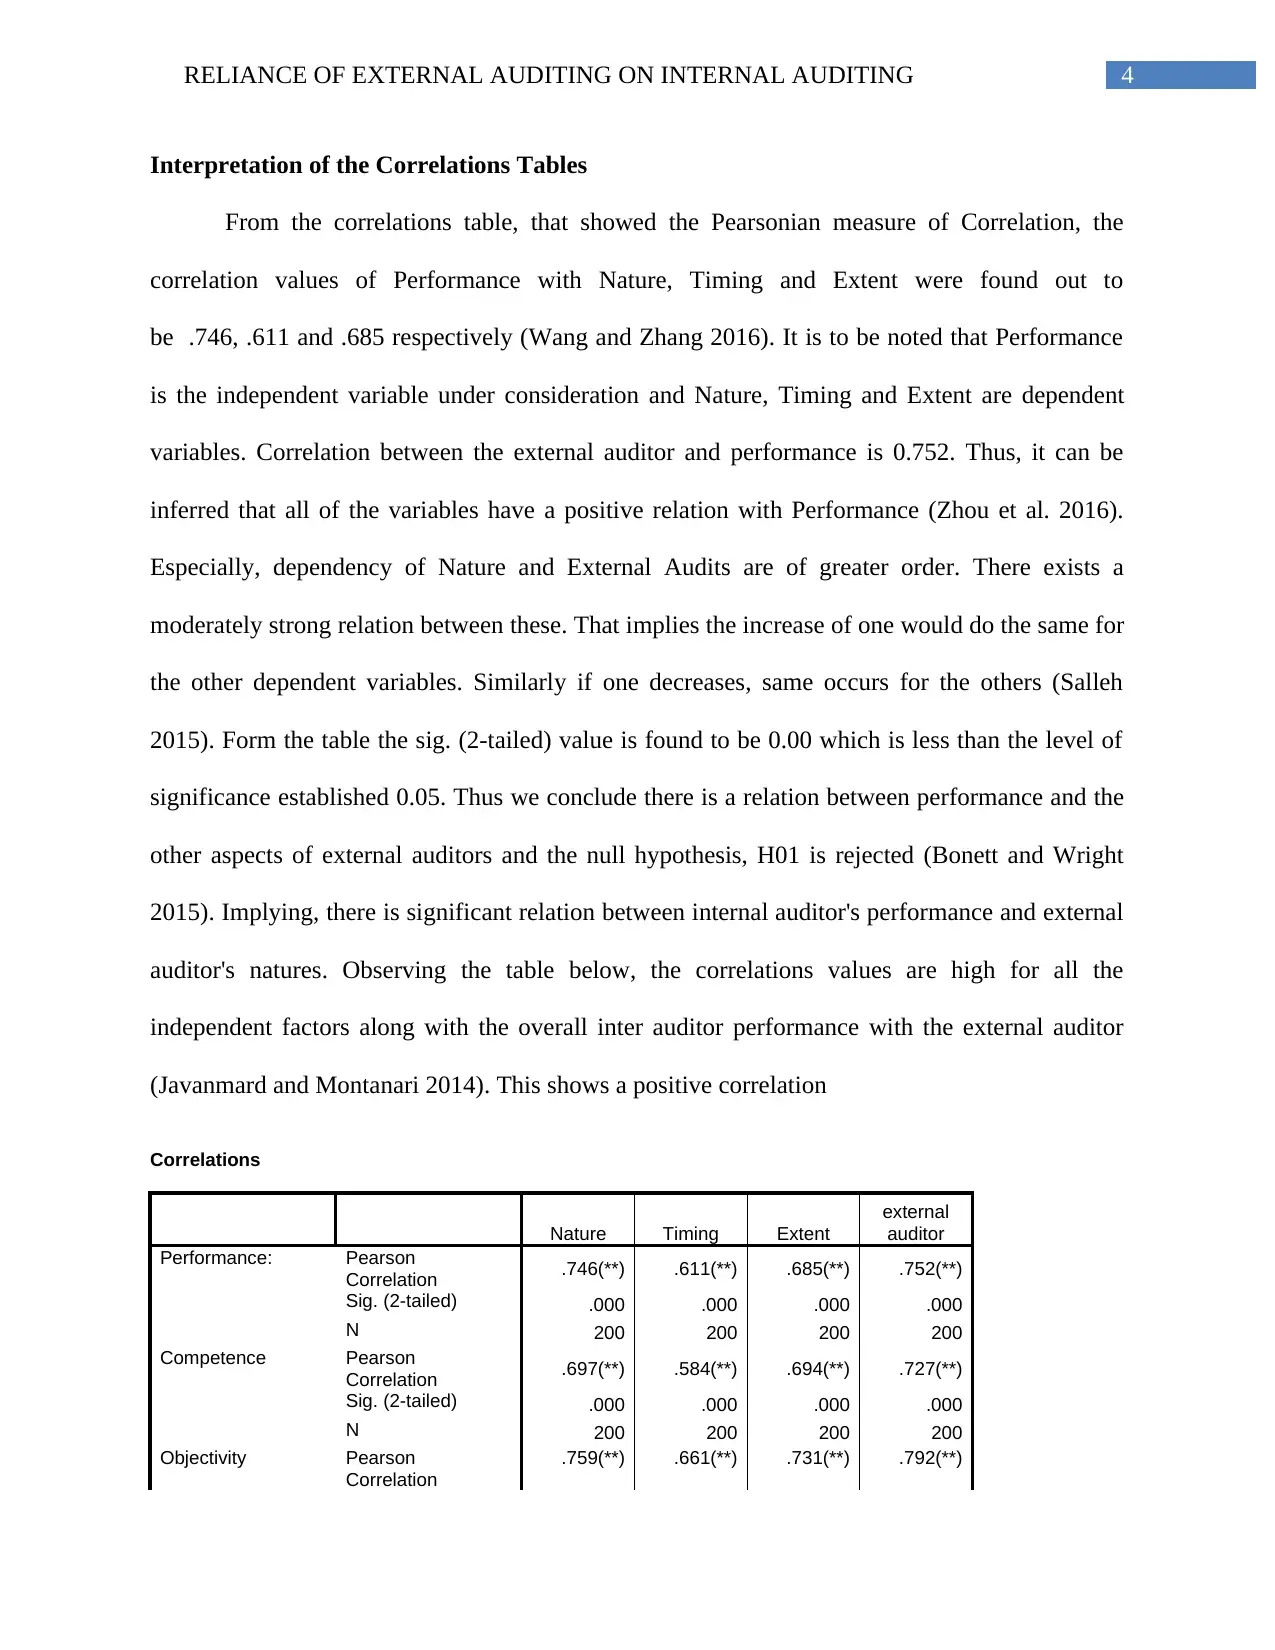
From the correlations table, that showed the Pearsonian measure of Correlation, the
correlation values of Performance with Nature, Timing and Extent were found out to
be .746, .611 and .685 respectively (Wang and Zhang 2016). It is to be noted that Performance
is the independent variable under consideration and Nature, Timing and Extent are dependent
variables. Correlation between the external auditor and performance is 0.752. Thus, it can be
inferred that all of the variables have a positive relation with Performance (Zhou et al. 2016).
Especially, dependency of Nature and External Audits are of greater order. There exists a
moderately strong relation between these. That implies the increase of one would do the same for
the other dependent variables. Similarly if one decreases, same occurs for the others (Salleh
2015). Form the table the sig. (2-tailed) value is found to be 0.00 which is less than the level of
significance established 0.05. Thus we conclude there is a relation between performance and the
other aspects of external auditors and the null hypothesis, H01 is rejected (Bonett and Wright
2015). Implying, there is significant relation between internal auditor's performance and external
auditor's natures. Observing the table below, the correlations values are high for all the
independent factors along with the overall inter auditor performance with the external auditor
(Javanmard and Montanari 2014). This shows a positive correlation
Correlations
Nature Timing Extent
external
auditor
Performance: Pearson
Correlation .746(**) .611(**) .685(**) .752(**)
Sig. (2-tailed) .000 .000 .000 .000
N 200 200 200 200
Competence Pearson
Correlation .697(**) .584(**) .694(**) .727(**)
Sig. (2-tailed) .000 .000 .000 .000
N 200 200 200 200
Objectivity Pearson
Correlation
.759(**) .661(**) .731(**) .792(**)
Interpretation of the Correlations Tables
From the correlations table, that showed the Pearsonian measure of Correlation, the
correlation values of Performance with Nature, Timing and Extent were found out to
be .746, .611 and .685 respectively (Wang and Zhang 2016). It is to be noted that Performance
is the independent variable under consideration and Nature, Timing and Extent are dependent
variables. Correlation between the external auditor and performance is 0.752. Thus, it can be
inferred that all of the variables have a positive relation with Performance (Zhou et al. 2016).
Especially, dependency of Nature and External Audits are of greater order. There exists a
moderately strong relation between these. That implies the increase of one would do the same for
the other dependent variables. Similarly if one decreases, same occurs for the others (Salleh
2015). Form the table the sig. (2-tailed) value is found to be 0.00 which is less than the level of
significance established 0.05. Thus we conclude there is a relation between performance and the
other aspects of external auditors and the null hypothesis, H01 is rejected (Bonett and Wright
2015). Implying, there is significant relation between internal auditor's performance and external
auditor's natures. Observing the table below, the correlations values are high for all the
independent factors along with the overall inter auditor performance with the external auditor
(Javanmard and Montanari 2014). This shows a positive correlation
Correlations
Nature Timing Extent
external
auditor
Performance: Pearson
Correlation .746(**) .611(**) .685(**) .752(**)
Sig. (2-tailed) .000 .000 .000 .000
N 200 200 200 200
Competence Pearson
Correlation .697(**) .584(**) .694(**) .727(**)
Sig. (2-tailed) .000 .000 .000 .000
N 200 200 200 200
Objectivity Pearson
Correlation
.759(**) .661(**) .731(**) .792(**)
5RELIANCE OF EXTERNAL AUDITING ON INTERNAL AUDITING
Sig. (2-tailed) .000 .000 .000 .000
N 200 200 200 200
internal auditor
performance
Pearson
Correlation .803(**) .677(**) .768(**) .828(**)
Sig. (2-tailed) .000 .000 .000 .000
N 200 200 200 200
** Correlation is significant at the 0.01 level (2-tailed).
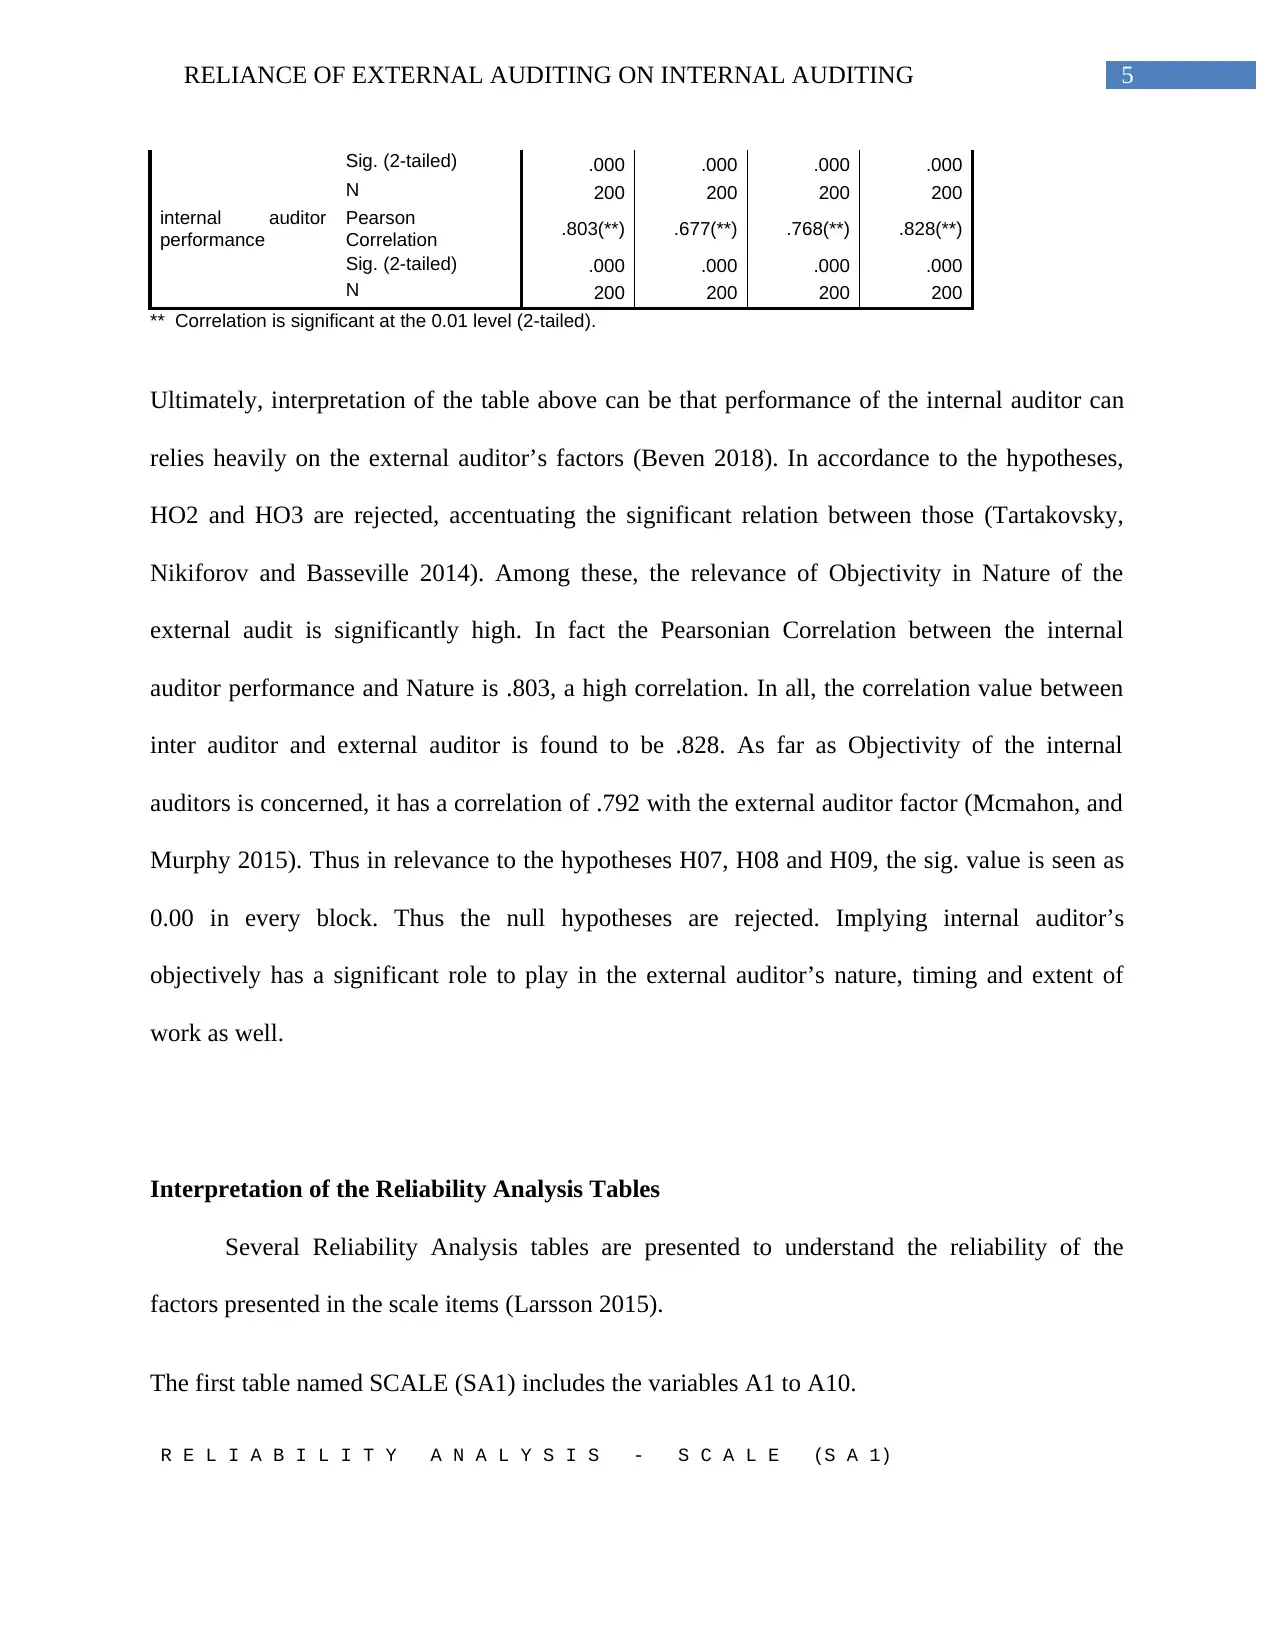
Ultimately, interpretation of the table above can be that performance of the internal auditor can
relies heavily on the external auditor’s factors (Beven 2018). In accordance to the hypotheses,
HO2 and HO3 are rejected, accentuating the significant relation between those (Tartakovsky,
Nikiforov and Basseville 2014). Among these, the relevance of Objectivity in Nature of the
external audit is significantly high. In fact the Pearsonian Correlation between the internal
auditor performance and Nature is .803, a high correlation. In all, the correlation value between
inter auditor and external auditor is found to be .828. As far as Objectivity of the internal
auditors is concerned, it has a correlation of .792 with the external auditor factor (Mcmahon, and
Murphy 2015). Thus in relevance to the hypotheses H07, H08 and H09, the sig. value is seen as
0.00 in every block. Thus the null hypotheses are rejected. Implying internal auditor’s
objectively has a significant role to play in the external auditor’s nature, timing and extent of
work as well.
Interpretation of the Reliability Analysis Tables
Several Reliability Analysis tables are presented to understand the reliability of the
factors presented in the scale items (Larsson 2015).
The first table named SCALE (SA1) includes the variables A1 to A10.
R E L I A B I L I T Y A N A L Y S I S - S C A L E (S A 1)
Sig. (2-tailed) .000 .000 .000 .000
N 200 200 200 200
internal auditor
performance
Pearson
Correlation .803(**) .677(**) .768(**) .828(**)
Sig. (2-tailed) .000 .000 .000 .000
N 200 200 200 200
** Correlation is significant at the 0.01 level (2-tailed).
Ultimately, interpretation of the table above can be that performance of the internal auditor can
relies heavily on the external auditor’s factors (Beven 2018). In accordance to the hypotheses,
HO2 and HO3 are rejected, accentuating the significant relation between those (Tartakovsky,
Nikiforov and Basseville 2014). Among these, the relevance of Objectivity in Nature of the
external audit is significantly high. In fact the Pearsonian Correlation between the internal
auditor performance and Nature is .803, a high correlation. In all, the correlation value between
inter auditor and external auditor is found to be .828. As far as Objectivity of the internal
auditors is concerned, it has a correlation of .792 with the external auditor factor (Mcmahon, and
Murphy 2015). Thus in relevance to the hypotheses H07, H08 and H09, the sig. value is seen as
0.00 in every block. Thus the null hypotheses are rejected. Implying internal auditor’s
objectively has a significant role to play in the external auditor’s nature, timing and extent of
work as well.
Interpretation of the Reliability Analysis Tables
Several Reliability Analysis tables are presented to understand the reliability of the
factors presented in the scale items (Larsson 2015).
The first table named SCALE (SA1) includes the variables A1 to A10.
R E L I A B I L I T Y A N A L Y S I S - S C A L E (S A 1)
⊘ This is a preview!⊘
Do you want full access?
Subscribe today to unlock all pages.
Trusted by 1+ million students worldwide
6RELIANCE OF EXTERNAL AUDITING ON INTERNAL AUDITING
N of Cases = 200.0
Item Means Mean Minimum Maximum Range Max/Min Variance
3.7705 3.6050 3.9300 .3250 1.0902 .0078
Item Variances Mean Minimum Maximum Range Max/Min Variance
1.0611 .8744 1.2754 .4010 1.4586 .0177
Inter-item
Covariances Mean Minimum Maximum Range Max/Min Variance
.2621 .0844 .5330 .4486 6.3140 .0069
Inter-item
Correlations Mean Minimum Maximum Range Max/Min Variance
.2477 .0931 .4412 .3481 4.7412 .0056
Item-total Statistics
Scale Scale Corrected
Mean Variance Item- Squared Alpha
if Item if Item Total Multiple if Item
Deleted Deleted Correlation Correlation Deleted
A1 34.1000 28.2814 .3865 .1860 .7536
A2 33.9650 29.1596 .3863 .1953 .7525
A3 33.9600 26.9029 .5315 .3286 .7321
A4 33.8800 28.0760 .4240 .2465 .7479
A5 33.7750 28.3562 .4452 .2403 .7449
A6 33.9750 28.5974 .4205 .2513 .7482
A7 34.0100 28.6532 .3966 .2149 .7515
A8 33.9050 29.0010 .4293 .2606 .7473
A9 33.8850 28.6450 .4472 .2961 .7449
A10 33.8900 28.5306 .4383 .2546 .7458
Reliability Coefficients 10 items
Alpha = .7664 Standardized item alpha = .7670
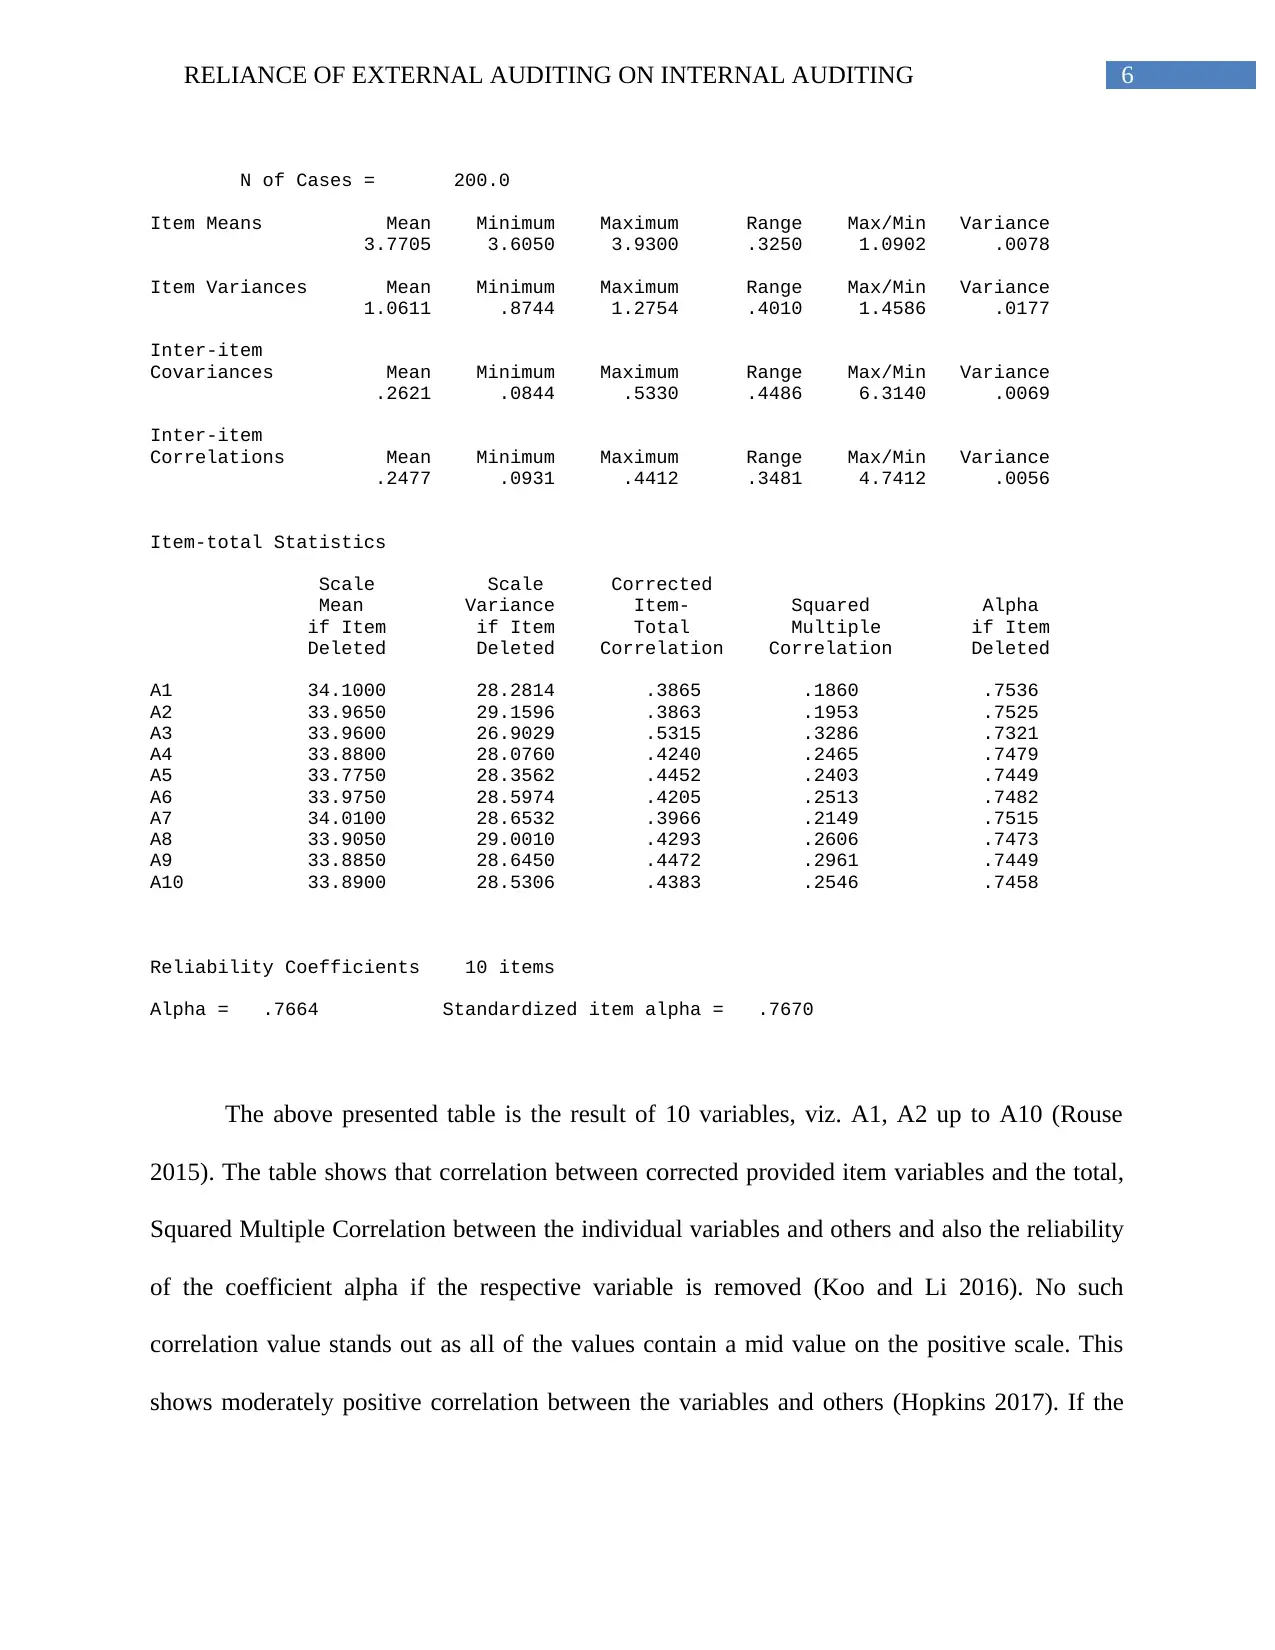
The above presented table is the result of 10 variables, viz. A1, A2 up to A10 (Rouse
2015). The table shows that correlation between corrected provided item variables and the total,
Squared Multiple Correlation between the individual variables and others and also the reliability
of the coefficient alpha if the respective variable is removed (Koo and Li 2016). No such
correlation value stands out as all of the values contain a mid value on the positive scale. This
shows moderately positive correlation between the variables and others (Hopkins 2017). If the
N of Cases = 200.0
Item Means Mean Minimum Maximum Range Max/Min Variance
3.7705 3.6050 3.9300 .3250 1.0902 .0078
Item Variances Mean Minimum Maximum Range Max/Min Variance
1.0611 .8744 1.2754 .4010 1.4586 .0177
Inter-item
Covariances Mean Minimum Maximum Range Max/Min Variance
.2621 .0844 .5330 .4486 6.3140 .0069
Inter-item
Correlations Mean Minimum Maximum Range Max/Min Variance
.2477 .0931 .4412 .3481 4.7412 .0056
Item-total Statistics
Scale Scale Corrected
Mean Variance Item- Squared Alpha
if Item if Item Total Multiple if Item
Deleted Deleted Correlation Correlation Deleted
A1 34.1000 28.2814 .3865 .1860 .7536
A2 33.9650 29.1596 .3863 .1953 .7525
A3 33.9600 26.9029 .5315 .3286 .7321
A4 33.8800 28.0760 .4240 .2465 .7479
A5 33.7750 28.3562 .4452 .2403 .7449
A6 33.9750 28.5974 .4205 .2513 .7482
A7 34.0100 28.6532 .3966 .2149 .7515
A8 33.9050 29.0010 .4293 .2606 .7473
A9 33.8850 28.6450 .4472 .2961 .7449
A10 33.8900 28.5306 .4383 .2546 .7458
Reliability Coefficients 10 items
Alpha = .7664 Standardized item alpha = .7670
The above presented table is the result of 10 variables, viz. A1, A2 up to A10 (Rouse
2015). The table shows that correlation between corrected provided item variables and the total,
Squared Multiple Correlation between the individual variables and others and also the reliability
of the coefficient alpha if the respective variable is removed (Koo and Li 2016). No such
correlation value stands out as all of the values contain a mid value on the positive scale. This
shows moderately positive correlation between the variables and others (Hopkins 2017). If the
Paraphrase This Document
Need a fresh take? Get an instant paraphrase of this document with our AI Paraphraser
7RELIANCE OF EXTERNAL AUDITING ON INTERNAL AUDITING
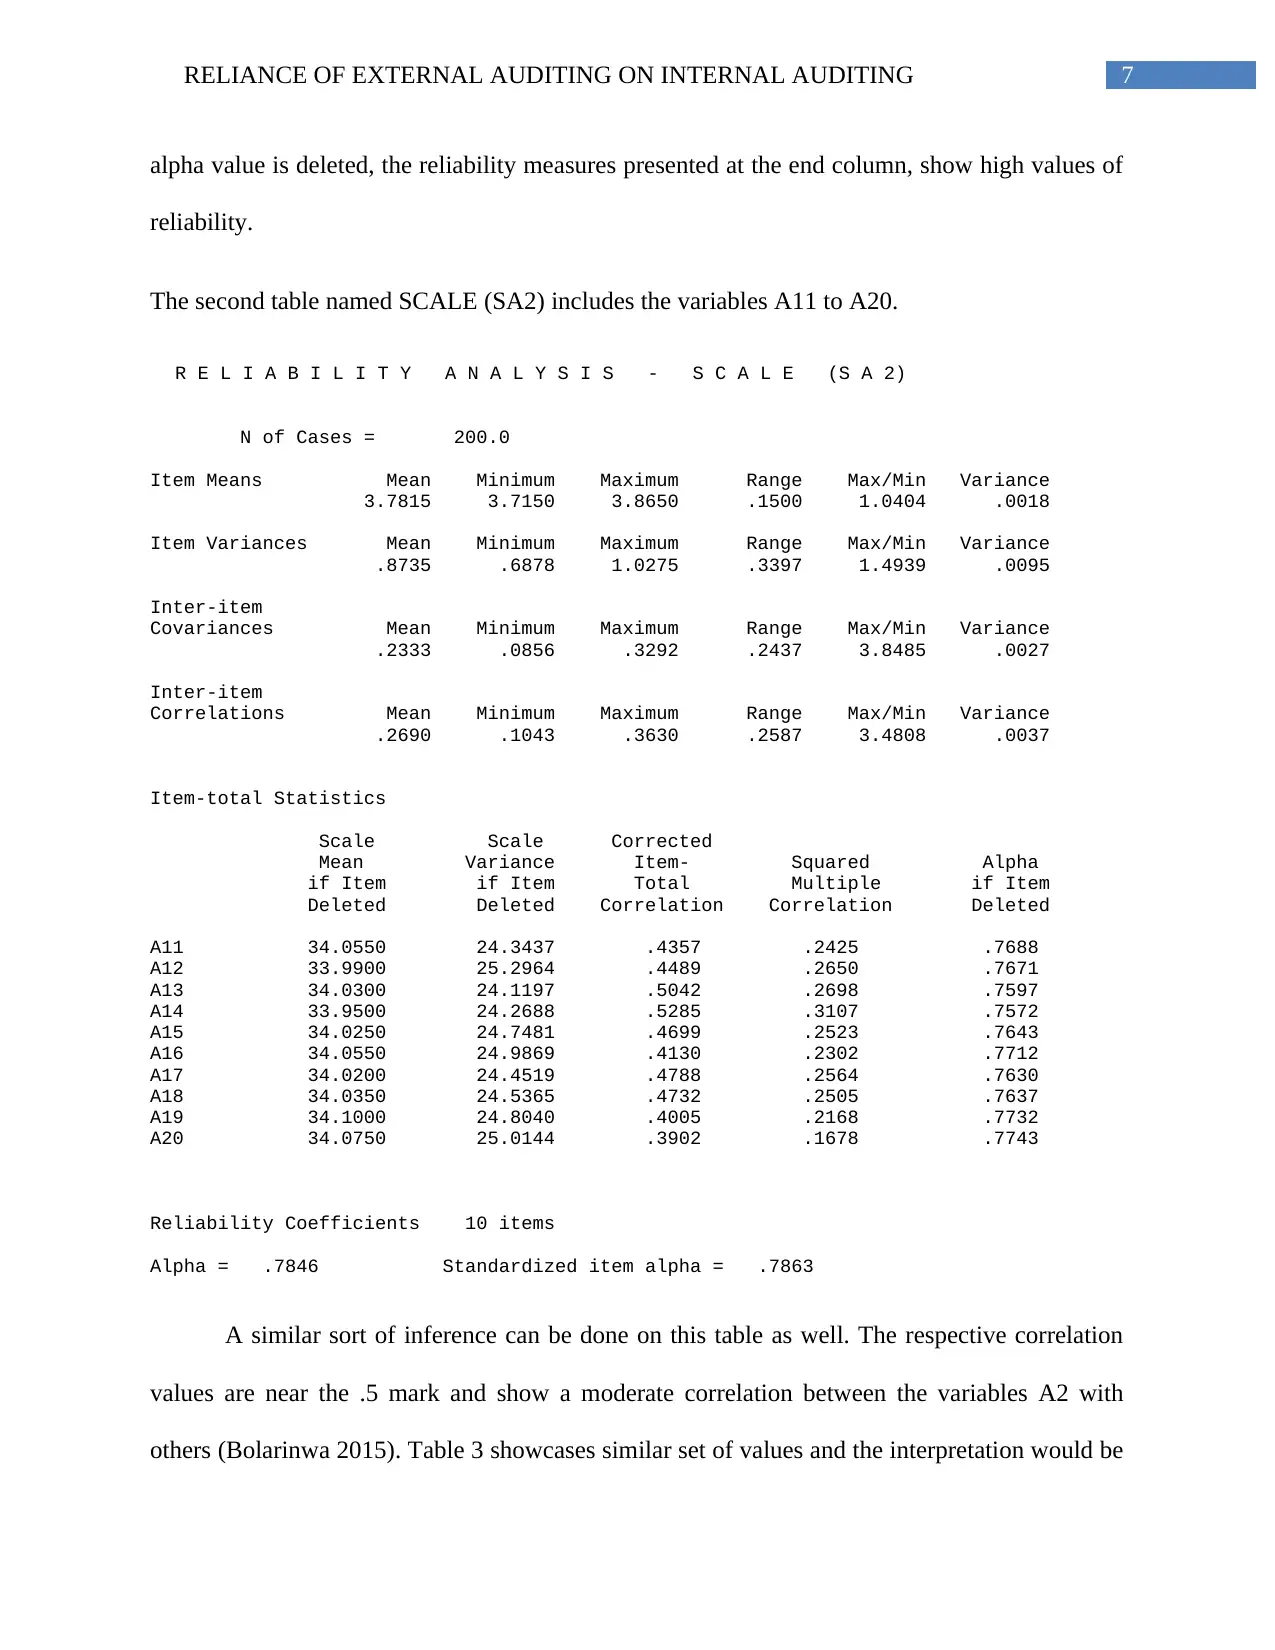
alpha value is deleted, the reliability measures presented at the end column, show high values of
reliability.
The second table named SCALE (SA2) includes the variables A11 to A20.
R E L I A B I L I T Y A N A L Y S I S - S C A L E (S A 2)
N of Cases = 200.0
Item Means Mean Minimum Maximum Range Max/Min Variance
3.7815 3.7150 3.8650 .1500 1.0404 .0018
Item Variances Mean Minimum Maximum Range Max/Min Variance
.8735 .6878 1.0275 .3397 1.4939 .0095
Inter-item
Covariances Mean Minimum Maximum Range Max/Min Variance
.2333 .0856 .3292 .2437 3.8485 .0027
Inter-item
Correlations Mean Minimum Maximum Range Max/Min Variance
.2690 .1043 .3630 .2587 3.4808 .0037
Item-total Statistics
Scale Scale Corrected
Mean Variance Item- Squared Alpha
if Item if Item Total Multiple if Item
Deleted Deleted Correlation Correlation Deleted
A11 34.0550 24.3437 .4357 .2425 .7688
A12 33.9900 25.2964 .4489 .2650 .7671
A13 34.0300 24.1197 .5042 .2698 .7597
A14 33.9500 24.2688 .5285 .3107 .7572
A15 34.0250 24.7481 .4699 .2523 .7643
A16 34.0550 24.9869 .4130 .2302 .7712
A17 34.0200 24.4519 .4788 .2564 .7630
A18 34.0350 24.5365 .4732 .2505 .7637
A19 34.1000 24.8040 .4005 .2168 .7732
A20 34.0750 25.0144 .3902 .1678 .7743
Reliability Coefficients 10 items
Alpha = .7846 Standardized item alpha = .7863
A similar sort of inference can be done on this table as well. The respective correlation
values are near the .5 mark and show a moderate correlation between the variables A2 with
others (Bolarinwa 2015). Table 3 showcases similar set of values and the interpretation would be
8RELIANCE OF EXTERNAL AUDITING ON INTERNAL AUDITING
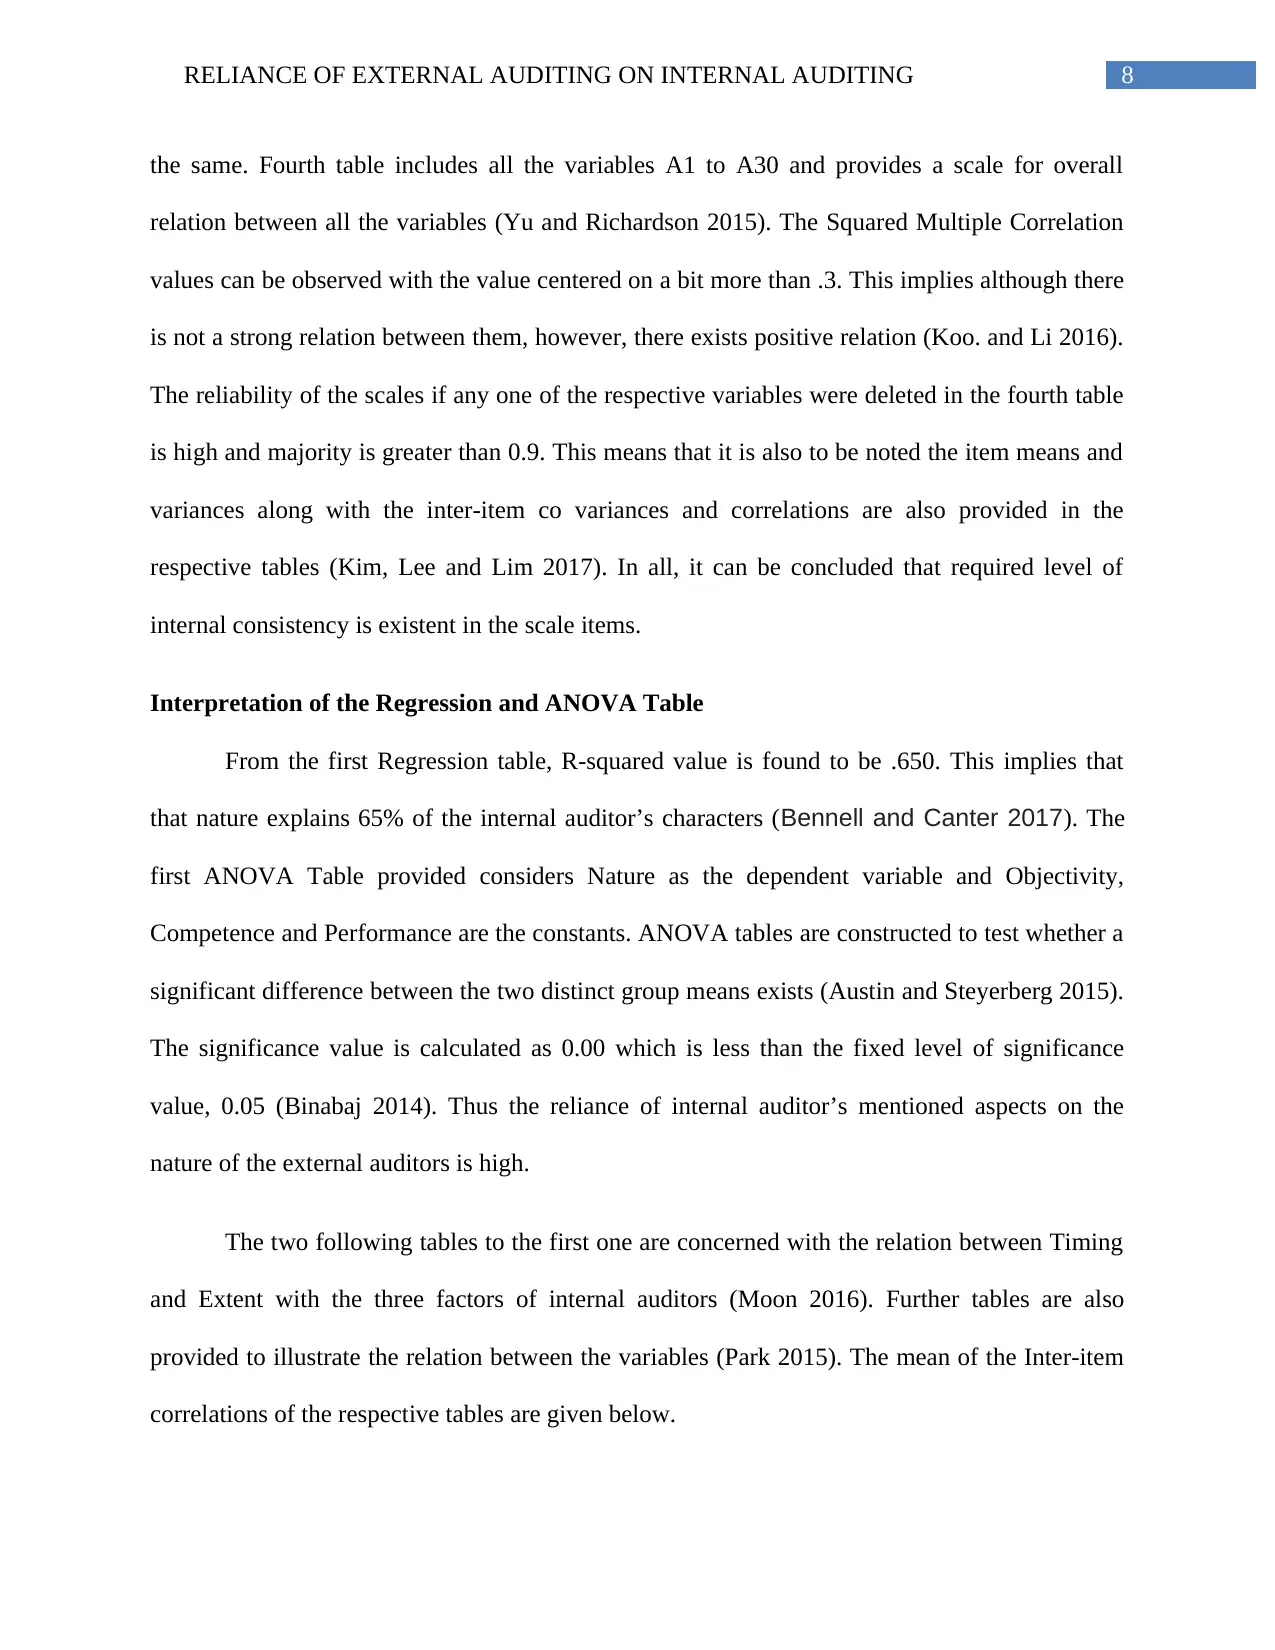
the same. Fourth table includes all the variables A1 to A30 and provides a scale for overall
relation between all the variables (Yu and Richardson 2015). The Squared Multiple Correlation
values can be observed with the value centered on a bit more than .3. This implies although there
is not a strong relation between them, however, there exists positive relation (Koo. and Li 2016).
The reliability of the scales if any one of the respective variables were deleted in the fourth table
is high and majority is greater than 0.9. This means that it is also to be noted the item means and
variances along with the inter-item co variances and correlations are also provided in the
respective tables (Kim, Lee and Lim 2017). In all, it can be concluded that required level of
internal consistency is existent in the scale items.
Interpretation of the Regression and ANOVA Table
From the first Regression table, R-squared value is found to be .650. This implies that
that nature explains 65% of the internal auditor’s characters (Bennell and Canter 2017). The
first ANOVA Table provided considers Nature as the dependent variable and Objectivity,
Competence and Performance are the constants. ANOVA tables are constructed to test whether a
significant difference between the two distinct group means exists (Austin and Steyerberg 2015).
The significance value is calculated as 0.00 which is less than the fixed level of significance
value, 0.05 (Binabaj 2014). Thus the reliance of internal auditor’s mentioned aspects on the
nature of the external auditors is high.
The two following tables to the first one are concerned with the relation between Timing
and Extent with the three factors of internal auditors (Moon 2016). Further tables are also
provided to illustrate the relation between the variables (Park 2015). The mean of the Inter-item
correlations of the respective tables are given below.
⊘ This is a preview!⊘
Do you want full access?
Subscribe today to unlock all pages.
Trusted by 1+ million students worldwide
9RELIANCE OF EXTERNAL AUDITING ON INTERNAL AUDITING
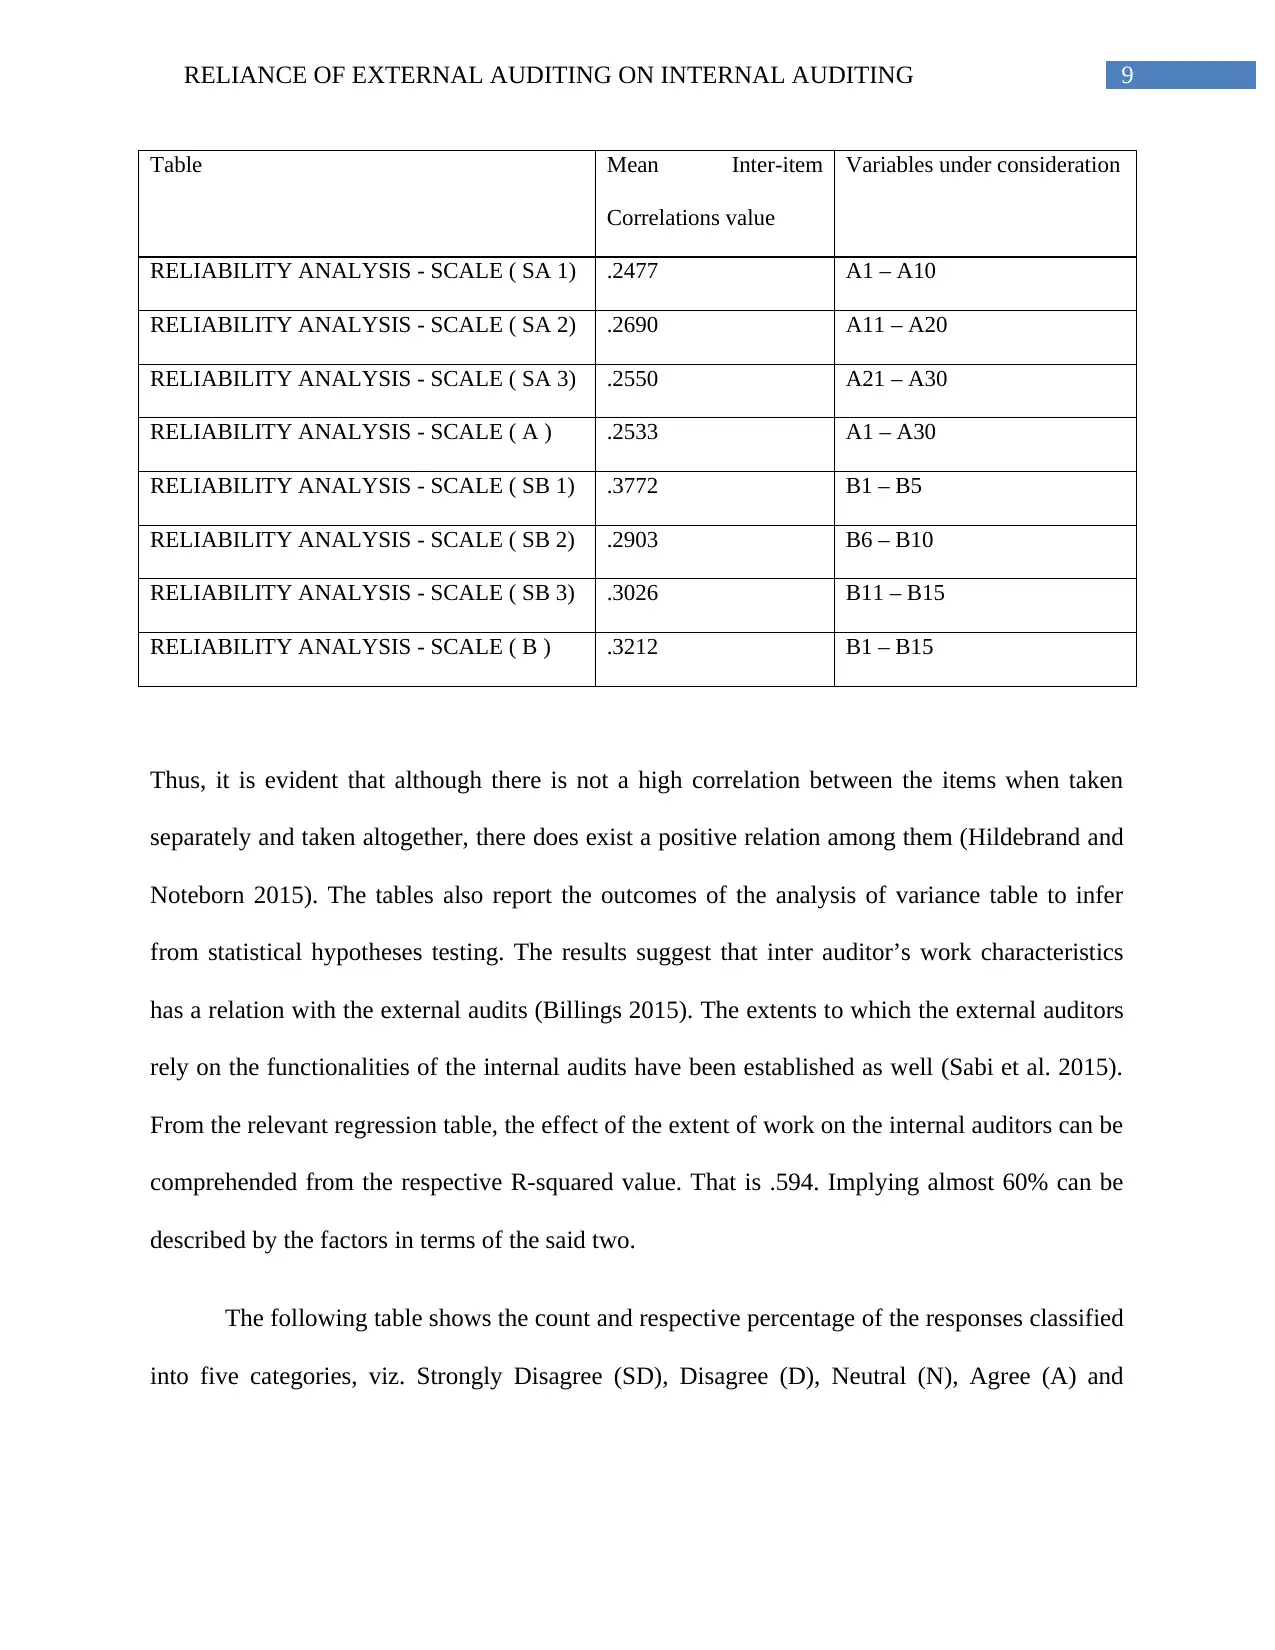
Table Mean Inter-item
Correlations value
Variables under consideration
RELIABILITY ANALYSIS - SCALE ( SA 1) .2477 A1 – A10
RELIABILITY ANALYSIS - SCALE ( SA 2) .2690 A11 – A20
RELIABILITY ANALYSIS - SCALE ( SA 3) .2550 A21 – A30
RELIABILITY ANALYSIS - SCALE ( A ) .2533 A1 – A30
RELIABILITY ANALYSIS - SCALE ( SB 1) .3772 B1 – B5
RELIABILITY ANALYSIS - SCALE ( SB 2) .2903 B6 – B10
RELIABILITY ANALYSIS - SCALE ( SB 3) .3026 B11 – B15
RELIABILITY ANALYSIS - SCALE ( B ) .3212 B1 – B15
Thus, it is evident that although there is not a high correlation between the items when taken
separately and taken altogether, there does exist a positive relation among them (Hildebrand and
Noteborn 2015). The tables also report the outcomes of the analysis of variance table to infer
from statistical hypotheses testing. The results suggest that inter auditor’s work characteristics
has a relation with the external audits (Billings 2015). The extents to which the external auditors
rely on the functionalities of the internal audits have been established as well (Sabi et al. 2015).
From the relevant regression table, the effect of the extent of work on the internal auditors can be
comprehended from the respective R-squared value. That is .594. Implying almost 60% can be
described by the factors in terms of the said two.
The following table shows the count and respective percentage of the responses classified
into five categories, viz. Strongly Disagree (SD), Disagree (D), Neutral (N), Agree (A) and
Paraphrase This Document
Need a fresh take? Get an instant paraphrase of this document with our AI Paraphraser
10RELIANCE OF EXTERNAL AUDITING ON INTERNAL AUDITING
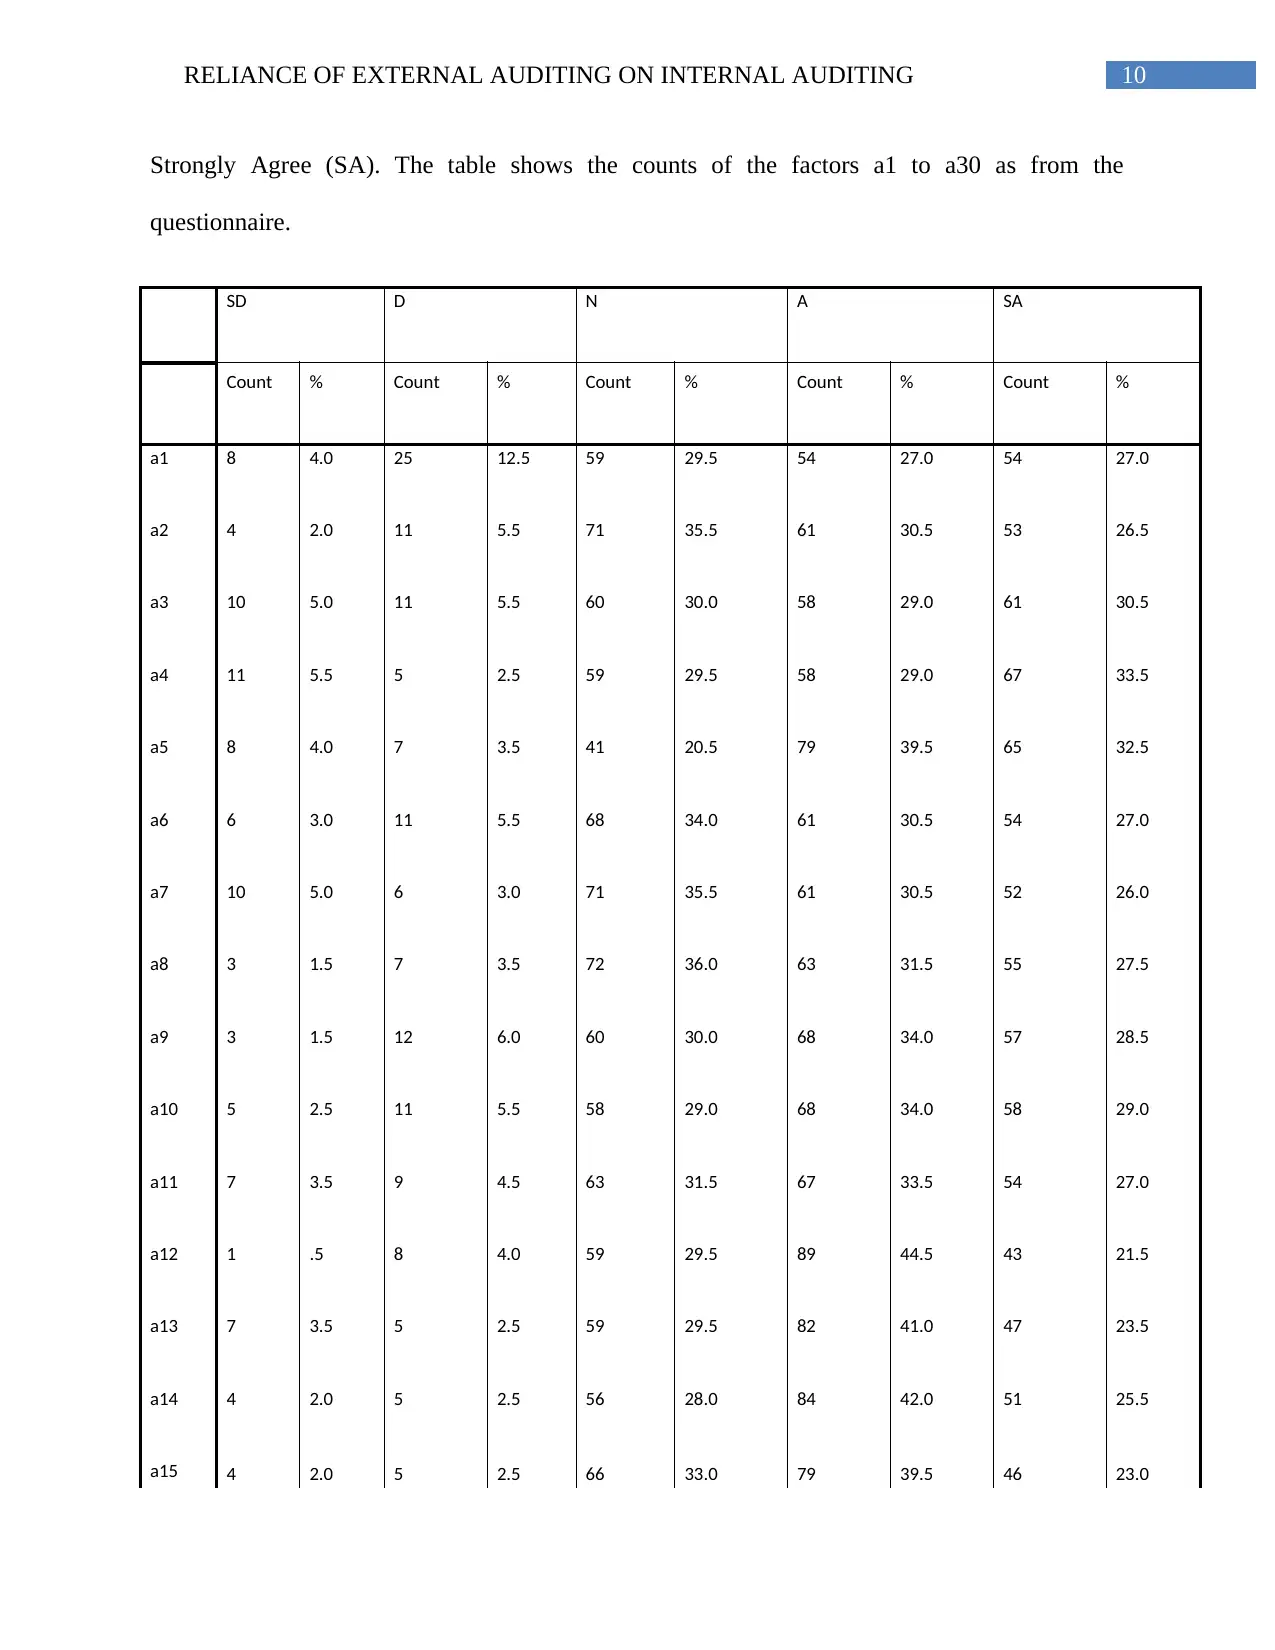
Strongly Agree (SA). The table shows the counts of the factors a1 to a30 as from the
questionnaire.
SD D N A SA
Count % Count % Count % Count % Count %
a1 8 4.0 25 12.5 59 29.5 54 27.0 54 27.0
a2 4 2.0 11 5.5 71 35.5 61 30.5 53 26.5
a3 10 5.0 11 5.5 60 30.0 58 29.0 61 30.5
a4 11 5.5 5 2.5 59 29.5 58 29.0 67 33.5
a5 8 4.0 7 3.5 41 20.5 79 39.5 65 32.5
a6 6 3.0 11 5.5 68 34.0 61 30.5 54 27.0
a7 10 5.0 6 3.0 71 35.5 61 30.5 52 26.0
a8 3 1.5 7 3.5 72 36.0 63 31.5 55 27.5
a9 3 1.5 12 6.0 60 30.0 68 34.0 57 28.5
a10 5 2.5 11 5.5 58 29.0 68 34.0 58 29.0
a11 7 3.5 9 4.5 63 31.5 67 33.5 54 27.0
a12 1 .5 8 4.0 59 29.5 89 44.5 43 21.5
a13 7 3.5 5 2.5 59 29.5 82 41.0 47 23.5
a14 4 2.0 5 2.5 56 28.0 84 42.0 51 25.5
a15 4 2.0 5 2.5 66 33.0 79 39.5 46 23.0
11RELIANCE OF EXTERNAL AUDITING ON INTERNAL AUDITING
a16 7 3.5 3 1.5 66 33.0 79 39.5 45 22.5
a17 7 3.5 2 1.0 63 31.5 81 40.5 47 23.5
a18 5 2.5 4 2.0 70 35.0 72 36.0 49 24.5
a19 7 3.5 8 4.0 68 34.0 69 34.5 48 24.0
a20 5 2.5 10 5.0 66 33.0 70 35.0 49 24.5
a21 8 4.0 10 5.0 47 23.5 51 25.5 84 42.0
a22 5 2.5 8 4.0 49 24.5 48 24.0 90 45.0
a23 8 4.0 2 1.0 62 31.0 58 29.0 70 35.0
a24 8 4.0 16 8.0 60 30.0 40 20.0 76 38.0
a25 8 4.0 9 4.5 48 24.0 53 26.5 82 41.0
a26 9 4.5 16 8.0 36 18.0 52 26.0 87 43.5
a27 3 1.5 8 4.0 40 20.0 71 35.5 78 39.0
a28 7 3.5 4 2.0 47 23.5 65 32.5 77 38.5
a29 6 3.0 4 2.0 46 23.0 57 28.5 87 43.5
a30 5 2.5 12 6.0 46 23.0 59 29.5 78 39.0
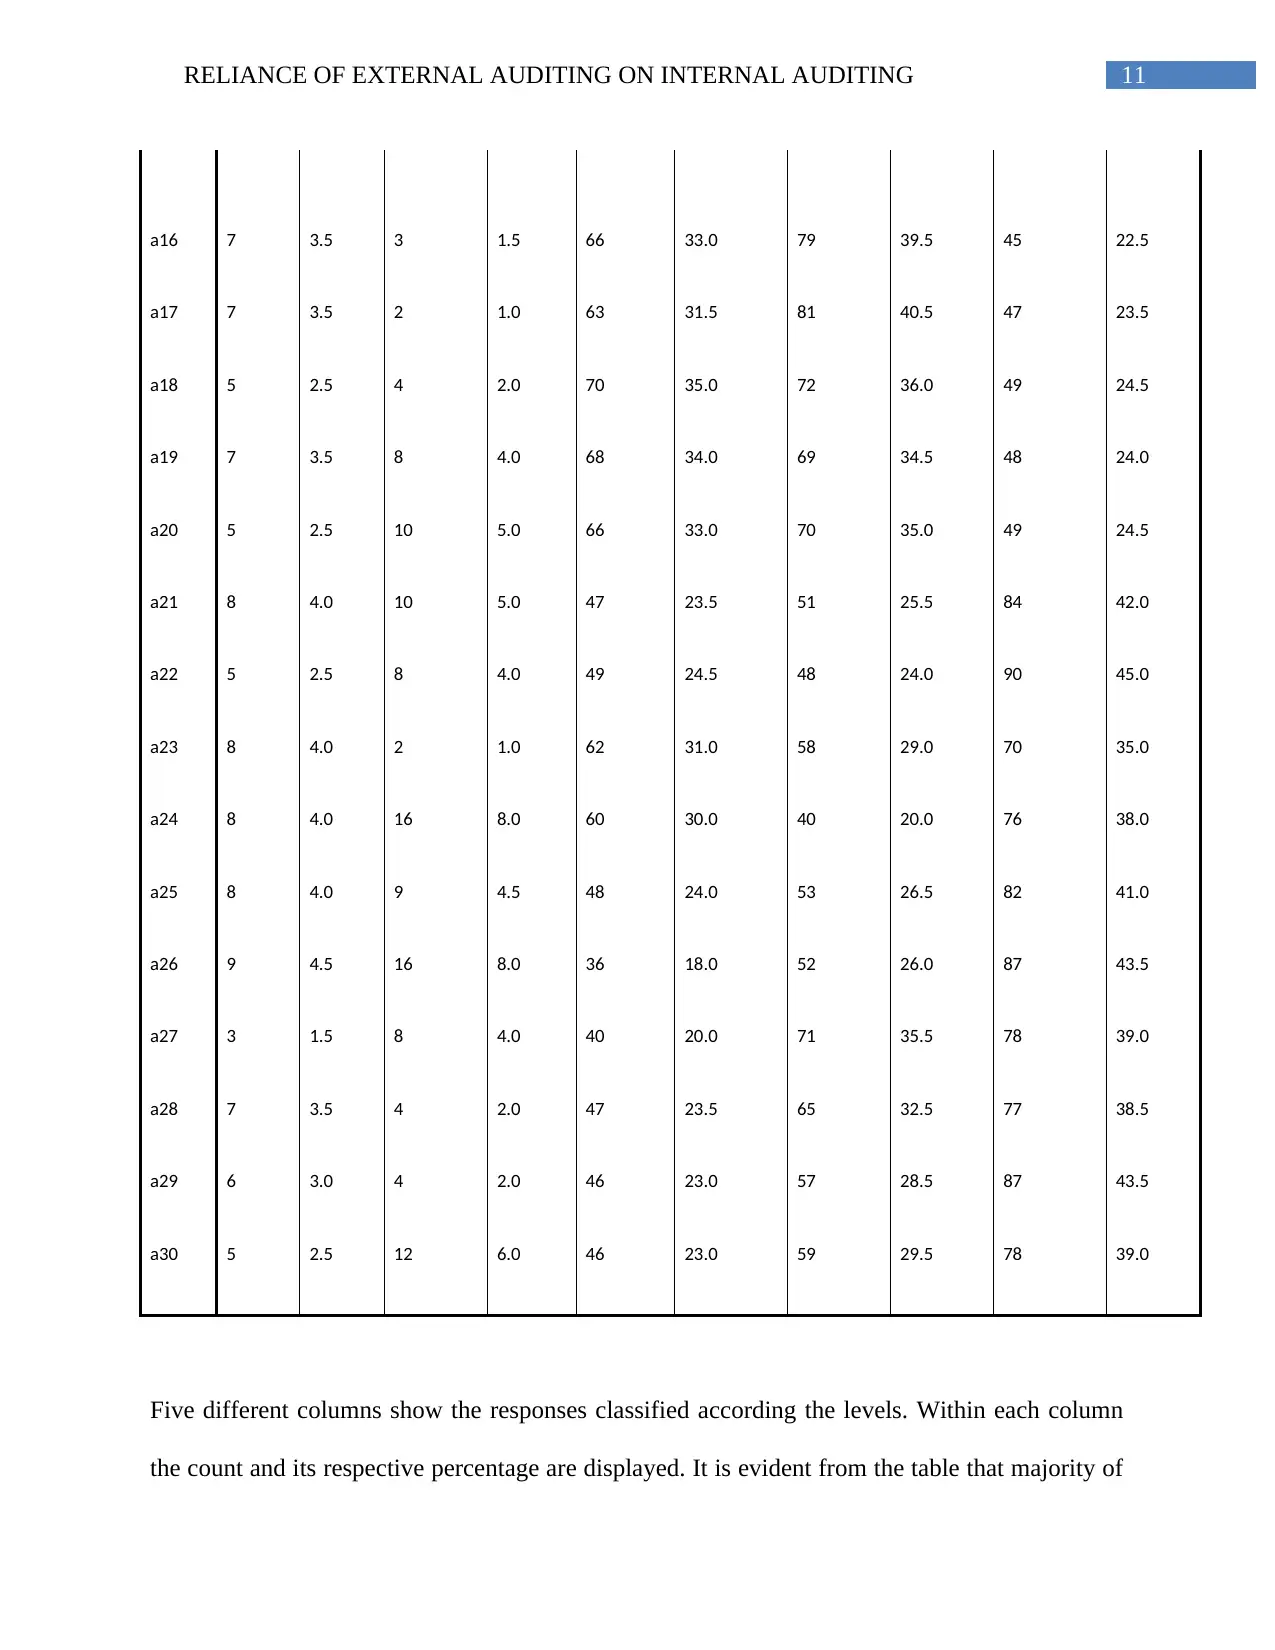
Five different columns show the responses classified according the levels. Within each column
the count and its respective percentage are displayed. It is evident from the table that majority of
a16 7 3.5 3 1.5 66 33.0 79 39.5 45 22.5
a17 7 3.5 2 1.0 63 31.5 81 40.5 47 23.5
a18 5 2.5 4 2.0 70 35.0 72 36.0 49 24.5
a19 7 3.5 8 4.0 68 34.0 69 34.5 48 24.0
a20 5 2.5 10 5.0 66 33.0 70 35.0 49 24.5
a21 8 4.0 10 5.0 47 23.5 51 25.5 84 42.0
a22 5 2.5 8 4.0 49 24.5 48 24.0 90 45.0
a23 8 4.0 2 1.0 62 31.0 58 29.0 70 35.0
a24 8 4.0 16 8.0 60 30.0 40 20.0 76 38.0
a25 8 4.0 9 4.5 48 24.0 53 26.5 82 41.0
a26 9 4.5 16 8.0 36 18.0 52 26.0 87 43.5
a27 3 1.5 8 4.0 40 20.0 71 35.5 78 39.0
a28 7 3.5 4 2.0 47 23.5 65 32.5 77 38.5
a29 6 3.0 4 2.0 46 23.0 57 28.5 87 43.5
a30 5 2.5 12 6.0 46 23.0 59 29.5 78 39.0
Five different columns show the responses classified according the levels. Within each column
the count and its respective percentage are displayed. It is evident from the table that majority of
⊘ This is a preview!⊘
Do you want full access?
Subscribe today to unlock all pages.
Trusted by 1+ million students worldwide
1 out of 49
Your All-in-One AI-Powered Toolkit for Academic Success.
+13062052269
info@desklib.com
Available 24*7 on WhatsApp / Email
![[object Object]](/_next/static/media/star-bottom.7253800d.svg)
Unlock your academic potential
Copyright © 2020–2026 A2Z Services. All Rights Reserved. Developed and managed by ZUCOL.