External Environment Analysis: Chapter 3 Presentation for Business

Verified

Added on  2022/10/17

|28
|2191
|86
Presentation
AI Summary
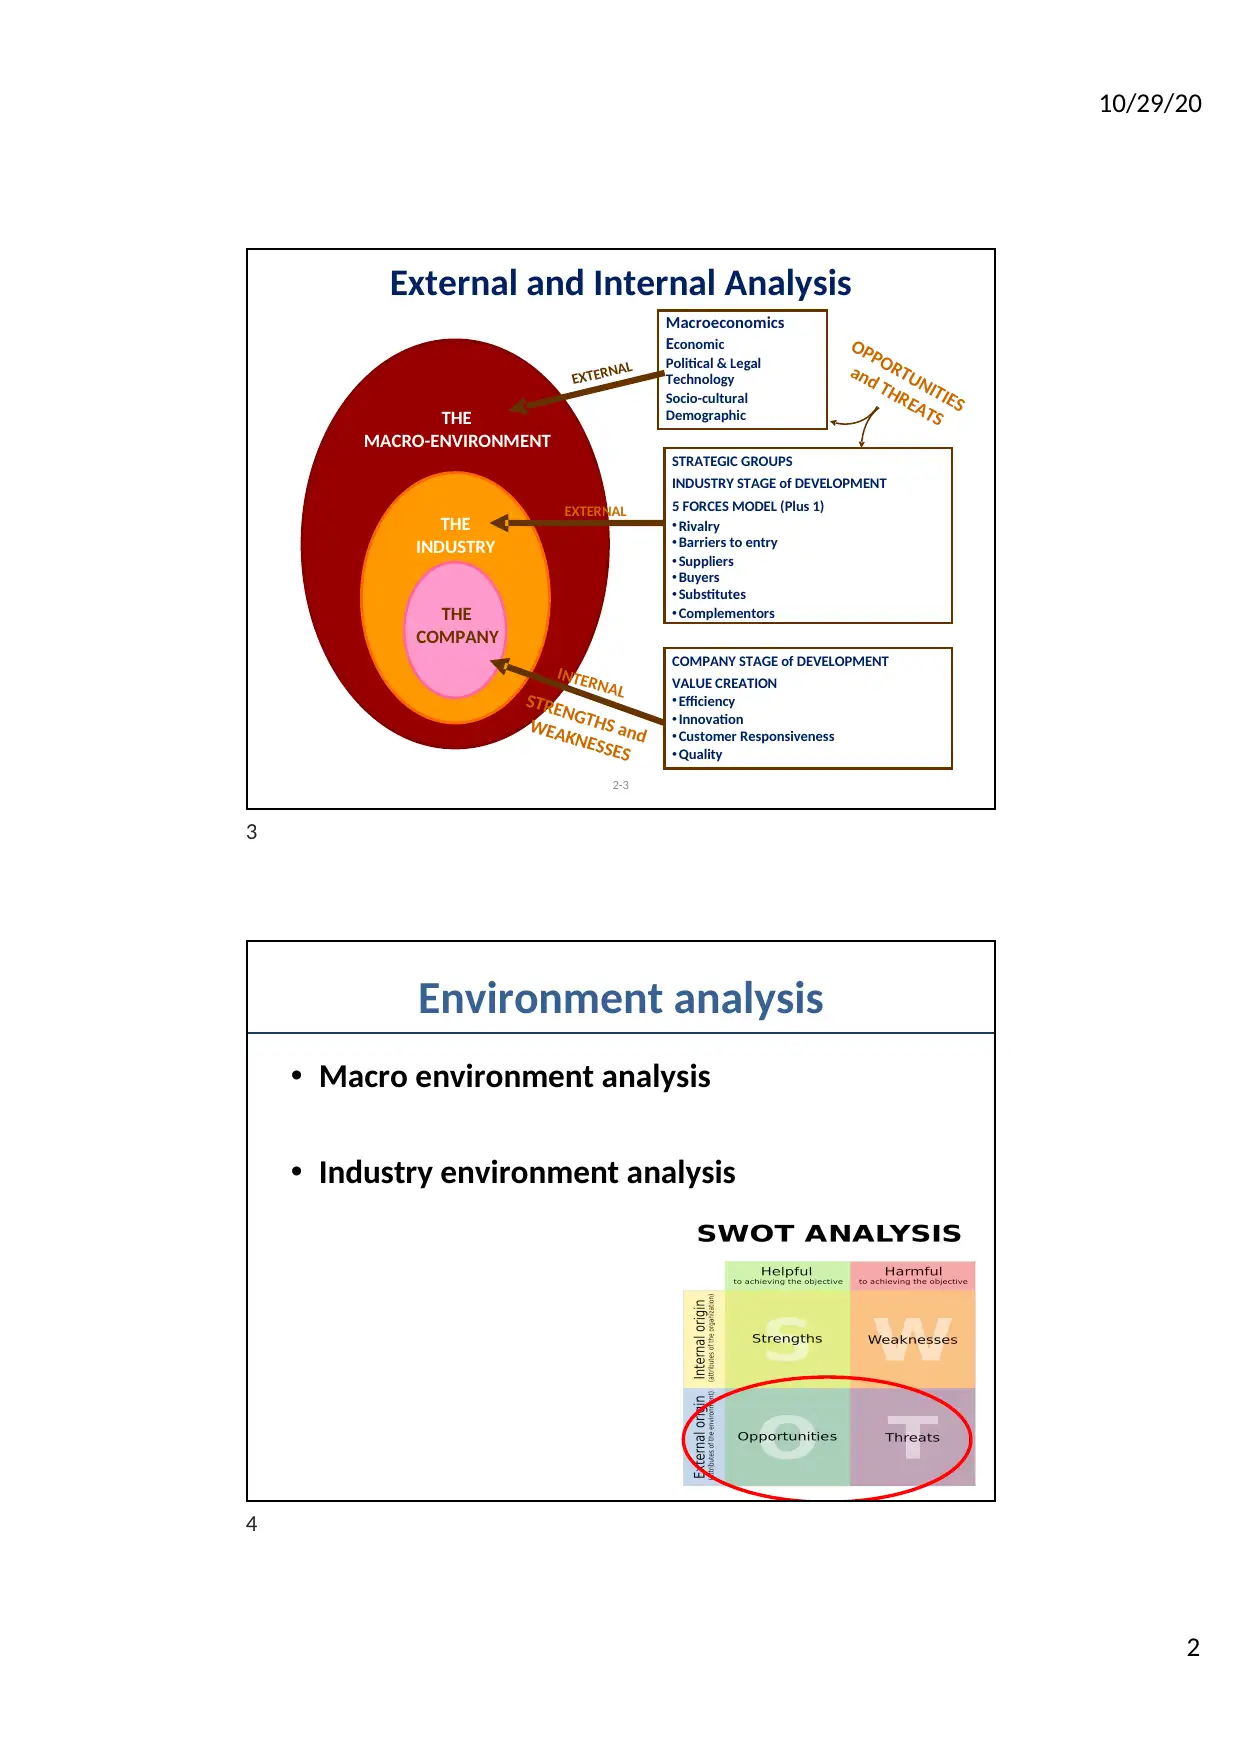
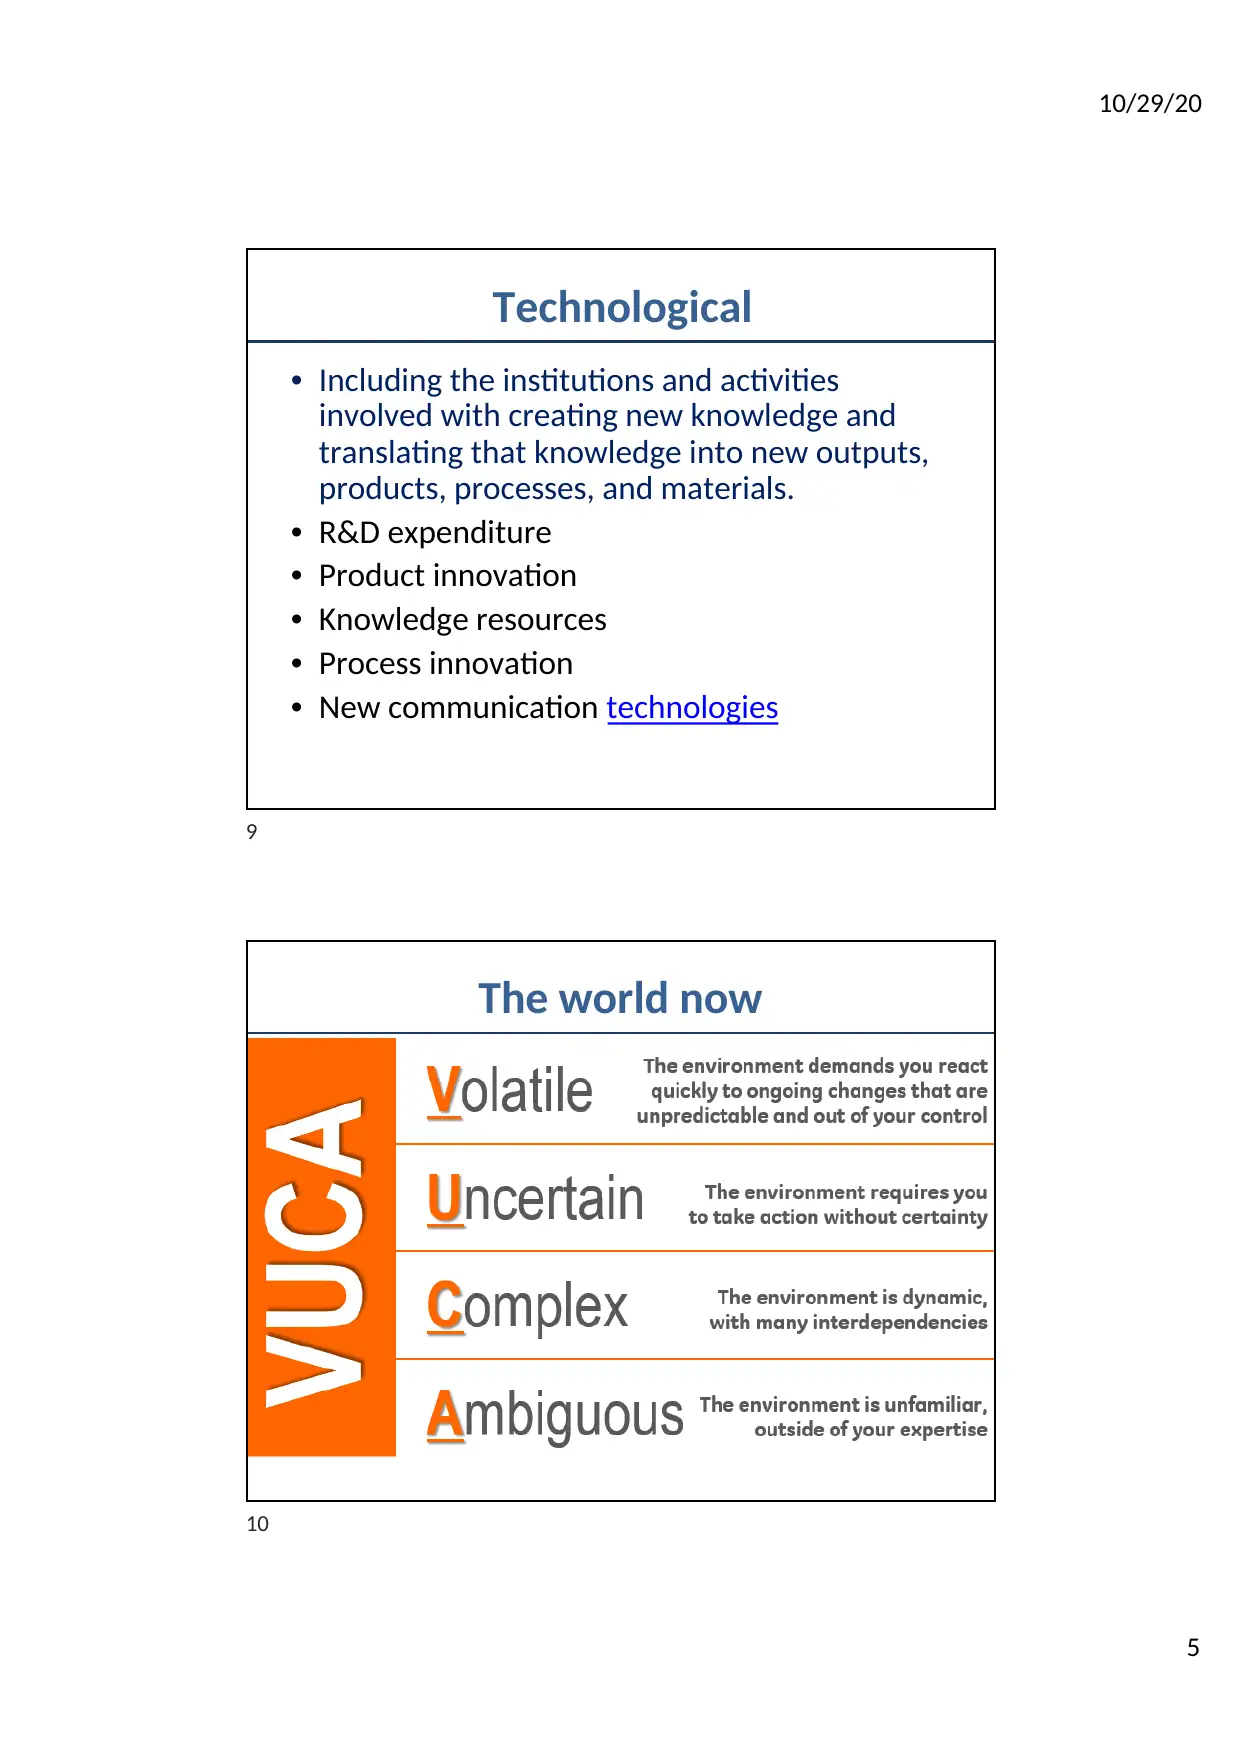
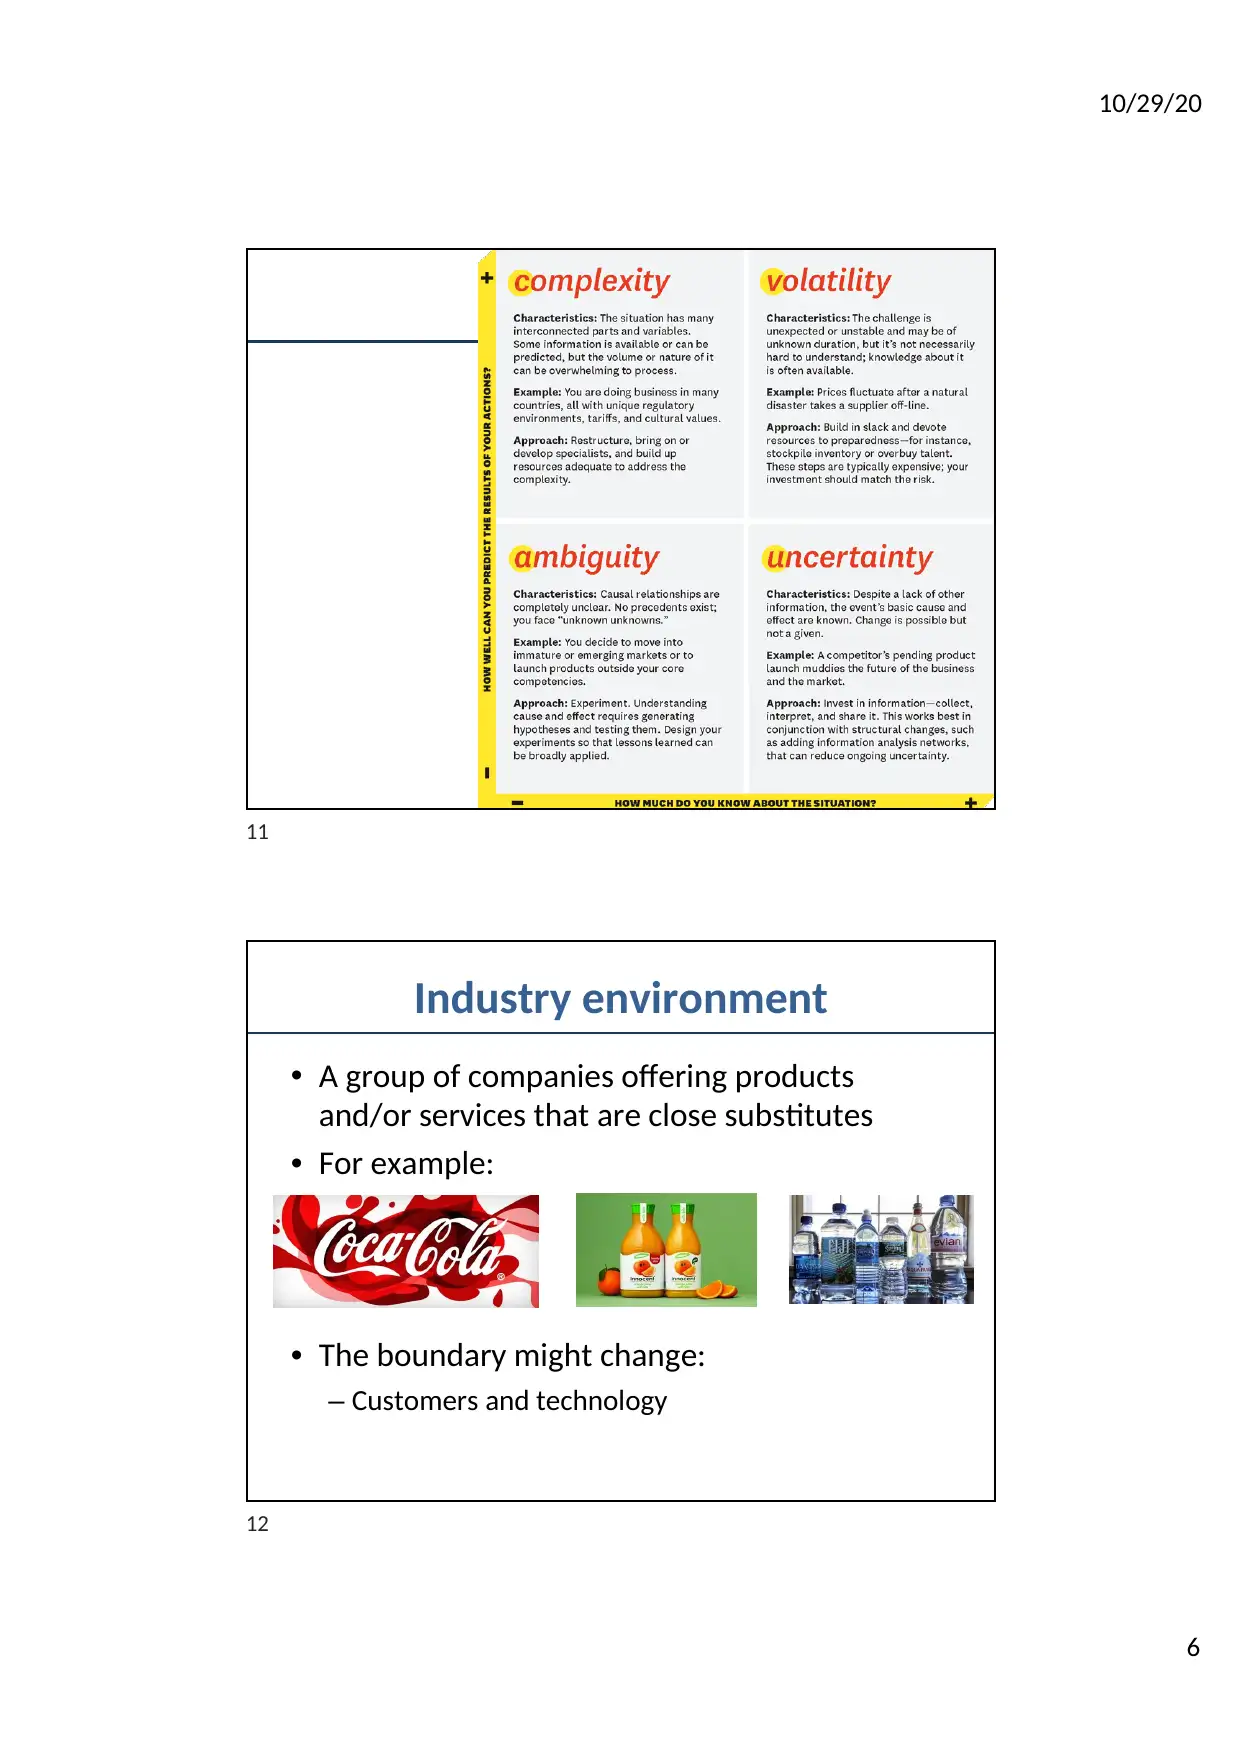
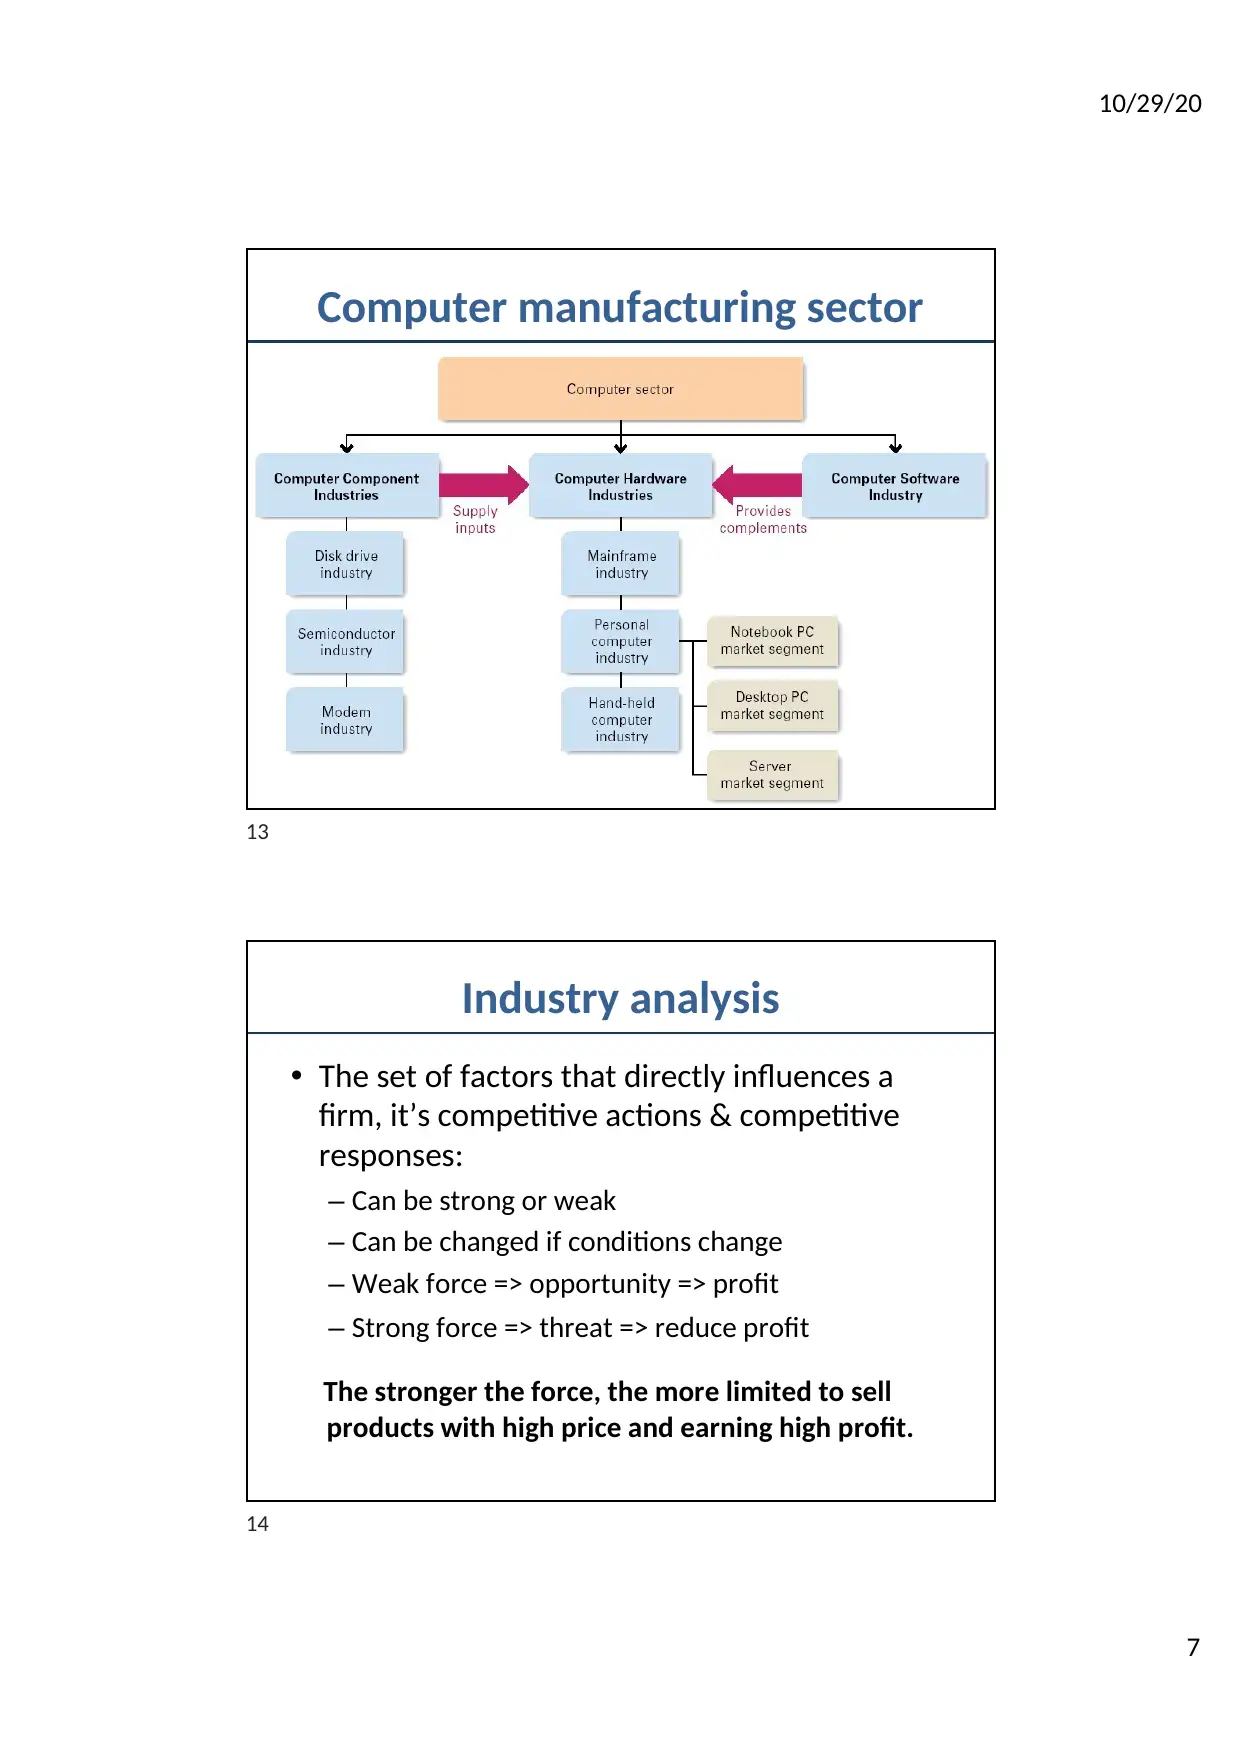
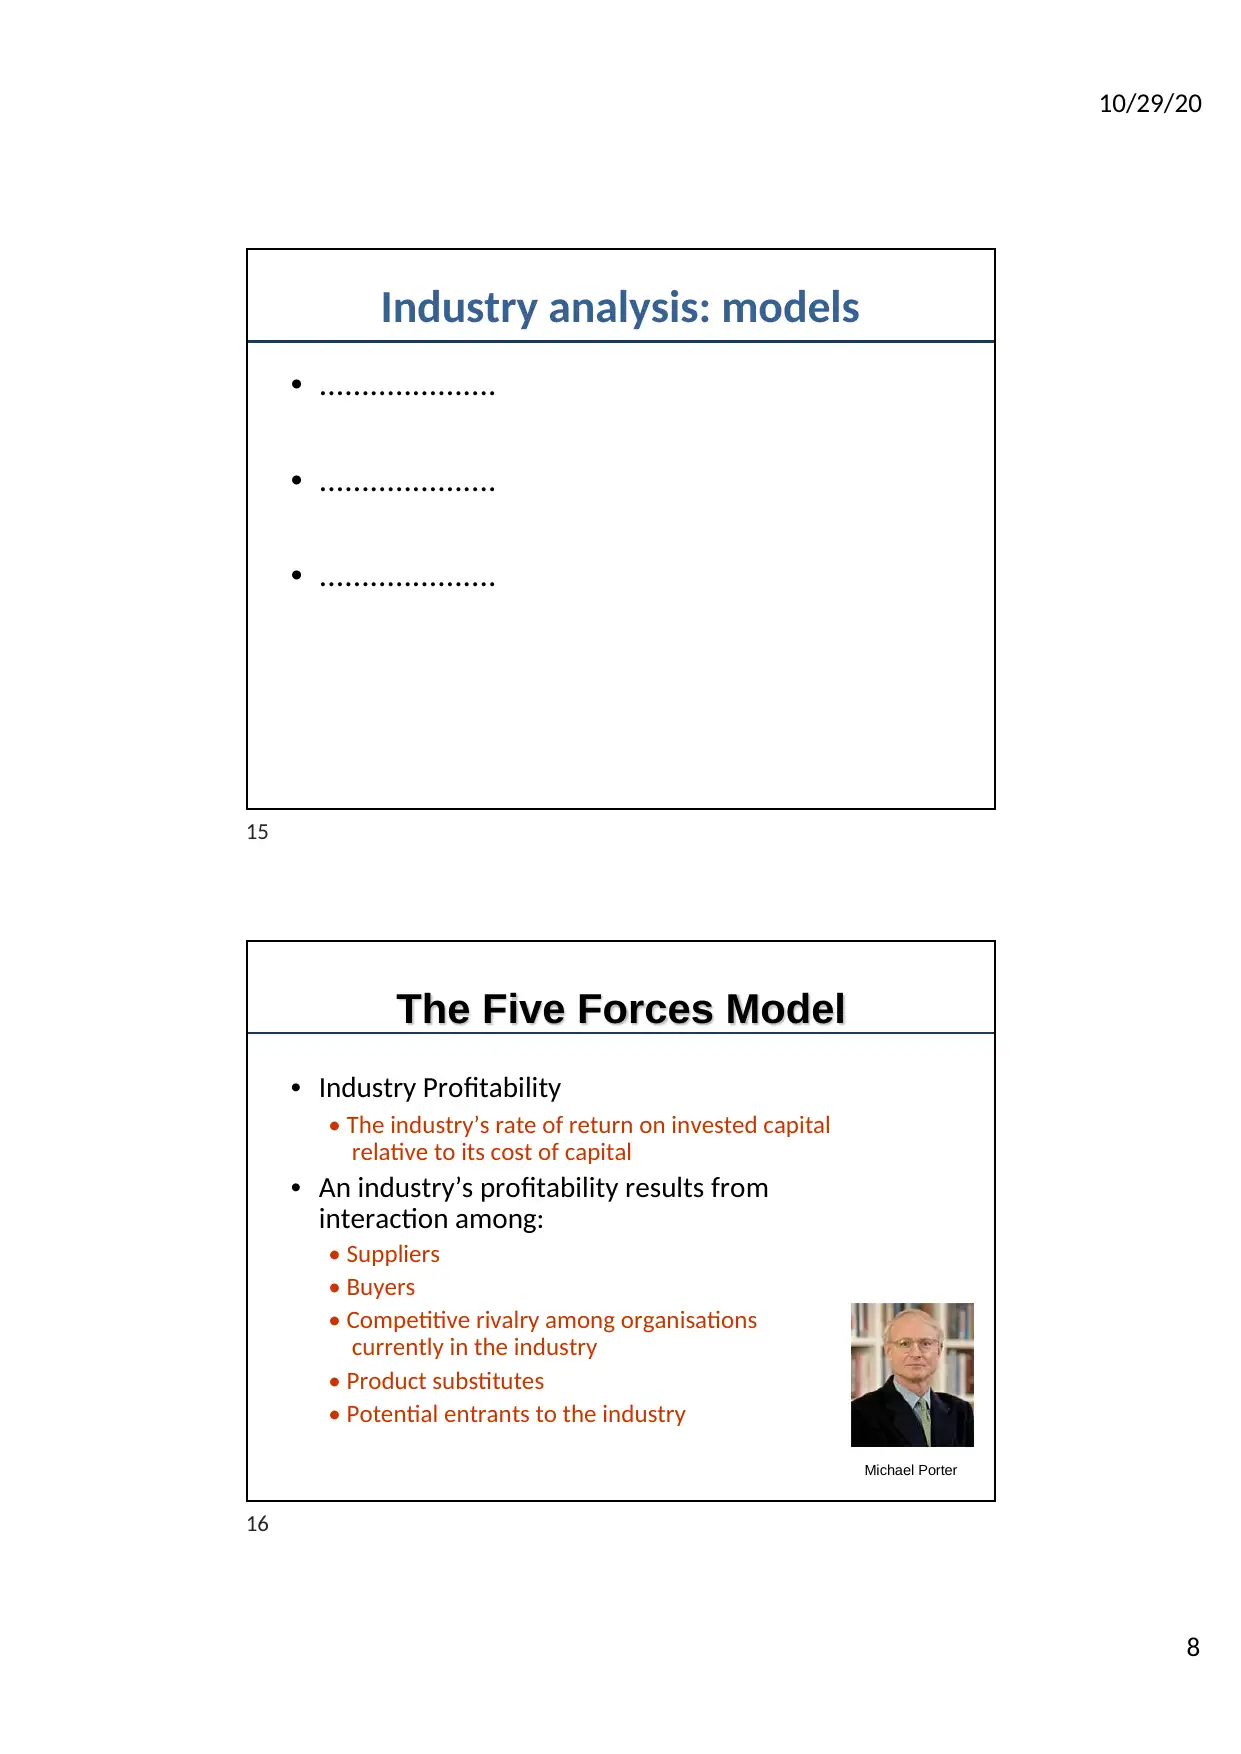
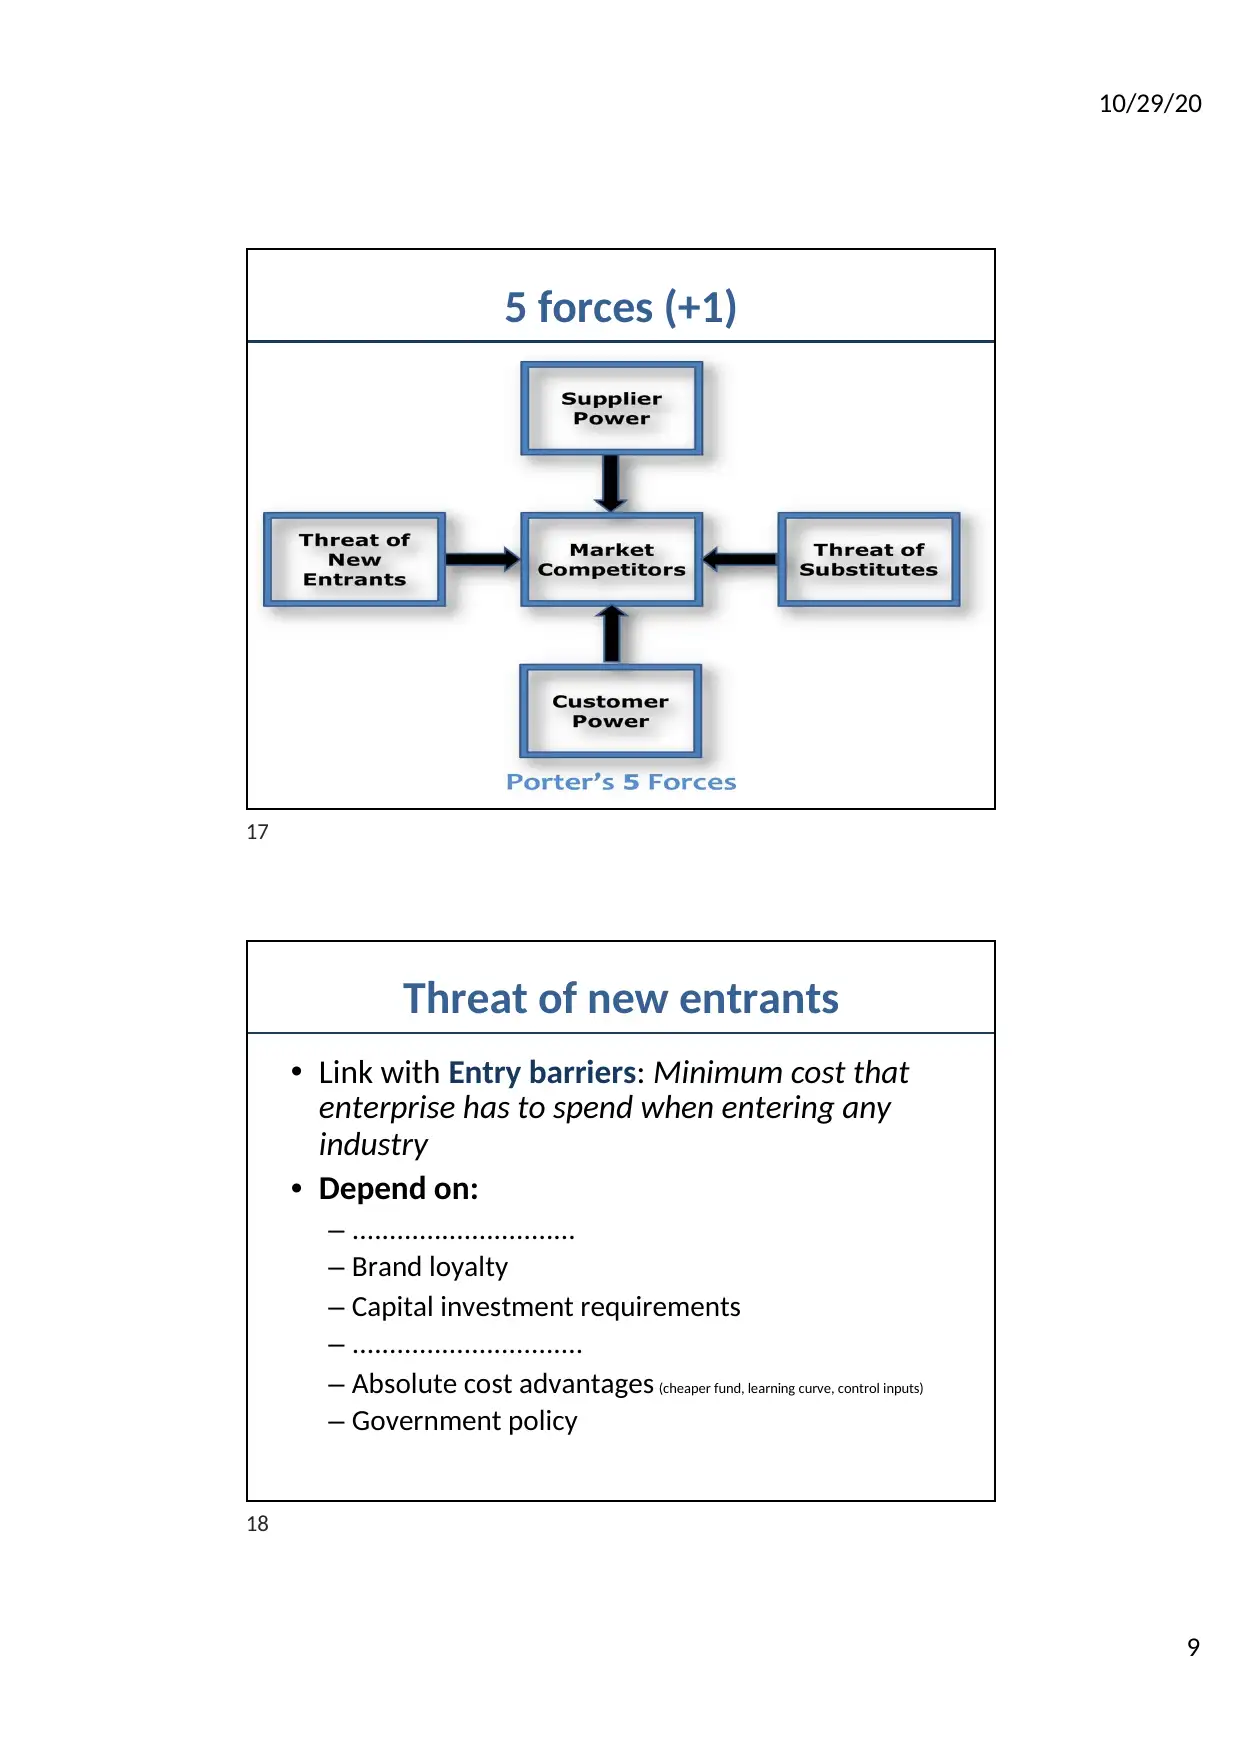
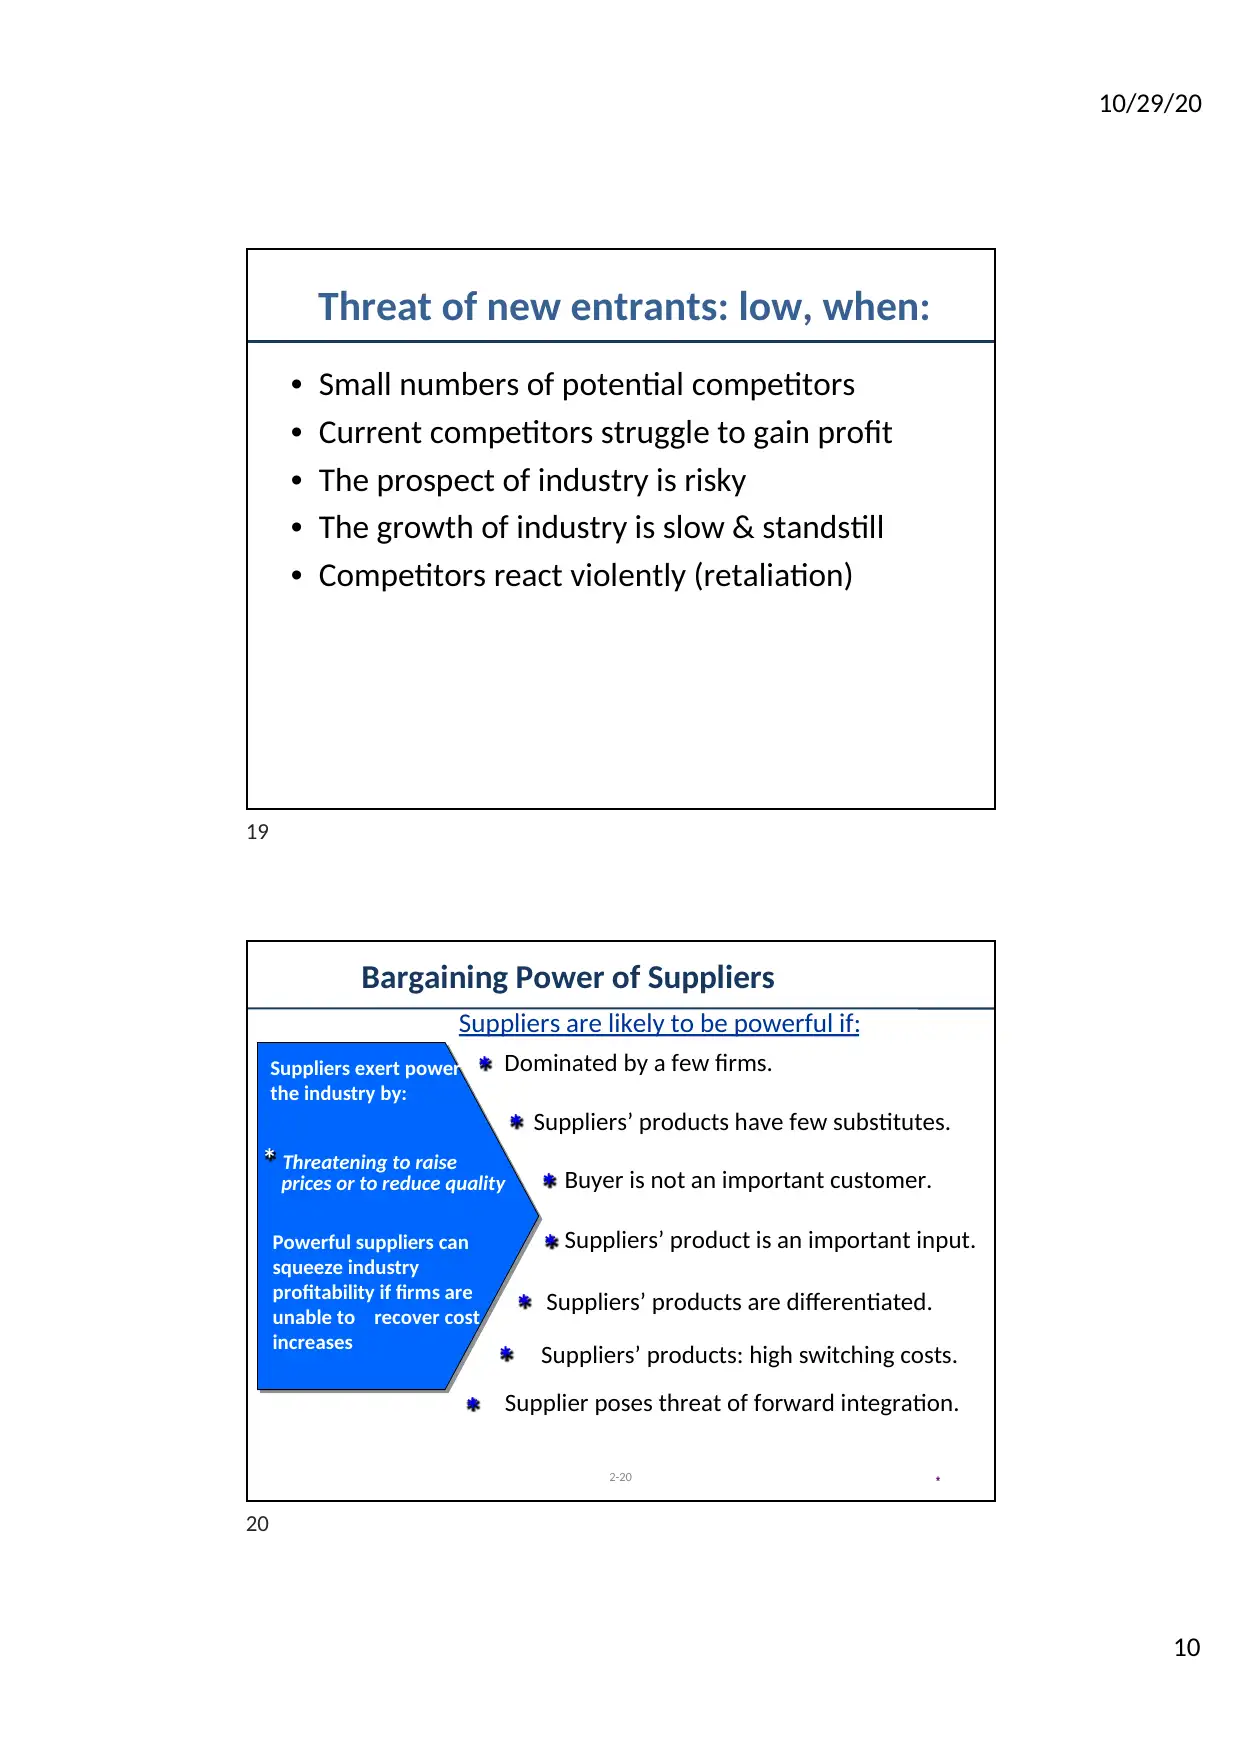
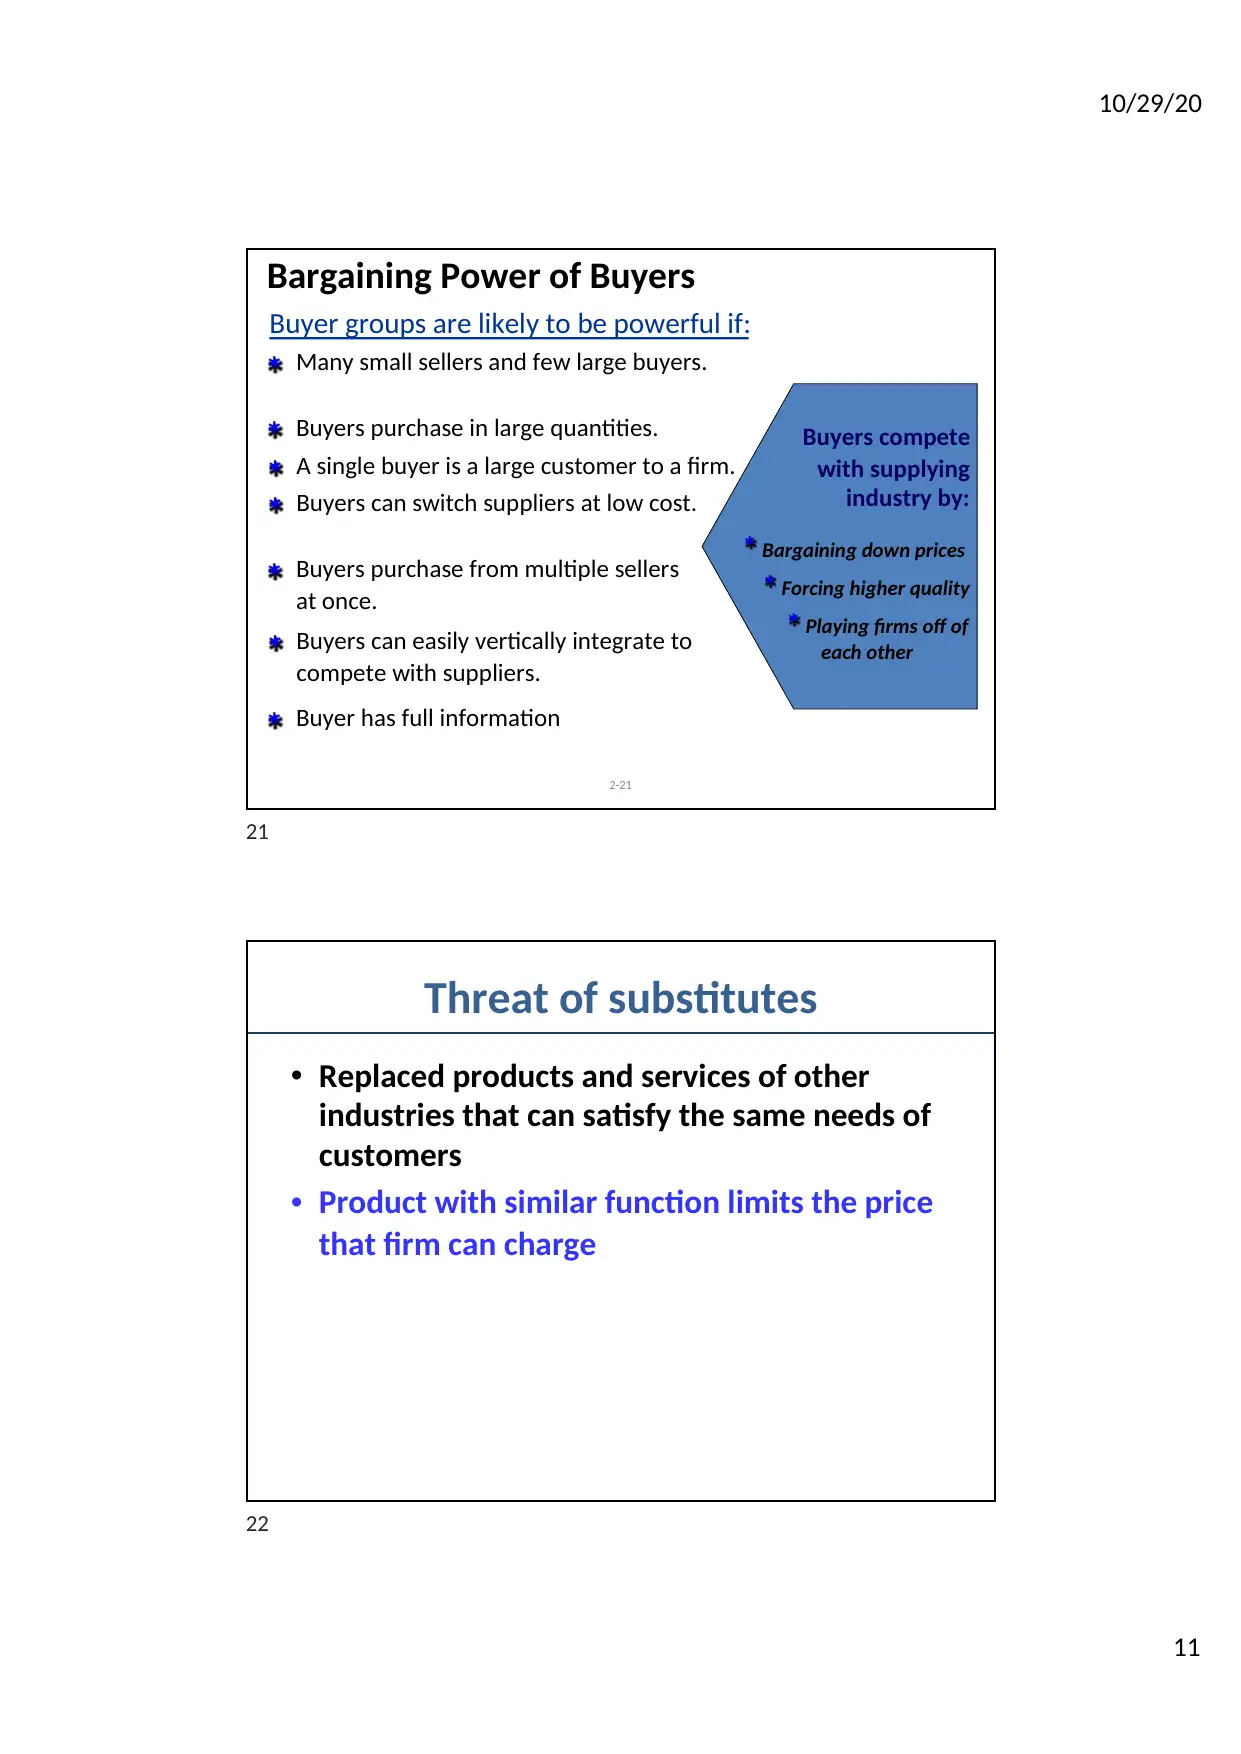
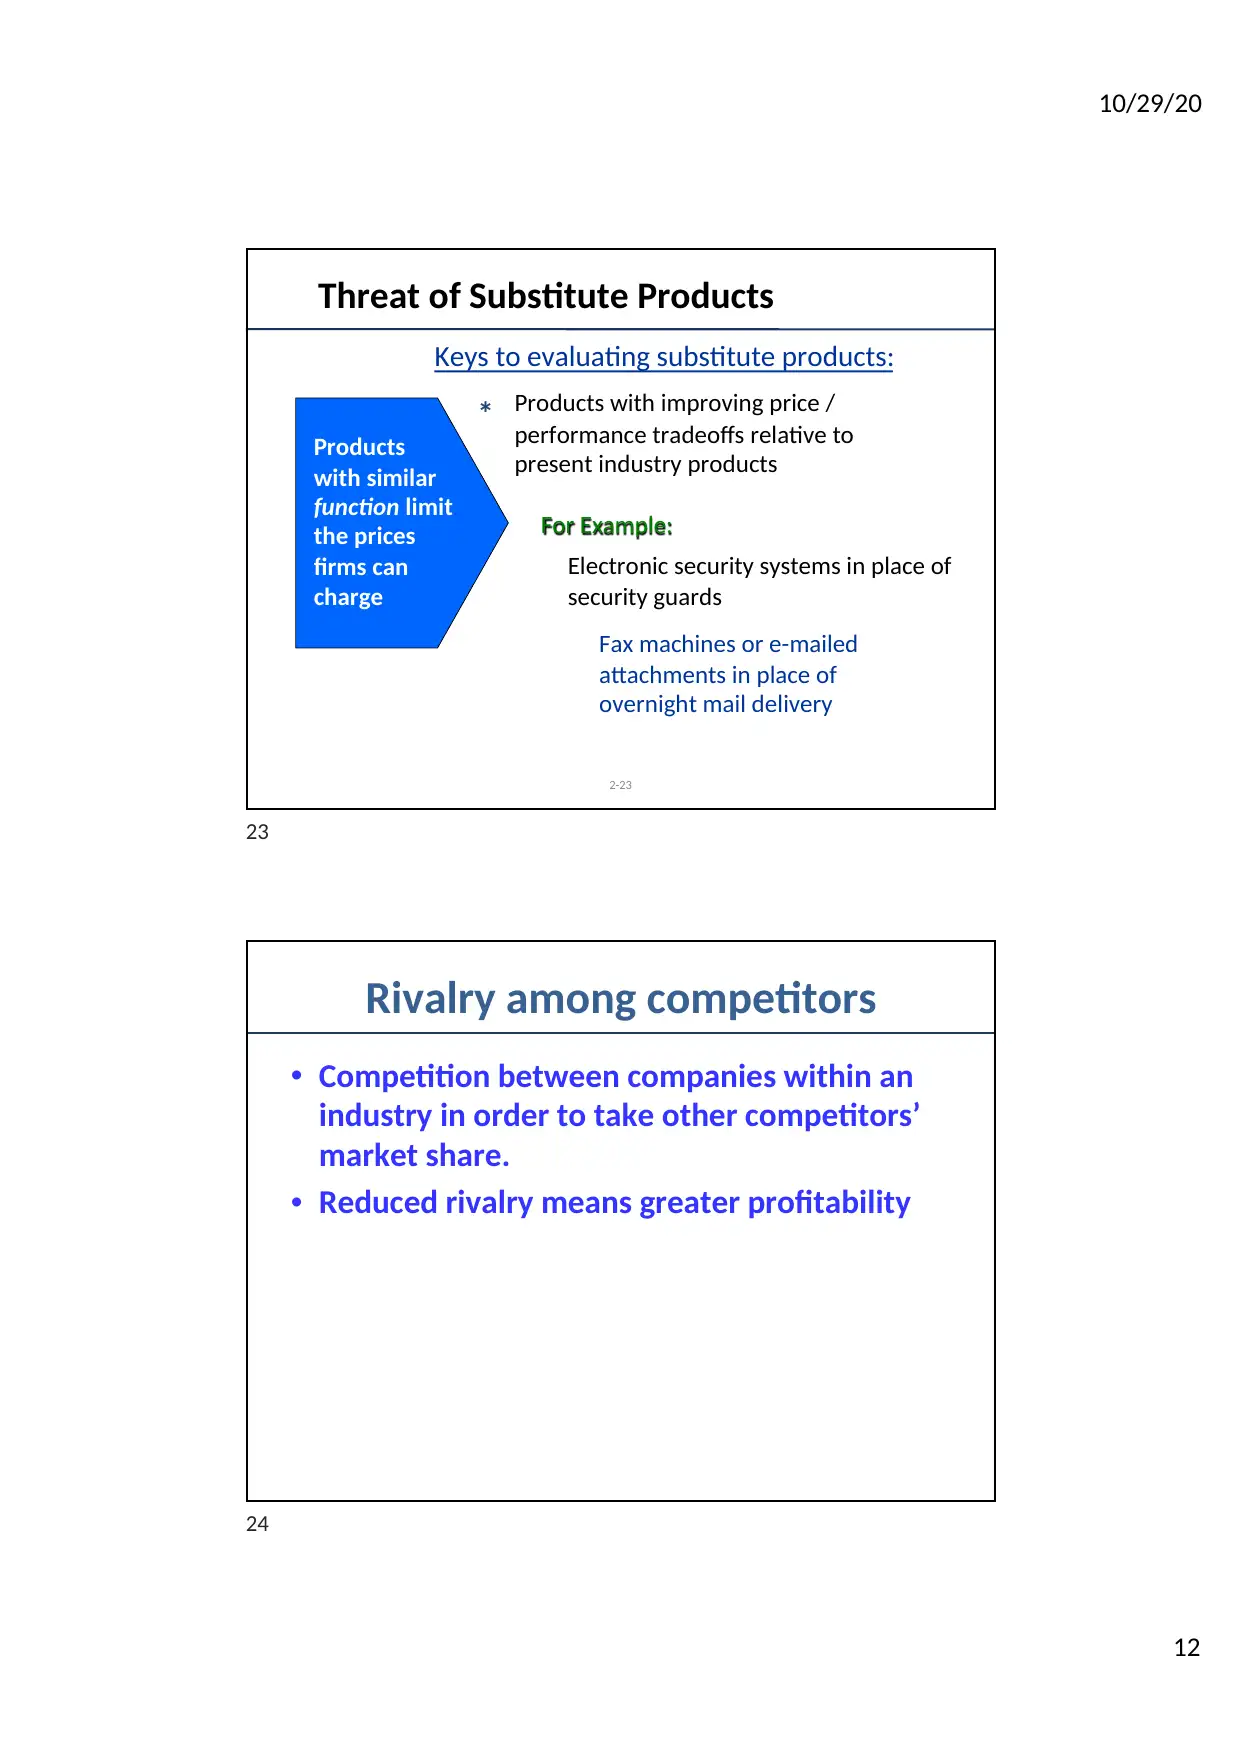
This presentation, prepared by Assoc. Prof. Dr. Lê Thái Phong, Dean of the Faculty of Business Administration at Foreign Trade University, provides a comprehensive overview of external environment analysis. It covers key concepts such as macro environments (political, economic, sociocultural, and technological factors), industry environments (including the Five Forces model), competitor intelligence, strategic groups, and industry life cycles. The presentation also explores various models and frameworks for analyzing the external environment, offering valuable insights into how these factors impact business strategy and decision-making. The content is organized with clear learning objectives, diagrams, and examples to facilitate understanding of complex business concepts. This presentation is a valuable resource for students studying business administration and strategic management, offering a practical guide to analyzing the external environment and its implications for business success.
Document Page
10/29/20
1
Chapter 3
External Environment Analysis
Assoc Prof. Dr. Lê Thái Phong
Dean, Faculty of Business Administration
Foreign Trade University
E: lethaiphong@ftu.edu.vn
T: 0975.055.299
1
Learning objectives
1. Macro environments
2. Industry environments
3. Competitor intelligence
2
tabler-icon-diamond-filled.svg

Secure Best Marks with AI Grader

Need help grading? Try our AI Grader for instant feedback on your assignments.
Document Page
10/29/20
2
2-3
THE
MACRO-ENVIRONMENT
THE
INDUSTRY
External and Internal Analysis
THE
COMPANY
STRATEGIC GROUPS
INDUSTRY STAGE of DEVELOPMENT
5 FORCES MODEL (Plus 1)
Rivalry
Barriers to entry
Suppliers
Buyers
Substitutes
Complementors
EXTERNAL
Macroeconomics
Economic
Political & Legal
Technology
Socio-cultural
Demographic
EXTERNAL
COMPANY STAGE of DEVELOPMENT
VALUE CREATION
Efficiency
Innovation
Customer Responsiveness
Quality
INTERNAL
STRENGTHS and
WEAKNESSES
OPPORTUNITIES
and THREATS
3
Environment analysis
Macro environment analysis
Industry environment analysis
4
Document Page
10/29/20
3
Macro environment
Driving economic, political/legal, and
technological conditions and changes ->
creating both opportunities and threats
PEST = ...............
Political
Economic
Sociocultural
Technological
5
Political
influencing the nature of
competition -> creating
opportunities and threats
Political system: stable – unstable
Political risks
De/regulation
Competition law
Labour law
Tax system
6
Document Page
10/29/20
4
Economic
affecting how difficult or easy to be unsuccessful
and profitable any time
Economic system
GDP growth rate
GDP per capita
Inflation
Interest rate
Exchange rate
Trade deficit or surplus
Budget deficit or surplus
7
sociocultural
Environment concern
Workforce diversity
Work-life quality view
Shift in product/quality preferences
8
tabler-icon-diamond-filled.svg

Secure Best Marks with AI Grader

Need help grading? Try our AI Grader for instant feedback on your assignments.
Document Page
10/29/20
5
Technological
Including the institutions and activities
involved with creating new knowledge and
translating that knowledge into new outputs,
products, processes, and materials.
R&D expenditure
Product innovation
Knowledge resources
Process innovation
New communication technologies
9
The world now
10
Document Page
10/29/20
6
11
Industry environment
A group of companies offering products
and/or services that are close substitutes
For example:
The boundary might change:
Customers and technology
12
Document Page
10/29/20
7
Computer manufacturing sector
13
Industry analysis
The set of factors that directly influences a
firm, it’s competitive actions & competitive
responses:
Can be strong or weak
Can be changed if conditions change
Weak force => opportunity => profit
Strong force => threat => reduce profit
The stronger the force, the more limited to sell
products with high price and earning high profit.
14
tabler-icon-diamond-filled.svg

Paraphrase This Document

Need a fresh take? Get an instant paraphrase of this document with our AI Paraphraser
Document Page
10/29/20
8
Industry analysis: models
.....................
.....................
.....................
15
Industry Profitability
The industry’s rate of return on invested capital
relative to its cost of capital
An industry’s profitability results from
interaction among:
Suppliers
Buyers
Competitive rivalry among organisations
currently in the industry
Product substitutes
Potential entrants to the industry
Michael Porter
The Five Forces Model
16
Document Page
10/29/20
9
5 forces (+1)
17
Threat of new entrants
Link with Entry barriers: Minimum cost that
enterprise has to spend when entering any
industry
Depend on:
..............................
Brand loyalty
Capital investment requirements
...............................
Absolute cost advantages (cheaper fund, learning curve, control inputs)
Government policy
18
Document Page
10/29/20
10
Threat of new entrants: low, when:
Small numbers of potential competitors
Current competitors struggle to gain profit
The prospect of industry is risky
The growth of industry is slow & standstill
Competitors react violently (retaliation)
19
2-20
* Dominated by a few firms.
* Buyer is not an important customer.
* Suppliers’ product is an important input.
* Suppliers’ products are differentiated.
Suppliers are likely to be powerful if:
* Suppliers’ products: high switching costs.
* Supplier poses threat of forward integration.
Suppliers exert power in
the industry by:
* Threatening to raise
prices or to reduce quality
Powerful suppliers can
squeeze industry
profitability if firms are
unable to recover cost
increases
Suppliers’ products have few substitutes.*
Bargaining Power of Suppliers
*
20
tabler-icon-diamond-filled.svg

Secure Best Marks with AI Grader

Need help grading? Try our AI Grader for instant feedback on your assignments.
Document Page
10/29/20
11
2-21
* Playing firms off of
each other
Buyers compete
with supplying
industry by:
* Bargaining down prices
* Forcing higher quality
Buyer groups are likely to be powerful if:
* Many small sellers and few large buyers.
* Buyers purchase in large quantities.
* A single buyer is a large customer to a firm.
* Buyers can switch suppliers at low cost.
* Buyers purchase from multiple sellers
at once.
* Buyers can easily vertically integrate to
compete with suppliers.
* Buyer has full information
Bargaining Power of Buyers
21
Threat of substitutes
Replaced products and services of other
industries that can satisfy the same needs of
customers
Product with similar function limits the price
that firm can charge
22
Document Page
10/29/20
12
2-23
Products
with similar
function limit
the prices
firms can
charge
* Products with improving price /
performance tradeoffs relative to
present industry products
Keys to evaluating substitute products:
For Example:
Electronic security systems in place of
security guards
Fax machines or e-mailed
attachments in place of
overnight mail delivery
Threat of Substitute Products
23
Rivalry among competitors
Competition between companies within an
industry in order to take other competitors’
market share.
Reduced rivalry means greater profitability
24
Document Page
10/29/20
13
Rivalry among competitors
Intense rivalry often plays out in:
Jockeying for strategic position
Using price competition
Staging advertising battles
Increasing consumer warranties or service
Making new product introductions
25
Rivalry among competitors
Occurs when a firm is pressured or sees an
opportunity:
Price competition often leaves entire industry
worse off
Advertising battles may increase total industry
demand, but may be costly to smaller competitors
26
tabler-icon-diamond-filled.svg

Paraphrase This Document

Need a fresh take? Get an instant paraphrase of this document with our AI Paraphraser
Document Page
10/29/20
14
Rivalry among competitors
Rivalry among competitors Industry’s
competitive structure.
Competitive structure
Demand (growth or decline) conditions in industry.
Height of industry exit barriers.
27
Rivalry among competitors
Competitive structure: .......................... index
Continuum of
Industry Structures
Fragmented
Many firms,
no dominant
firm
Few firms,
shared dominance
(oligopoly)
Consolidated
Few, even one
firm or one
dominant firm
(monopoly)
28
Document Page
10/29/20
15
2-29
* Specialized assets
Height of industry exit barriersare economic, strategic and
emotional factors which cause companies to remain in
an industry even when future profitability is
questionable.
Fixed cost of exit (e.g., labour agreements)* Strategic interrelationships*
Emotional barriers*
Government and social restrictions*
Rivalry Among Existing Competitors
29
2-30
Complementors
Complementors:
Companies whose products are sold with another
company’s products.
Increased supply of a complementary product
accordingly increases demand for the primary
product.
Example:
Faster CPU chips fuel sales
of personal computers.
30
Document Page
10/29/20
16
Practice
Using 5 Forces Model to analyse industry
environment of your firm
31
Industry analysis: models
..........................
..........................
..........................
32
tabler-icon-diamond-filled.svg

Secure Best Marks with AI Grader

Need help grading? Try our AI Grader for instant feedback on your assignments.
Document Page
10/29/20
17
2-33
Strategic Groups Within Industries
The concept of strategic groups
Within an industry, a competitor grouping using similar
strategies that differ from other industry groups.
Cluster of firms that share similar strategies
Ø - Breadth of product and geographic scope
Ø - Price/quality policies
Ø - Degree of vertical integration
Ø - Type of distribution system
Ø - Customer service
Ø - Extent of technological leadership

33
An example: The Restaurant Industry
Fast Food
Café Quality
Fine Dining
Strategic Groups
34
Document Page
10/29/20
18
Strategic group
Implications of strategic groups
The closest industry competitors are those in the group.
Internal competition between strategic group firms is greater than
between firms outside that strategic group.
The various industry groups are differentially and
competitively advantaged and positioned.
Mobility barriers inhibit the movement of competitors from
one strategic group to another.
35
36
Document Page
10/29/20
19
Industry Life Cycle Stages
The industry life cycle = the stages of
introduction, growth, maturity, and decline that
typically occur over the life of an industry.
Introduction
Growth
Maturity
Decline
Generic strategies, value-creating activities, &
overall objectives all vary over the course of an
industry life cycle5-37
When considering a strategy form, an
industry’s life cycle should be taken into account
37
Industry Life Cycle Stages
5-38
Regeneration
Time horizon varies depending on industry dynamics
38
tabler-icon-diamond-filled.svg

Paraphrase This Document

Need a fresh take? Get an instant paraphrase of this document with our AI Paraphraser
Document Page
10/29/20
20
Strategies in the Introduction Stage
The introduction stage is when:
Products are unfamiliar to consumers
Market segments are not well-defined
Product features are not clearly specified
Competition tends to be limited
Perfecting product design
Slow growth
High prices
Undeveloped distribution
Education of customers
No/low profits
Extreme uncertainty
Limited competition
5-39
PC: 1970s
Wifi: 1980s
Dot.com: 1990s
Nano: 2000s
Now?
39
Strategies in the Introduction Stage
Strategies:
Develop a product and get users to try it
Generate exposure so the product becomes
standard”
40
Document Page
10/29/20
21
The Growth Stage
The growth stage is:
Characterized by strong increases in sales
1st time demand growing
Cash intensive; growth takes cash
When firms can build brand recognition
Competition not intense, but growing; new
entrants attracted by growth
Economies of scale and customer loyalty not yet
fully developed
5-41
41
Strategies in the Growth Stage
Strategies:
Create branded differentiated products
Stimulate selective demand
Provide financial resources to support value-chain
activities
42
Document Page
10/29/20
22
The Maturity Stage
The maturity stage is when:
Aggregate industry demand slows
Market totally saturated
Demand stabilizes at demographic growth levels; mainly
replacement demand
Market becomes saturated, few new adopters
Direct competition becomes predominant
Marginal competitors begin to exit
Weak companies have failed or been acquired
Economies of scale, brand loyalty, profit margins at
their peaks
Barriers to entry increase
Oligopoly/concentration often emerges
5-43
43
Strategies in the Maturity Stage
Strategies:
Create efficient manufacturing operations
Lower costs as customers become price-sensitive
44
tabler-icon-diamond-filled.svg

Secure Best Marks with AI Grader

Need help grading? Try our AI Grader for instant feedback on your assignments.
Document Page
10/29/20
23
Strategies in the Decline Stage
The decline stage is when:
Industry sales and profits begin to fall
Growth goes negative
Declining profit margins
Industry consolidation occurs
Competitive rivalry increases; struggle for big
share of declining market
Price competition increases
Excess capacity
Price competition
5-45
45
Strategies in the Decline Stage
Strategies:
Maintaining the product position
Harvesting profits & reducing costs
Exiting the market
Consolidating or acquiring surviving firms
46
Document Page
10/29/20
24
2-47
Competitor analysis
Competitor analysis uses competitor intelligence as a
tool. Competitor intelligence is the ethical gathering of
needed information and data about competitors’
objectives, strategies, assumptions, & capabilities.
What drives the competitor as shown by its
future objectives,
What the competitor is doing and can do as
revealed by its current strategy,
What the competitor believes about itself and
the industry, as shown by its assumptions,
What the the competitor may be able to do, as
shown by its capabilities.
47
2-48
Competitor Analysis
Future Objectives:
How do our goals compare
with our competitors’ goals?
Where will the emphasis be
placed in the future?
What is the attitude toward
risk?
Future objectives
48
Document Page
10/29/20
25
2-49
Competitor Analysis
Current strategy
Current Strategy:
Future objectives
How are we currently
competing?
Does this strategy support
changes in the competitive
structure?
49
2-50
Competitor Analysis
Assumptions
Current strategy
Assumptions:
Do we assume the future will
be volatile?
Are we operating under a
status quo?
What assumptions do our
competitors hold about the
industry and themselves?
Future objectives
50
tabler-icon-diamond-filled.svg

Paraphrase This Document

Need a fresh take? Get an instant paraphrase of this document with our AI Paraphraser
Document Page
10/29/20
26
2-51
Competitor Analysis
Capabilities
Capabilities:
What are our strengths and
weaknesses?
How do we rate compared to
our competitors?
Current strategy
Future objectives
Assumptions
51
2-52
Competitor Analysis
Response
Response:
What will our competitors do
in the future?
Where do we hold an advan-
tage over our competitors?
How will this change our
relationship with our
competitors?
Future objectives
Current strategy
Assumptions
Capabilities
52
Document Page
10/29/20
27
Results of external analysis
OPPORTUNITIES THREATS
Opportunity 1 Threat 1
Opportunity 2 Threat 2
Opportunity 3 Threat 3
53
54
Document Page
10/29/20
28
Thank you very much!
55
chevron_up_icon
1 out of 28
circle_padding
hide_on_mobile
zoom_out_icon
logo.png

Your All-in-One AI-Powered Toolkit for Academic Success.

Available 24*7 on WhatsApp / Email

[object Object]