Financial Management and Control Report: ExxonMobil Analysis
VerifiedAdded on 2023/04/23
|22
|5909
|209
Report
AI Summary
This report provides a comprehensive financial analysis of ExxonMobil's performance, focusing on the years 2016 and 2017. Part A involves conducting a DuPont analysis and calculating various financial ratios, including Return on Owners' Equity (ROOE), margin ratios, turnover ratios, and gearing ratios, to assess the company's profitability, asset turnover, and leverage. The analysis reveals improvements in ROOE and financial stability. Part B critically evaluates the statement that debt is always cheaper than equity, examining the advantages and disadvantages of debt financing. Part C delves into project evaluation, including relevant cash flows and investment appraisal techniques, followed by an evaluation of the project's impact on the company's success. The report highlights the importance of financial analysis for informed decision-making and strategic planning.
Running head: FINANCIAL MANAGEMENT AND CONTROL
Financial Management and Control
Name of the Student:
Name of the University:
Authors Note:
Financial Management and Control
Name of the Student:
Name of the University:
Authors Note:
Paraphrase This Document
Need a fresh take? Get an instant paraphrase of this document with our AI Paraphraser
FINANCIAL MANAGEMENT AND CONTROL
1
Table of Contents
Part A:........................................................................................................................................2
i) Conducting DuPont Analysis and Financial ratios for deriving the performance of the
organisation:...............................................................................................................................2
ii) Providing a report for the changes in profitability, asset turnover and leverage ratios:........4
Part B: Critically evaluating whether debt is always cheaper than equity so companies must
go for maximum debt to minimize their cost of capital.............................................................9
Part C:.......................................................................................................................................12
i) Providing relevant cash flows for the proposed project:......................................................12
ii) Calculating the investment appraisal techniques:................................................................13
iii) Critically evaluating the project evaluation decisions make or break of company:...........17
References and Bibliography:..................................................................................................19
FINANCIAL MANAGEMENT AND CONTROL
2
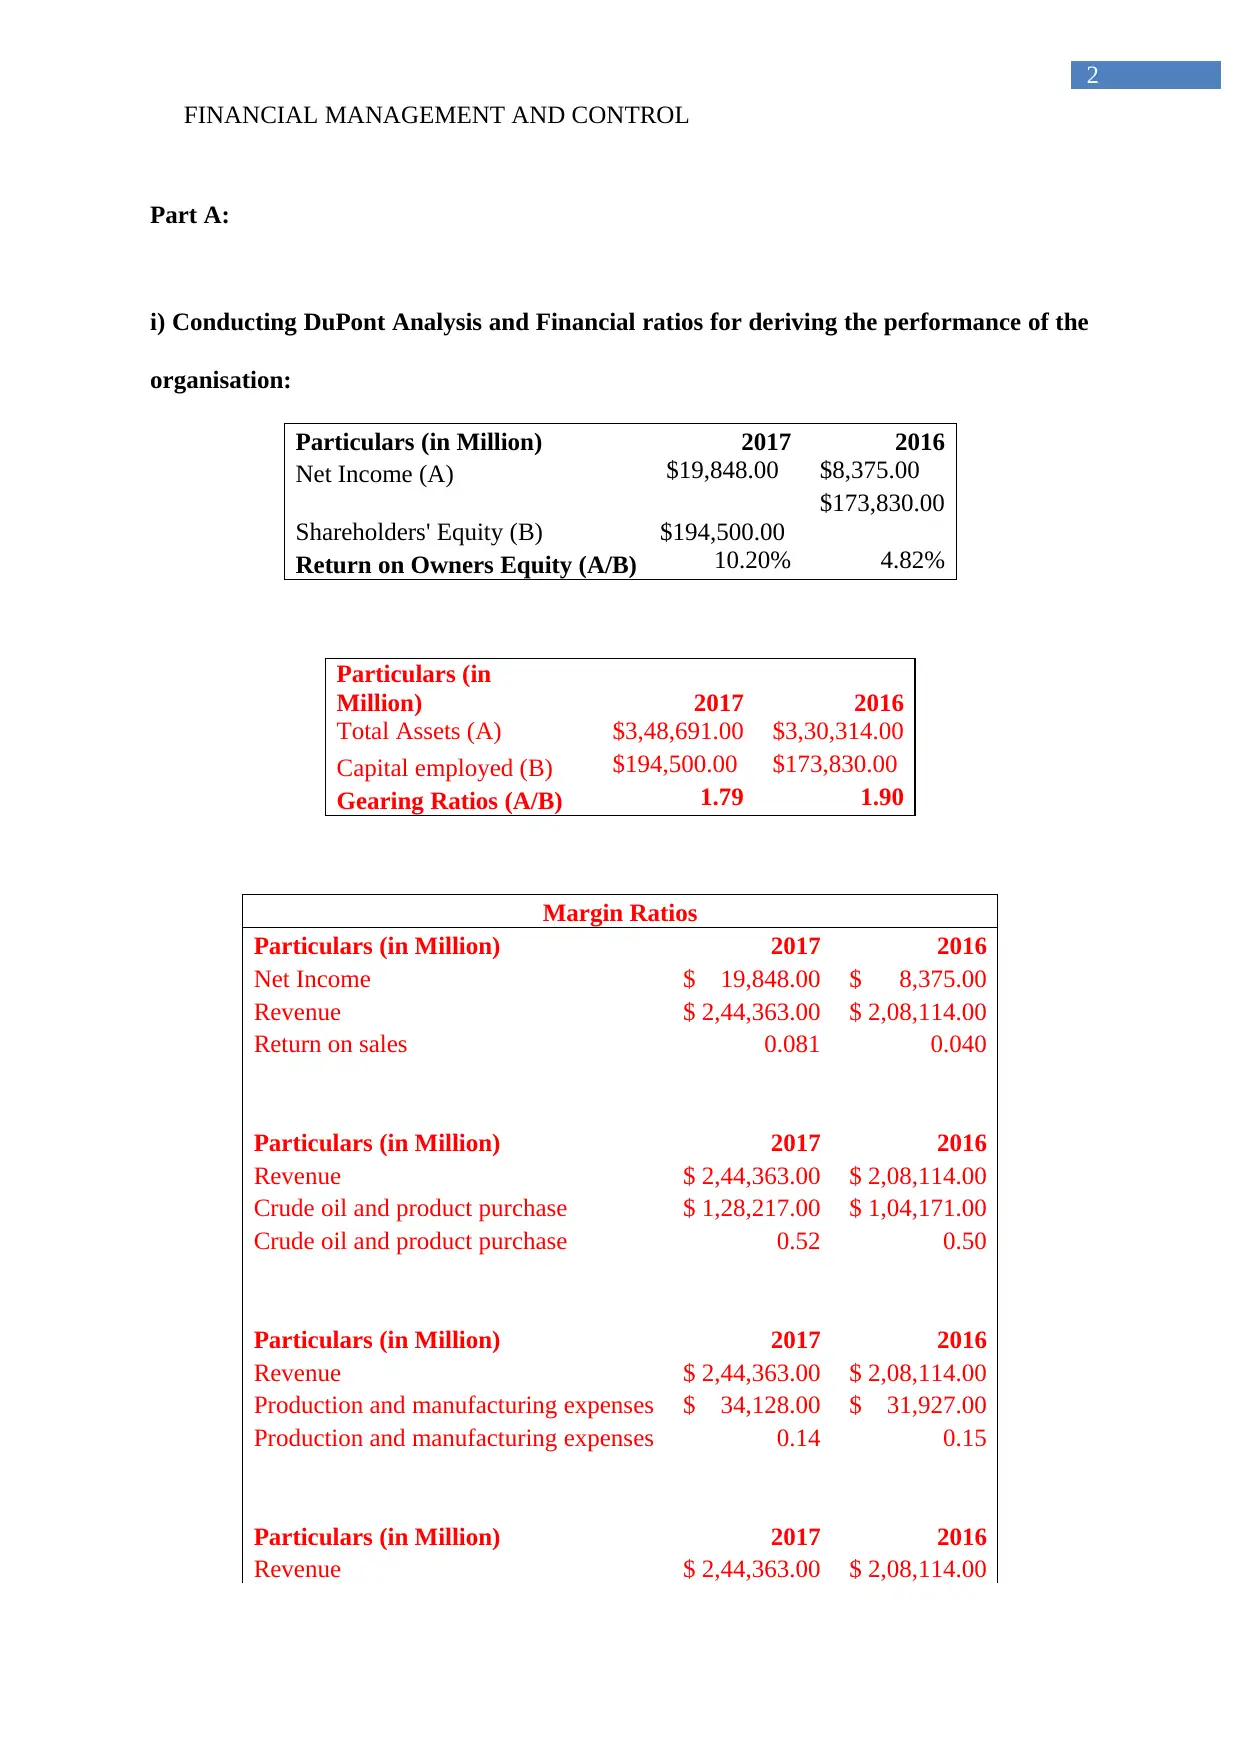
Part A:
i) Conducting DuPont Analysis and Financial ratios for deriving the performance of the
organisation:
Particulars (in Million) 2017 2016
Net Income (A) $19,848.00 $8,375.00
Shareholders' Equity (B) $194,500.00
$173,830.00
Return on Owners Equity (A/B) 10.20% 4.82%
Particulars (in
Million) 2017 2016
Total Assets (A) $3,48,691.00 $3,30,314.00
Capital employed (B) $194,500.00 $173,830.00
Gearing Ratios (A/B) 1.79 1.90
Margin Ratios
Particulars (in Million) 2017 2016
Net Income $ 19,848.00 $ 8,375.00
Revenue $ 2,44,363.00 $ 2,08,114.00
Return on sales 0.081 0.040
Particulars (in Million) 2017 2016
Revenue $ 2,44,363.00 $ 2,08,114.00
Crude oil and product purchase $ 1,28,217.00 $ 1,04,171.00
Crude oil and product purchase 0.52 0.50
Particulars (in Million) 2017 2016
Revenue $ 2,44,363.00 $ 2,08,114.00
Production and manufacturing expenses $ 34,128.00 $ 31,927.00
Production and manufacturing expenses 0.14 0.15
Particulars (in Million) 2017 2016
Revenue $ 2,44,363.00 $ 2,08,114.00
2
Part A:
i) Conducting DuPont Analysis and Financial ratios for deriving the performance of the
organisation:
Particulars (in Million) 2017 2016
Net Income (A) $19,848.00 $8,375.00
Shareholders' Equity (B) $194,500.00
$173,830.00
Return on Owners Equity (A/B) 10.20% 4.82%
Particulars (in
Million) 2017 2016
Total Assets (A) $3,48,691.00 $3,30,314.00
Capital employed (B) $194,500.00 $173,830.00
Gearing Ratios (A/B) 1.79 1.90
Margin Ratios
Particulars (in Million) 2017 2016
Net Income $ 19,848.00 $ 8,375.00
Revenue $ 2,44,363.00 $ 2,08,114.00
Return on sales 0.081 0.040
Particulars (in Million) 2017 2016
Revenue $ 2,44,363.00 $ 2,08,114.00
Crude oil and product purchase $ 1,28,217.00 $ 1,04,171.00
Crude oil and product purchase 0.52 0.50
Particulars (in Million) 2017 2016
Revenue $ 2,44,363.00 $ 2,08,114.00
Production and manufacturing expenses $ 34,128.00 $ 31,927.00
Production and manufacturing expenses 0.14 0.15
Particulars (in Million) 2017 2016
Revenue $ 2,44,363.00 $ 2,08,114.00
⊘ This is a preview!⊘
Do you want full access?
Subscribe today to unlock all pages.
Trusted by 1+ million students worldwide
FINANCIAL MANAGEMENT AND CONTROL
3
Depreciation and depletion 19893 22308
Depreciation and depletion 0.08 0.11
Particulars (in Million) 2017 2016
Revenue $ 2,44,363.00 $ 2,08,114.00
Total expenses $ 2,25,689.00 $ 2,00,145.00
Total expenses 1.08 1.04
Particulars (in Million) 2017 2016
Revenue $ 2,44,363.00 $ 2,08,114.00
Other taxes and duties $ 30,104.00 $ 29,020.00
Other taxes and duties 0.12 0.14
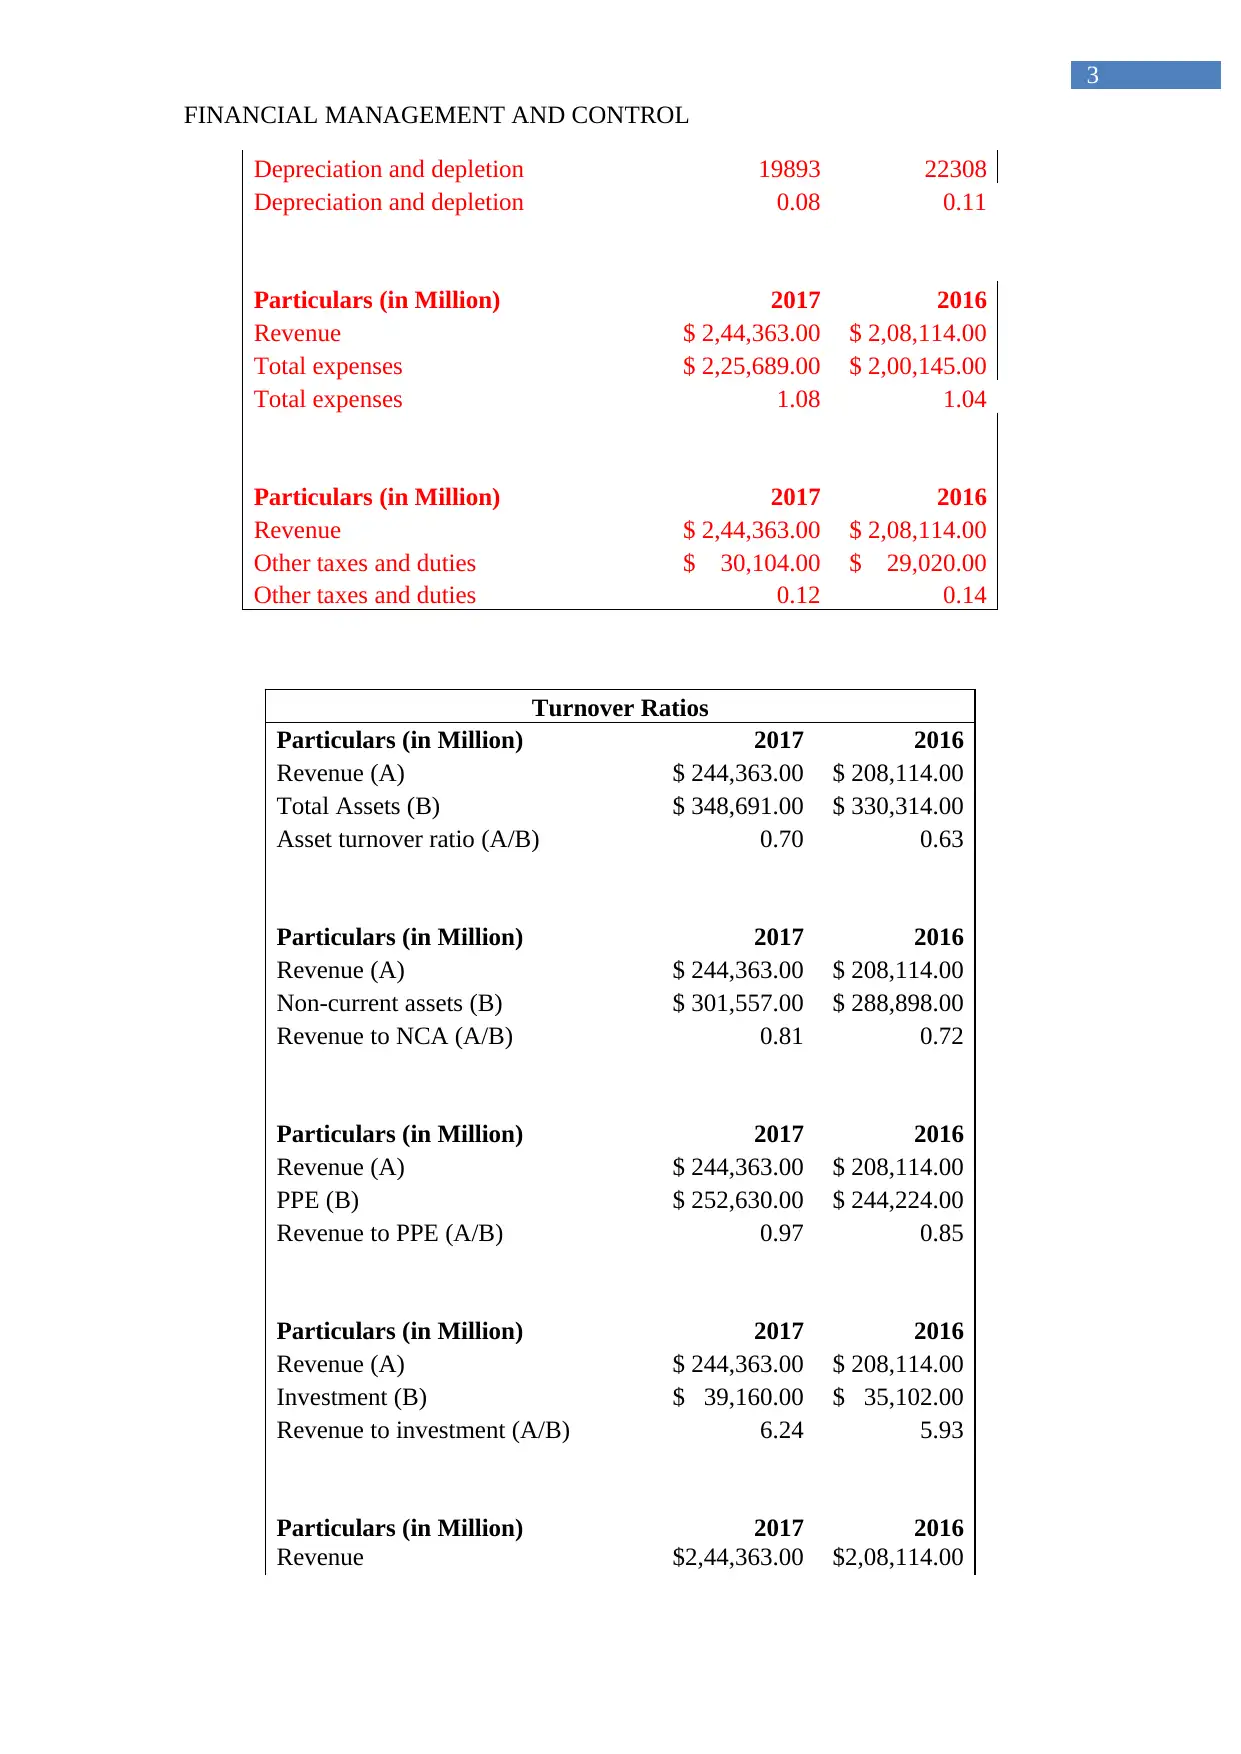
Turnover Ratios
Particulars (in Million) 2017 2016
Revenue (A) $ 244,363.00 $ 208,114.00
Total Assets (B) $ 348,691.00 $ 330,314.00
Asset turnover ratio (A/B) 0.70 0.63
Particulars (in Million) 2017 2016
Revenue (A) $ 244,363.00 $ 208,114.00
Non-current assets (B) $ 301,557.00 $ 288,898.00
Revenue to NCA (A/B) 0.81 0.72
Particulars (in Million) 2017 2016
Revenue (A) $ 244,363.00 $ 208,114.00
PPE (B) $ 252,630.00 $ 244,224.00
Revenue to PPE (A/B) 0.97 0.85
Particulars (in Million) 2017 2016
Revenue (A) $ 244,363.00 $ 208,114.00
Investment (B) $ 39,160.00 $ 35,102.00
Revenue to investment (A/B) 6.24 5.93
Particulars (in Million) 2017 2016
Revenue $2,44,363.00 $2,08,114.00
3
Depreciation and depletion 19893 22308
Depreciation and depletion 0.08 0.11
Particulars (in Million) 2017 2016
Revenue $ 2,44,363.00 $ 2,08,114.00
Total expenses $ 2,25,689.00 $ 2,00,145.00
Total expenses 1.08 1.04
Particulars (in Million) 2017 2016
Revenue $ 2,44,363.00 $ 2,08,114.00
Other taxes and duties $ 30,104.00 $ 29,020.00
Other taxes and duties 0.12 0.14
Turnover Ratios
Particulars (in Million) 2017 2016
Revenue (A) $ 244,363.00 $ 208,114.00
Total Assets (B) $ 348,691.00 $ 330,314.00
Asset turnover ratio (A/B) 0.70 0.63
Particulars (in Million) 2017 2016
Revenue (A) $ 244,363.00 $ 208,114.00
Non-current assets (B) $ 301,557.00 $ 288,898.00
Revenue to NCA (A/B) 0.81 0.72
Particulars (in Million) 2017 2016
Revenue (A) $ 244,363.00 $ 208,114.00
PPE (B) $ 252,630.00 $ 244,224.00
Revenue to PPE (A/B) 0.97 0.85
Particulars (in Million) 2017 2016
Revenue (A) $ 244,363.00 $ 208,114.00
Investment (B) $ 39,160.00 $ 35,102.00
Revenue to investment (A/B) 6.24 5.93
Particulars (in Million) 2017 2016
Revenue $2,44,363.00 $2,08,114.00
Paraphrase This Document
Need a fresh take? Get an instant paraphrase of this document with our AI Paraphraser
FINANCIAL MANAGEMENT AND CONTROL
4
Crude oil, products and merchandise $12,871.00 $10,877.00
Revenue to other assets 18.99 19.13
Particulars (in Million) 2017 2016
Revenue (A) $ 244,363.00 $ 208,114.00
Current assets (B) $ 47,134.00 $ 41,416.00
Revenue to CA (A/B) 5.18 5.02
Particulars (in Million) 2017 2016
Revenue $2,44,363.00 $2,08,114.00
Materials and supply $4,121.00 $4,203.00
Revenue to MS 59.30 49.52
Particulars (in Million) 2017 2016
Revenue (A) $ 244,363.00 $ 208,114.00
Accounts receivable (B) $ 25,597.00 $ 21,394.00
Revenue to AR (A/B) 9.55 9.73
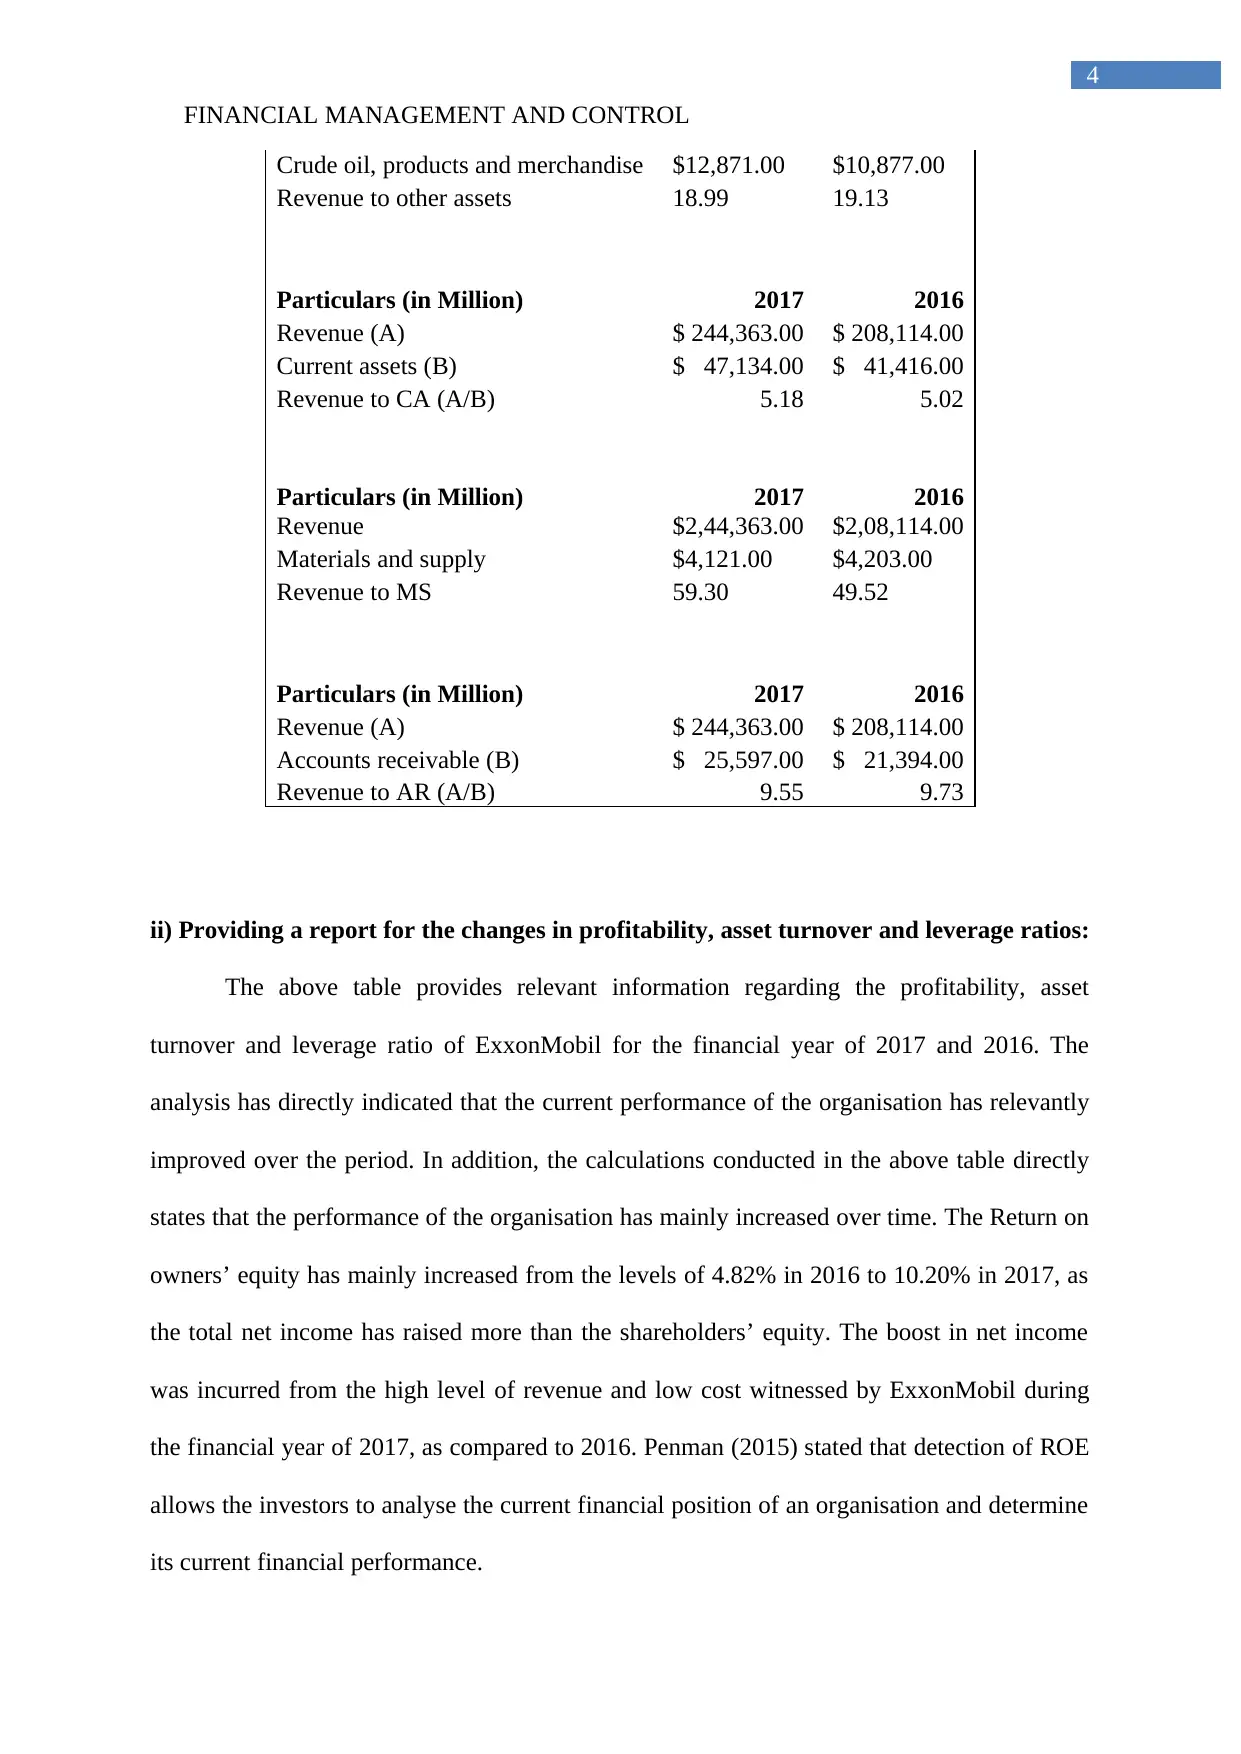
ii) Providing a report for the changes in profitability, asset turnover and leverage ratios:
The above table provides relevant information regarding the profitability, asset
turnover and leverage ratio of ExxonMobil for the financial year of 2017 and 2016. The
analysis has directly indicated that the current performance of the organisation has relevantly
improved over the period. In addition, the calculations conducted in the above table directly
states that the performance of the organisation has mainly increased over time. The Return on
owners’ equity has mainly increased from the levels of 4.82% in 2016 to 10.20% in 2017, as
the total net income has raised more than the shareholders’ equity. The boost in net income
was incurred from the high level of revenue and low cost witnessed by ExxonMobil during
the financial year of 2017, as compared to 2016. Penman (2015) stated that detection of ROE
allows the investors to analyse the current financial position of an organisation and determine
its current financial performance.
4
Crude oil, products and merchandise $12,871.00 $10,877.00
Revenue to other assets 18.99 19.13
Particulars (in Million) 2017 2016
Revenue (A) $ 244,363.00 $ 208,114.00
Current assets (B) $ 47,134.00 $ 41,416.00
Revenue to CA (A/B) 5.18 5.02
Particulars (in Million) 2017 2016
Revenue $2,44,363.00 $2,08,114.00
Materials and supply $4,121.00 $4,203.00
Revenue to MS 59.30 49.52
Particulars (in Million) 2017 2016
Revenue (A) $ 244,363.00 $ 208,114.00
Accounts receivable (B) $ 25,597.00 $ 21,394.00
Revenue to AR (A/B) 9.55 9.73
ii) Providing a report for the changes in profitability, asset turnover and leverage ratios:
The above table provides relevant information regarding the profitability, asset
turnover and leverage ratio of ExxonMobil for the financial year of 2017 and 2016. The
analysis has directly indicated that the current performance of the organisation has relevantly
improved over the period. In addition, the calculations conducted in the above table directly
states that the performance of the organisation has mainly increased over time. The Return on
owners’ equity has mainly increased from the levels of 4.82% in 2016 to 10.20% in 2017, as
the total net income has raised more than the shareholders’ equity. The boost in net income
was incurred from the high level of revenue and low cost witnessed by ExxonMobil during
the financial year of 2017, as compared to 2016. Penman (2015) stated that detection of ROE
allows the investors to analyse the current financial position of an organisation and determine
its current financial performance.
FINANCIAL MANAGEMENT AND CONTROL
5
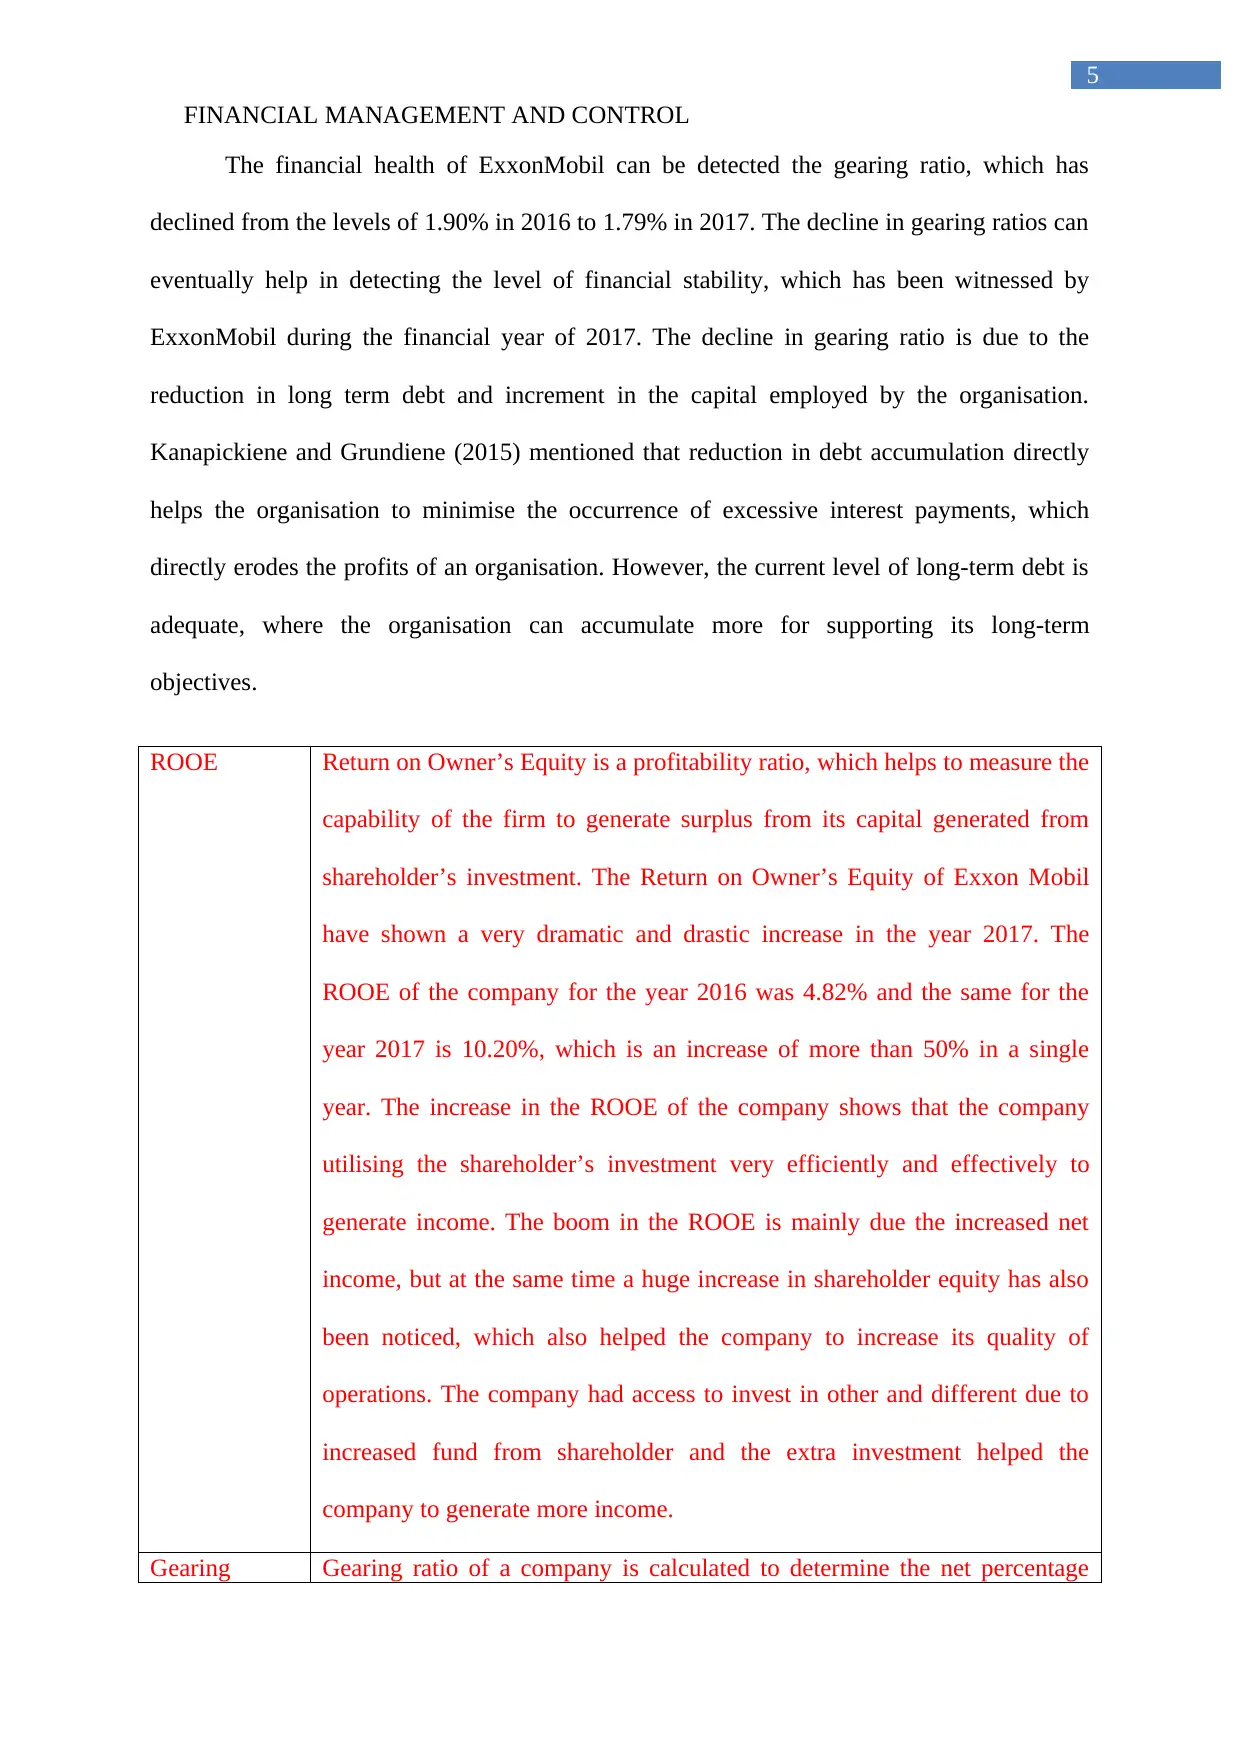
The financial health of ExxonMobil can be detected the gearing ratio, which has
declined from the levels of 1.90% in 2016 to 1.79% in 2017. The decline in gearing ratios can
eventually help in detecting the level of financial stability, which has been witnessed by
ExxonMobil during the financial year of 2017. The decline in gearing ratio is due to the
reduction in long term debt and increment in the capital employed by the organisation.
Kanapickiene and Grundiene (2015) mentioned that reduction in debt accumulation directly
helps the organisation to minimise the occurrence of excessive interest payments, which
directly erodes the profits of an organisation. However, the current level of long-term debt is
adequate, where the organisation can accumulate more for supporting its long-term
objectives.
ROOE Return on Owner’s Equity is a profitability ratio, which helps to measure the
capability of the firm to generate surplus from its capital generated from
shareholder’s investment. The Return on Owner’s Equity of Exxon Mobil
have shown a very dramatic and drastic increase in the year 2017. The
ROOE of the company for the year 2016 was 4.82% and the same for the
year 2017 is 10.20%, which is an increase of more than 50% in a single
year. The increase in the ROOE of the company shows that the company
utilising the shareholder’s investment very efficiently and effectively to
generate income. The boom in the ROOE is mainly due the increased net
income, but at the same time a huge increase in shareholder equity has also
been noticed, which also helped the company to increase its quality of
operations. The company had access to invest in other and different due to
increased fund from shareholder and the extra investment helped the
company to generate more income.
Gearing Gearing ratio of a company is calculated to determine the net percentage
5
The financial health of ExxonMobil can be detected the gearing ratio, which has
declined from the levels of 1.90% in 2016 to 1.79% in 2017. The decline in gearing ratios can
eventually help in detecting the level of financial stability, which has been witnessed by
ExxonMobil during the financial year of 2017. The decline in gearing ratio is due to the
reduction in long term debt and increment in the capital employed by the organisation.
Kanapickiene and Grundiene (2015) mentioned that reduction in debt accumulation directly
helps the organisation to minimise the occurrence of excessive interest payments, which
directly erodes the profits of an organisation. However, the current level of long-term debt is
adequate, where the organisation can accumulate more for supporting its long-term
objectives.
ROOE Return on Owner’s Equity is a profitability ratio, which helps to measure the
capability of the firm to generate surplus from its capital generated from
shareholder’s investment. The Return on Owner’s Equity of Exxon Mobil
have shown a very dramatic and drastic increase in the year 2017. The
ROOE of the company for the year 2016 was 4.82% and the same for the
year 2017 is 10.20%, which is an increase of more than 50% in a single
year. The increase in the ROOE of the company shows that the company
utilising the shareholder’s investment very efficiently and effectively to
generate income. The boom in the ROOE is mainly due the increased net
income, but at the same time a huge increase in shareholder equity has also
been noticed, which also helped the company to increase its quality of
operations. The company had access to invest in other and different due to
increased fund from shareholder and the extra investment helped the
company to generate more income.
Gearing Gearing ratio of a company is calculated to determine the net percentage
⊘ This is a preview!⊘
Do you want full access?
Subscribe today to unlock all pages.
Trusted by 1+ million students worldwide
FINANCIAL MANAGEMENT AND CONTROL
6
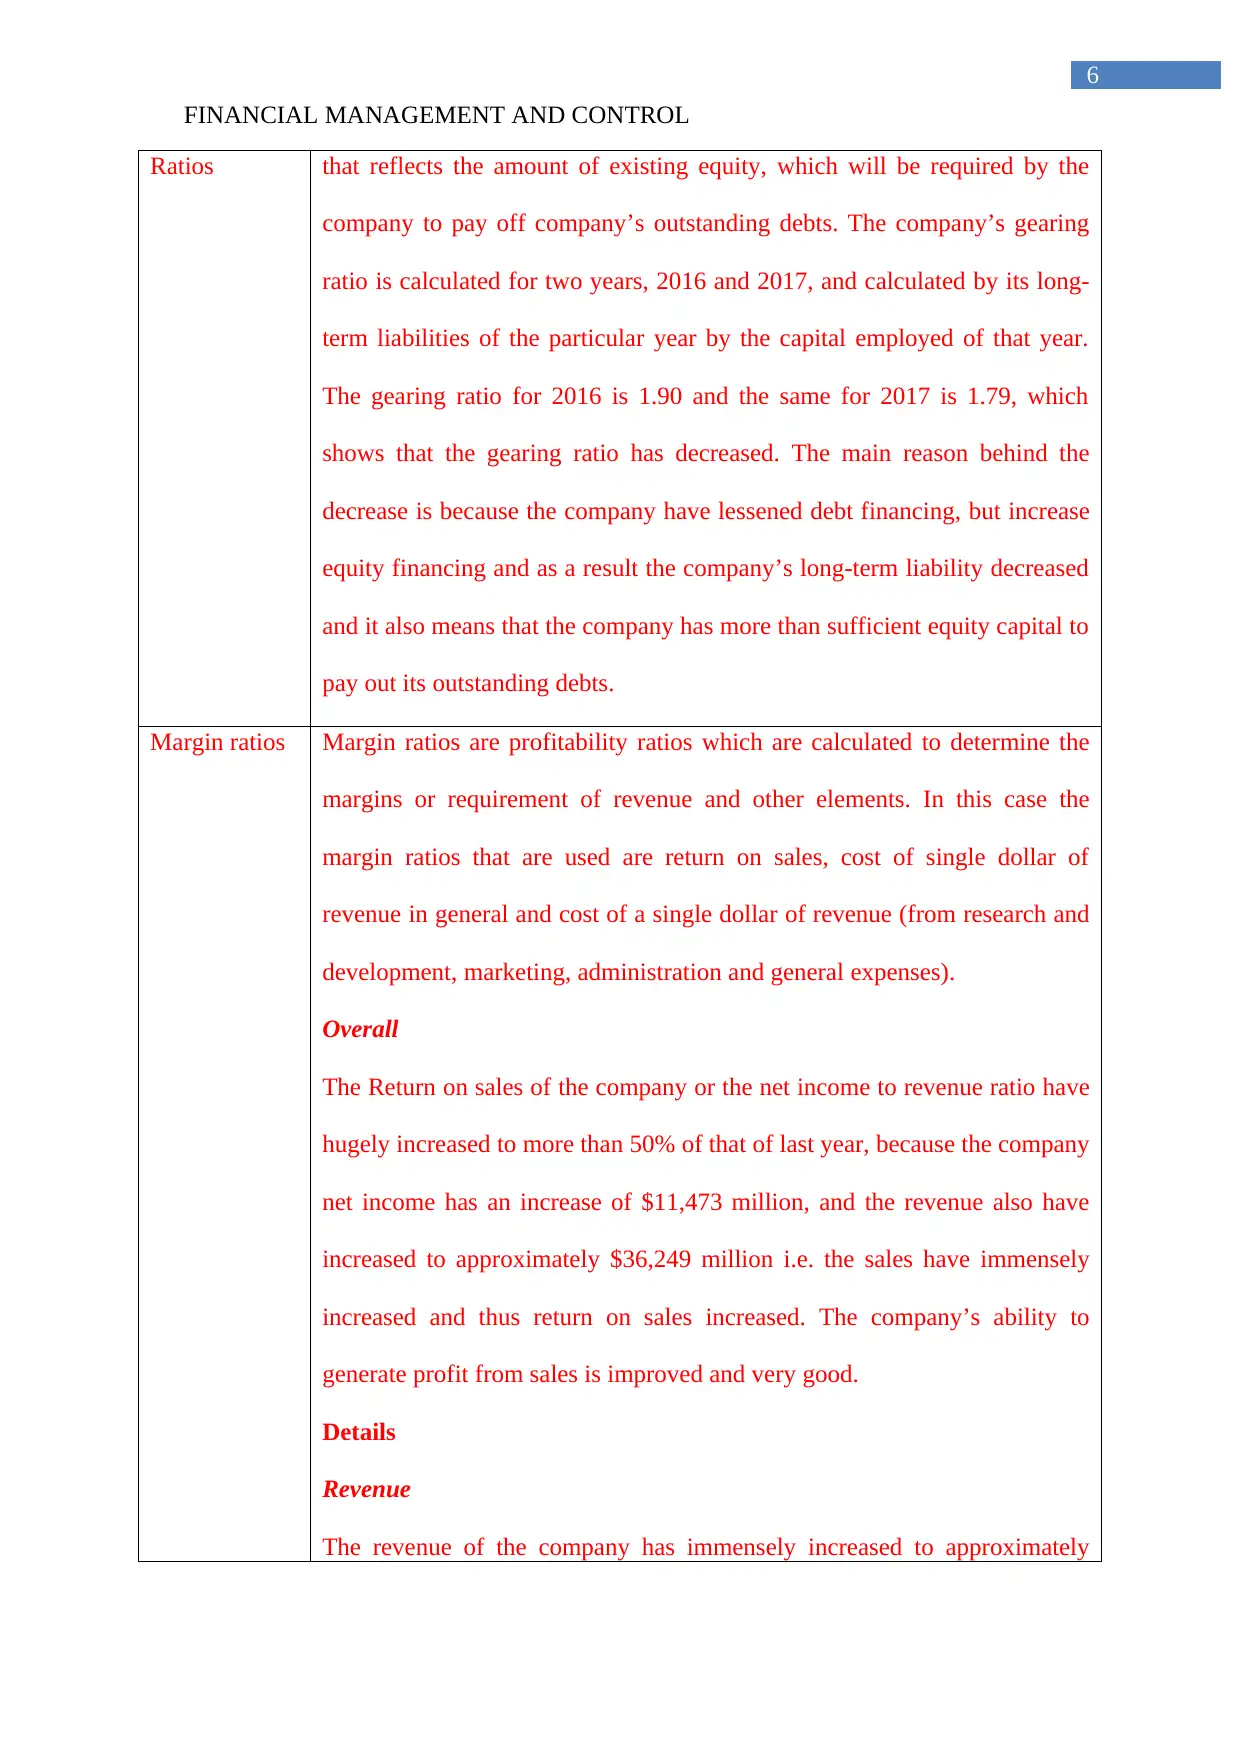
Ratios that reflects the amount of existing equity, which will be required by the
company to pay off company’s outstanding debts. The company’s gearing
ratio is calculated for two years, 2016 and 2017, and calculated by its long-
term liabilities of the particular year by the capital employed of that year.
The gearing ratio for 2016 is 1.90 and the same for 2017 is 1.79, which
shows that the gearing ratio has decreased. The main reason behind the
decrease is because the company have lessened debt financing, but increase
equity financing and as a result the company’s long-term liability decreased
and it also means that the company has more than sufficient equity capital to
pay out its outstanding debts.
Margin ratios Margin ratios are profitability ratios which are calculated to determine the
margins or requirement of revenue and other elements. In this case the
margin ratios that are used are return on sales, cost of single dollar of
revenue in general and cost of a single dollar of revenue (from research and
development, marketing, administration and general expenses).
Overall
The Return on sales of the company or the net income to revenue ratio have
hugely increased to more than 50% of that of last year, because the company
net income has an increase of $11,473 million, and the revenue also have
increased to approximately $36,249 million i.e. the sales have immensely
increased and thus return on sales increased. The company’s ability to
generate profit from sales is improved and very good.
Details
Revenue
The revenue of the company has immensely increased to approximately
6
Ratios that reflects the amount of existing equity, which will be required by the
company to pay off company’s outstanding debts. The company’s gearing
ratio is calculated for two years, 2016 and 2017, and calculated by its long-
term liabilities of the particular year by the capital employed of that year.
The gearing ratio for 2016 is 1.90 and the same for 2017 is 1.79, which
shows that the gearing ratio has decreased. The main reason behind the
decrease is because the company have lessened debt financing, but increase
equity financing and as a result the company’s long-term liability decreased
and it also means that the company has more than sufficient equity capital to
pay out its outstanding debts.
Margin ratios Margin ratios are profitability ratios which are calculated to determine the
margins or requirement of revenue and other elements. In this case the
margin ratios that are used are return on sales, cost of single dollar of
revenue in general and cost of a single dollar of revenue (from research and
development, marketing, administration and general expenses).
Overall
The Return on sales of the company or the net income to revenue ratio have
hugely increased to more than 50% of that of last year, because the company
net income has an increase of $11,473 million, and the revenue also have
increased to approximately $36,249 million i.e. the sales have immensely
increased and thus return on sales increased. The company’s ability to
generate profit from sales is improved and very good.
Details
Revenue
The revenue of the company has immensely increased to approximately
Paraphrase This Document
Need a fresh take? Get an instant paraphrase of this document with our AI Paraphraser
FINANCIAL MANAGEMENT AND CONTROL
7
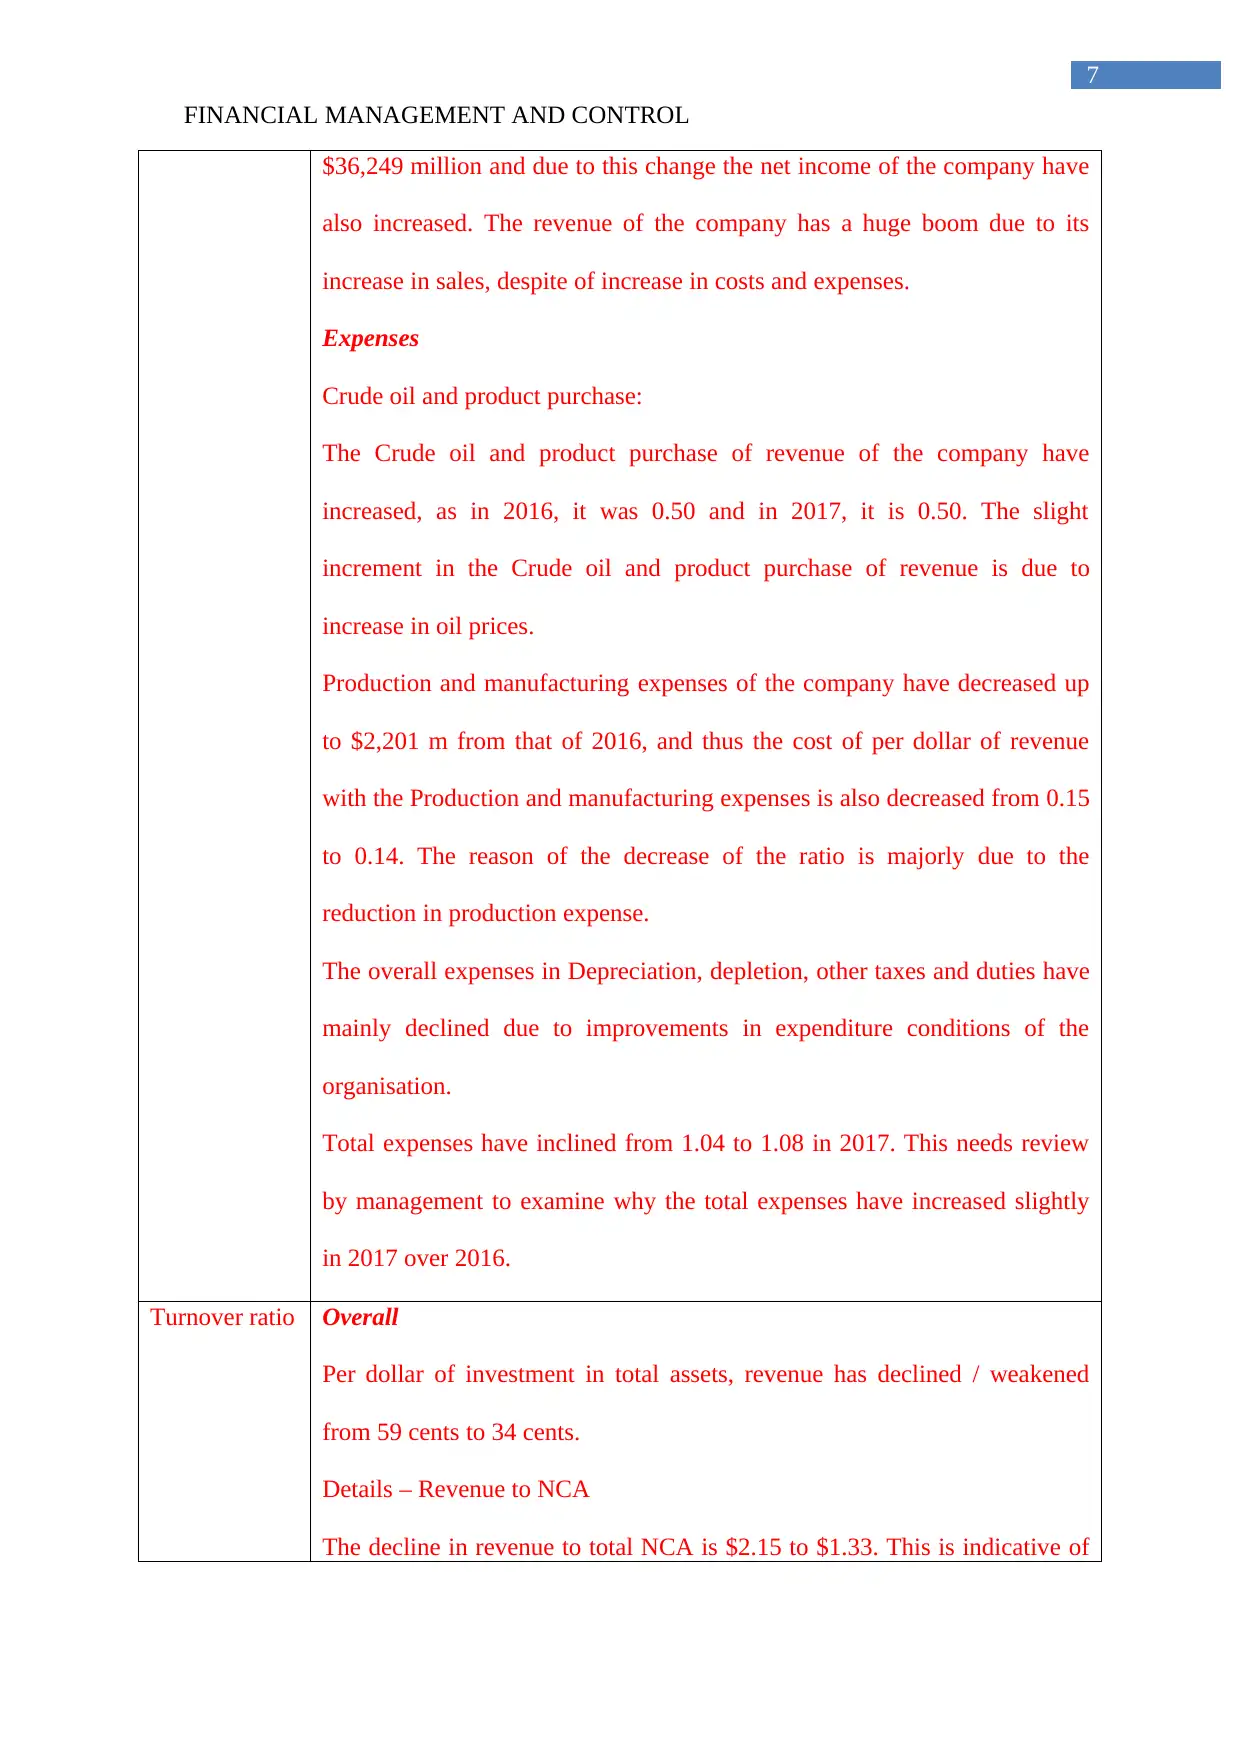
$36,249 million and due to this change the net income of the company have
also increased. The revenue of the company has a huge boom due to its
increase in sales, despite of increase in costs and expenses.
Expenses
Crude oil and product purchase:
The Crude oil and product purchase of revenue of the company have
increased, as in 2016, it was 0.50 and in 2017, it is 0.50. The slight
increment in the Crude oil and product purchase of revenue is due to
increase in oil prices.
Production and manufacturing expenses of the company have decreased up
to $2,201 m from that of 2016, and thus the cost of per dollar of revenue
with the Production and manufacturing expenses is also decreased from 0.15
to 0.14. The reason of the decrease of the ratio is majorly due to the
reduction in production expense.
The overall expenses in Depreciation, depletion, other taxes and duties have
mainly declined due to improvements in expenditure conditions of the
organisation.
Total expenses have inclined from 1.04 to 1.08 in 2017. This needs review
by management to examine why the total expenses have increased slightly
in 2017 over 2016.
Turnover ratio Overall
Per dollar of investment in total assets, revenue has declined / weakened
from 59 cents to 34 cents.
Details – Revenue to NCA
The decline in revenue to total NCA is $2.15 to $1.33. This is indicative of
7
$36,249 million and due to this change the net income of the company have
also increased. The revenue of the company has a huge boom due to its
increase in sales, despite of increase in costs and expenses.
Expenses
Crude oil and product purchase:
The Crude oil and product purchase of revenue of the company have
increased, as in 2016, it was 0.50 and in 2017, it is 0.50. The slight
increment in the Crude oil and product purchase of revenue is due to
increase in oil prices.
Production and manufacturing expenses of the company have decreased up
to $2,201 m from that of 2016, and thus the cost of per dollar of revenue
with the Production and manufacturing expenses is also decreased from 0.15
to 0.14. The reason of the decrease of the ratio is majorly due to the
reduction in production expense.
The overall expenses in Depreciation, depletion, other taxes and duties have
mainly declined due to improvements in expenditure conditions of the
organisation.
Total expenses have inclined from 1.04 to 1.08 in 2017. This needs review
by management to examine why the total expenses have increased slightly
in 2017 over 2016.
Turnover ratio Overall
Per dollar of investment in total assets, revenue has declined / weakened
from 59 cents to 34 cents.
Details – Revenue to NCA
The decline in revenue to total NCA is $2.15 to $1.33. This is indicative of
FINANCIAL MANAGEMENT AND CONTROL
8
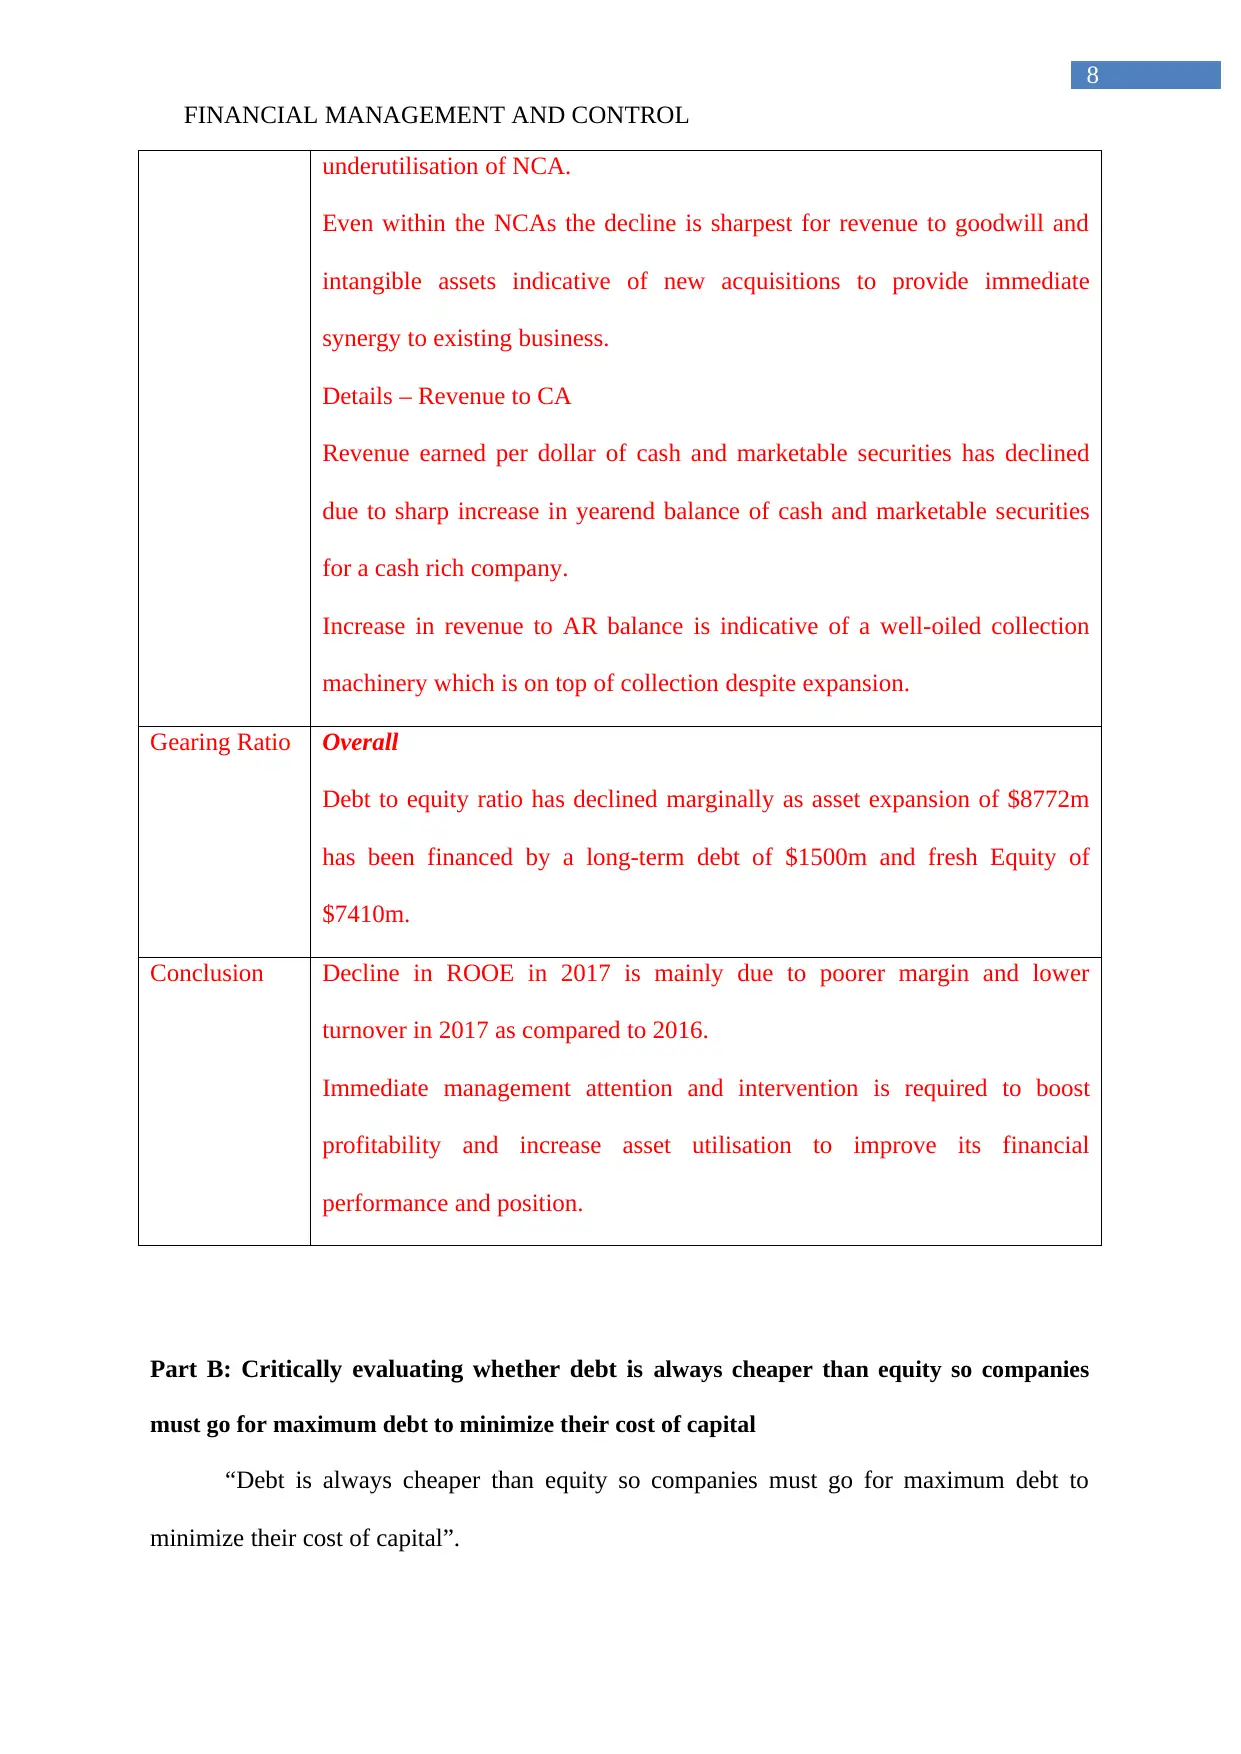
underutilisation of NCA.
Even within the NCAs the decline is sharpest for revenue to goodwill and
intangible assets indicative of new acquisitions to provide immediate
synergy to existing business.
Details – Revenue to CA
Revenue earned per dollar of cash and marketable securities has declined
due to sharp increase in yearend balance of cash and marketable securities
for a cash rich company.
Increase in revenue to AR balance is indicative of a well-oiled collection
machinery which is on top of collection despite expansion.
Gearing Ratio Overall
Debt to equity ratio has declined marginally as asset expansion of $8772m
has been financed by a long-term debt of $1500m and fresh Equity of
$7410m.
Conclusion Decline in ROOE in 2017 is mainly due to poorer margin and lower
turnover in 2017 as compared to 2016.
Immediate management attention and intervention is required to boost
profitability and increase asset utilisation to improve its financial
performance and position.
Part B: Critically evaluating whether debt is always cheaper than equity so companies
must go for maximum debt to minimize their cost of capital
“Debt is always cheaper than equity so companies must go for maximum debt to
minimize their cost of capital”.
8
underutilisation of NCA.
Even within the NCAs the decline is sharpest for revenue to goodwill and
intangible assets indicative of new acquisitions to provide immediate
synergy to existing business.
Details – Revenue to CA
Revenue earned per dollar of cash and marketable securities has declined
due to sharp increase in yearend balance of cash and marketable securities
for a cash rich company.
Increase in revenue to AR balance is indicative of a well-oiled collection
machinery which is on top of collection despite expansion.
Gearing Ratio Overall
Debt to equity ratio has declined marginally as asset expansion of $8772m
has been financed by a long-term debt of $1500m and fresh Equity of
$7410m.
Conclusion Decline in ROOE in 2017 is mainly due to poorer margin and lower
turnover in 2017 as compared to 2016.
Immediate management attention and intervention is required to boost
profitability and increase asset utilisation to improve its financial
performance and position.
Part B: Critically evaluating whether debt is always cheaper than equity so companies
must go for maximum debt to minimize their cost of capital
“Debt is always cheaper than equity so companies must go for maximum debt to
minimize their cost of capital”.
⊘ This is a preview!⊘
Do you want full access?
Subscribe today to unlock all pages.
Trusted by 1+ million students worldwide
FINANCIAL MANAGEMENT AND CONTROL
9
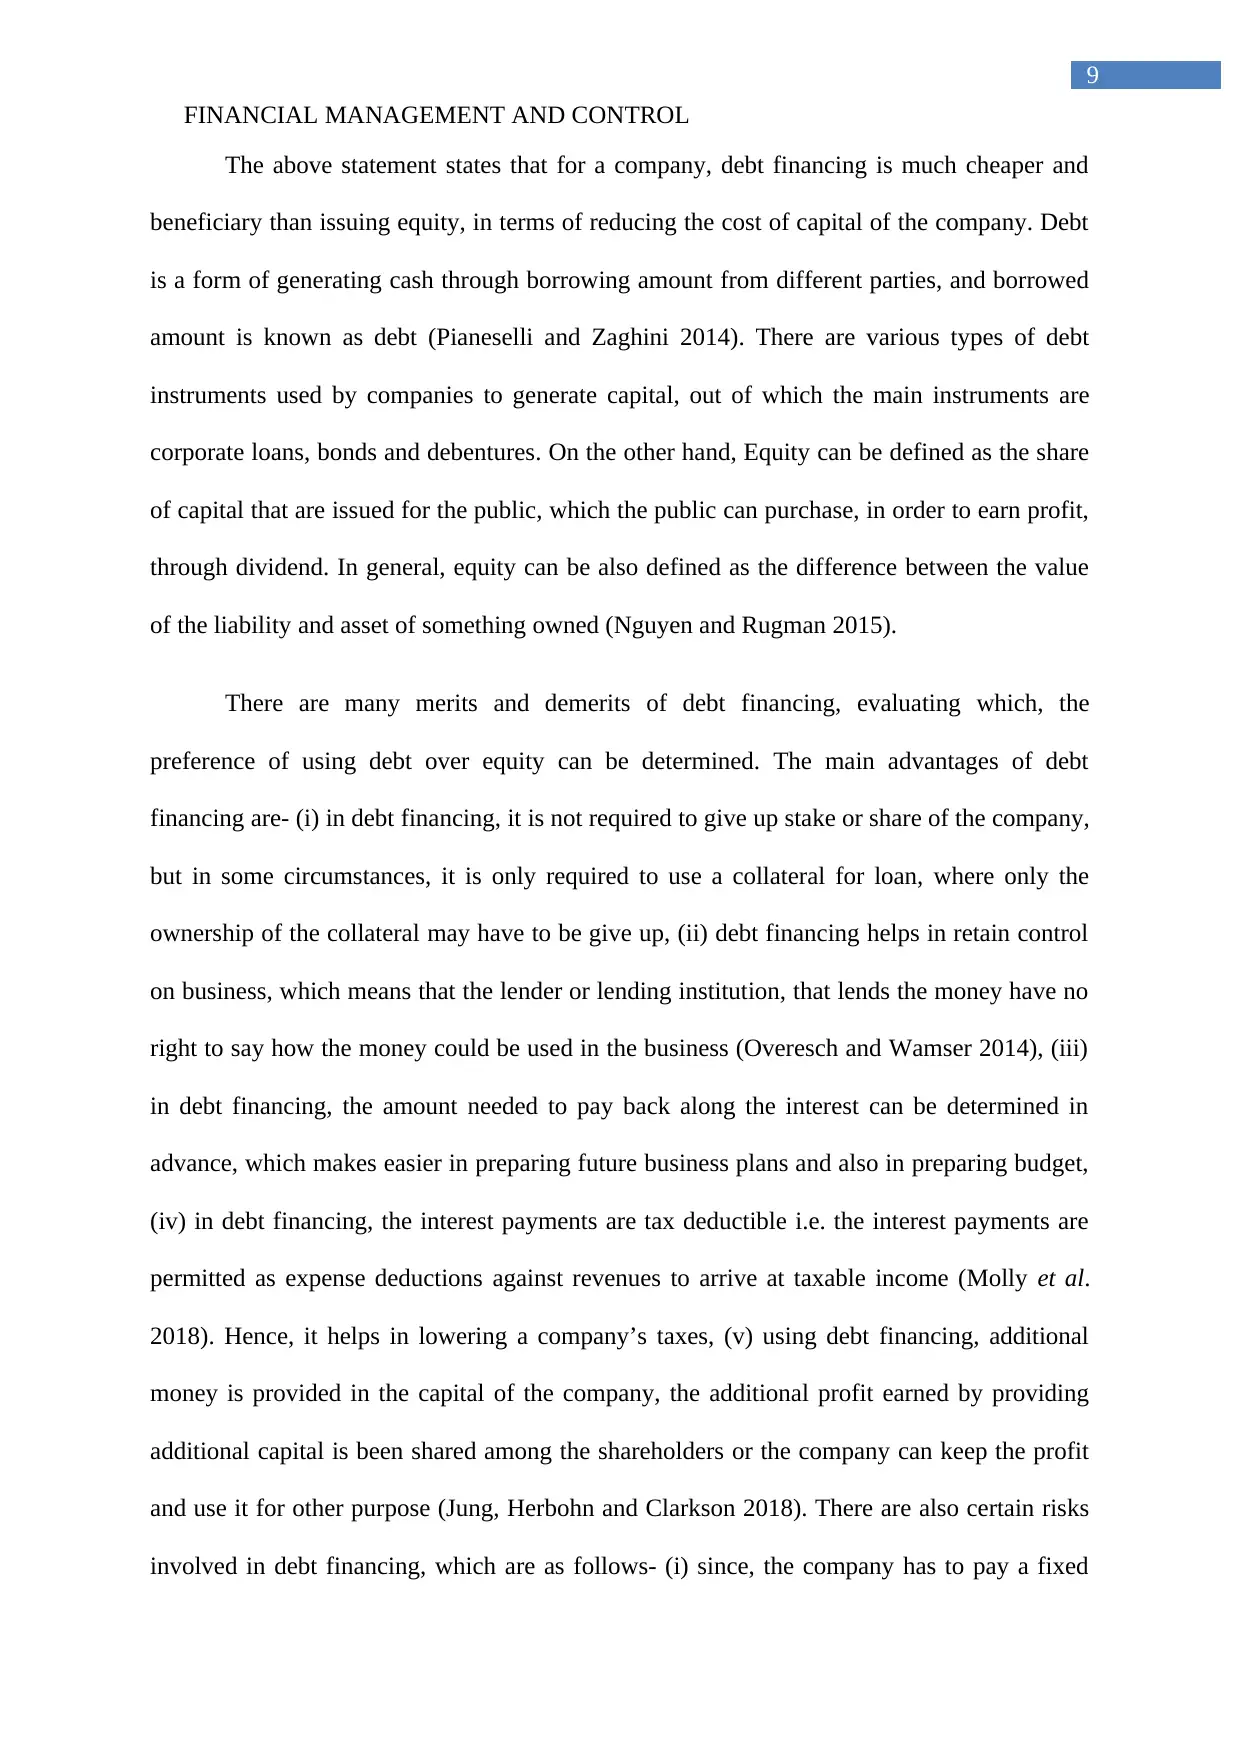
The above statement states that for a company, debt financing is much cheaper and
beneficiary than issuing equity, in terms of reducing the cost of capital of the company. Debt
is a form of generating cash through borrowing amount from different parties, and borrowed
amount is known as debt (Pianeselli and Zaghini 2014). There are various types of debt
instruments used by companies to generate capital, out of which the main instruments are
corporate loans, bonds and debentures. On the other hand, Equity can be defined as the share
of capital that are issued for the public, which the public can purchase, in order to earn profit,
through dividend. In general, equity can be also defined as the difference between the value
of the liability and asset of something owned (Nguyen and Rugman 2015).
There are many merits and demerits of debt financing, evaluating which, the
preference of using debt over equity can be determined. The main advantages of debt
financing are- (i) in debt financing, it is not required to give up stake or share of the company,
but in some circumstances, it is only required to use a collateral for loan, where only the
ownership of the collateral may have to be give up, (ii) debt financing helps in retain control
on business, which means that the lender or lending institution, that lends the money have no
right to say how the money could be used in the business (Overesch and Wamser 2014), (iii)
in debt financing, the amount needed to pay back along the interest can be determined in
advance, which makes easier in preparing future business plans and also in preparing budget,
(iv) in debt financing, the interest payments are tax deductible i.e. the interest payments are
permitted as expense deductions against revenues to arrive at taxable income (Molly et al.
2018). Hence, it helps in lowering a company’s taxes, (v) using debt financing, additional
money is provided in the capital of the company, the additional profit earned by providing
additional capital is been shared among the shareholders or the company can keep the profit
and use it for other purpose (Jung, Herbohn and Clarkson 2018). There are also certain risks
involved in debt financing, which are as follows- (i) since, the company has to pay a fixed
9
The above statement states that for a company, debt financing is much cheaper and
beneficiary than issuing equity, in terms of reducing the cost of capital of the company. Debt
is a form of generating cash through borrowing amount from different parties, and borrowed
amount is known as debt (Pianeselli and Zaghini 2014). There are various types of debt
instruments used by companies to generate capital, out of which the main instruments are
corporate loans, bonds and debentures. On the other hand, Equity can be defined as the share
of capital that are issued for the public, which the public can purchase, in order to earn profit,
through dividend. In general, equity can be also defined as the difference between the value
of the liability and asset of something owned (Nguyen and Rugman 2015).
There are many merits and demerits of debt financing, evaluating which, the
preference of using debt over equity can be determined. The main advantages of debt
financing are- (i) in debt financing, it is not required to give up stake or share of the company,
but in some circumstances, it is only required to use a collateral for loan, where only the
ownership of the collateral may have to be give up, (ii) debt financing helps in retain control
on business, which means that the lender or lending institution, that lends the money have no
right to say how the money could be used in the business (Overesch and Wamser 2014), (iii)
in debt financing, the amount needed to pay back along the interest can be determined in
advance, which makes easier in preparing future business plans and also in preparing budget,
(iv) in debt financing, the interest payments are tax deductible i.e. the interest payments are
permitted as expense deductions against revenues to arrive at taxable income (Molly et al.
2018). Hence, it helps in lowering a company’s taxes, (v) using debt financing, additional
money is provided in the capital of the company, the additional profit earned by providing
additional capital is been shared among the shareholders or the company can keep the profit
and use it for other purpose (Jung, Herbohn and Clarkson 2018). There are also certain risks
involved in debt financing, which are as follows- (i) since, the company has to pay a fixed
Paraphrase This Document
Need a fresh take? Get an instant paraphrase of this document with our AI Paraphraser
FINANCIAL MANAGEMENT AND CONTROL
10
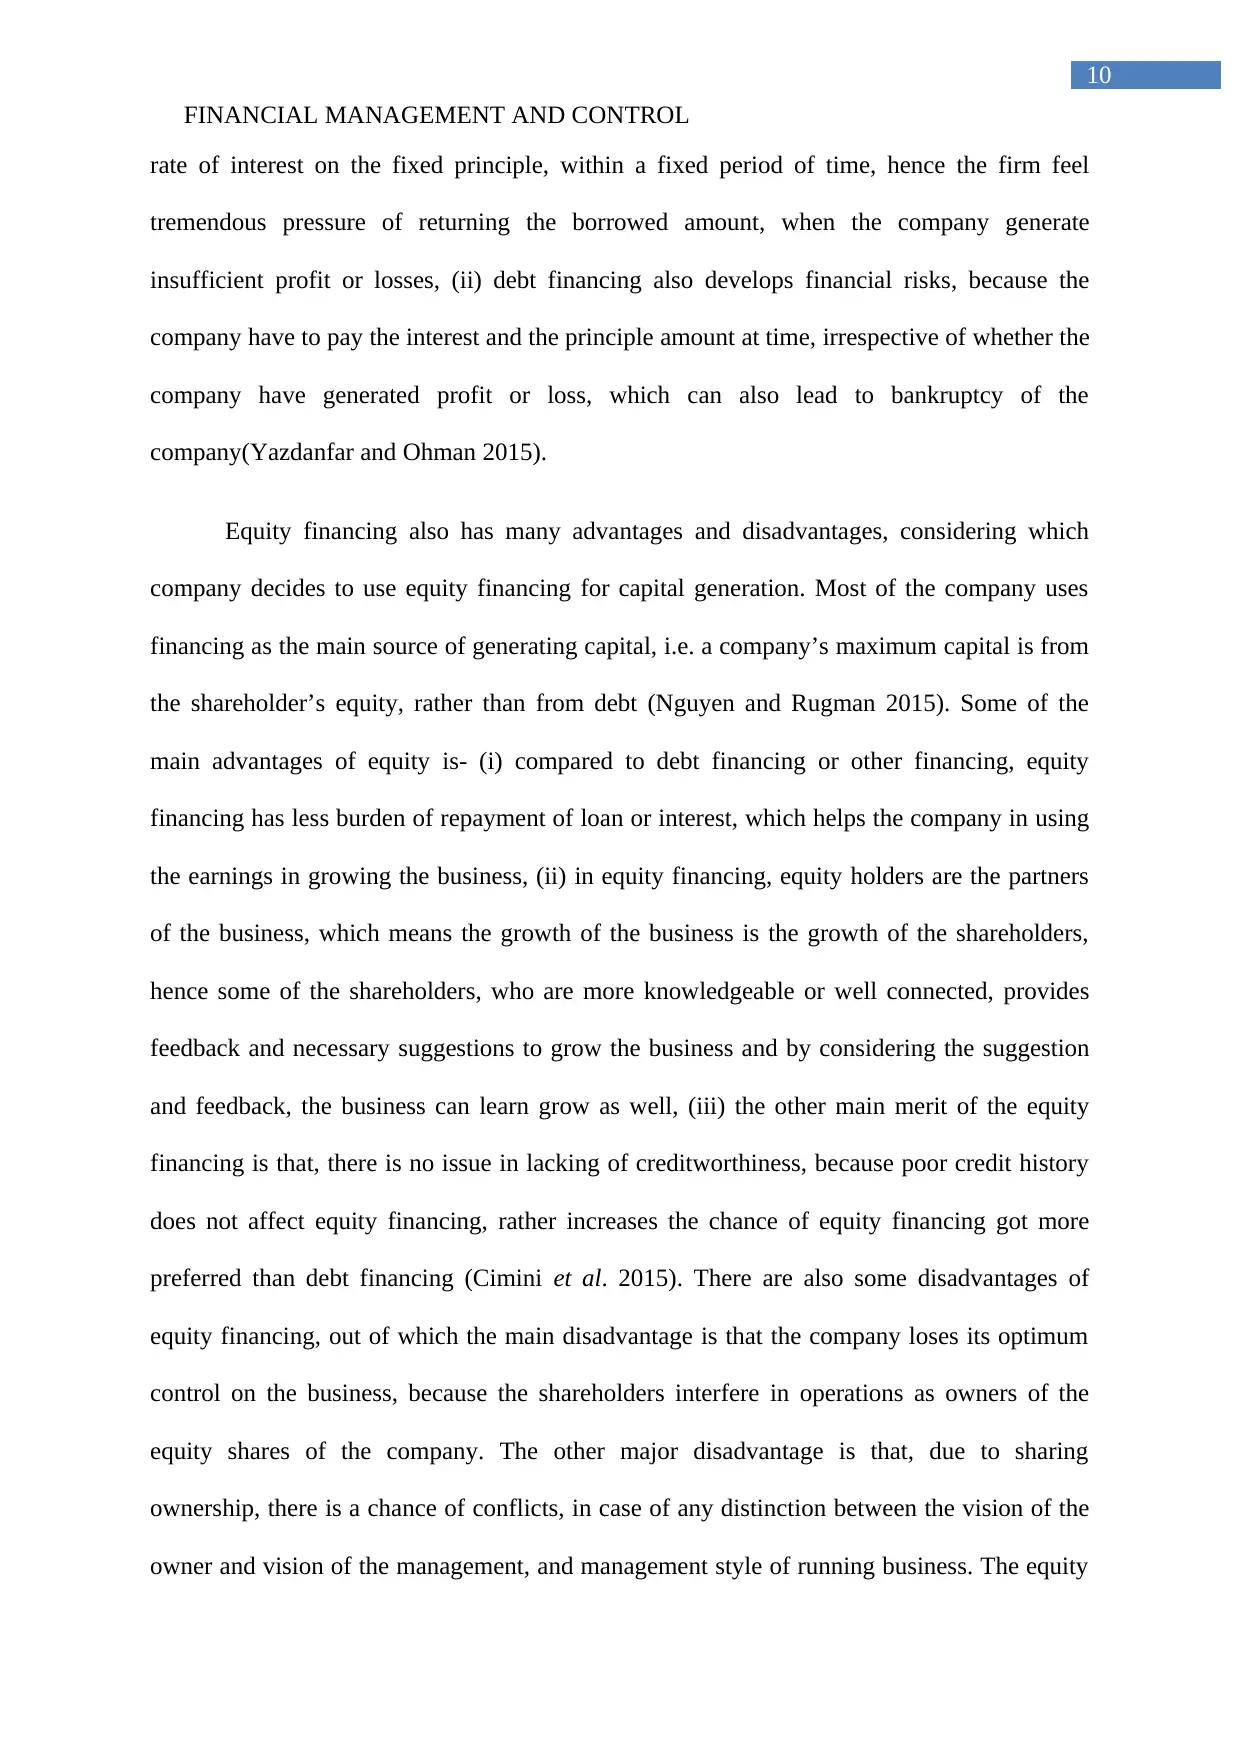
rate of interest on the fixed principle, within a fixed period of time, hence the firm feel
tremendous pressure of returning the borrowed amount, when the company generate
insufficient profit or losses, (ii) debt financing also develops financial risks, because the
company have to pay the interest and the principle amount at time, irrespective of whether the
company have generated profit or loss, which can also lead to bankruptcy of the
company(Yazdanfar and Ohman 2015).
Equity financing also has many advantages and disadvantages, considering which
company decides to use equity financing for capital generation. Most of the company uses
financing as the main source of generating capital, i.e. a company’s maximum capital is from
the shareholder’s equity, rather than from debt (Nguyen and Rugman 2015). Some of the
main advantages of equity is- (i) compared to debt financing or other financing, equity
financing has less burden of repayment of loan or interest, which helps the company in using
the earnings in growing the business, (ii) in equity financing, equity holders are the partners
of the business, which means the growth of the business is the growth of the shareholders,
hence some of the shareholders, who are more knowledgeable or well connected, provides
feedback and necessary suggestions to grow the business and by considering the suggestion
and feedback, the business can learn grow as well, (iii) the other main merit of the equity
financing is that, there is no issue in lacking of creditworthiness, because poor credit history
does not affect equity financing, rather increases the chance of equity financing got more
preferred than debt financing (Cimini et al. 2015). There are also some disadvantages of
equity financing, out of which the main disadvantage is that the company loses its optimum
control on the business, because the shareholders interfere in operations as owners of the
equity shares of the company. The other major disadvantage is that, due to sharing
ownership, there is a chance of conflicts, in case of any distinction between the vision of the
owner and vision of the management, and management style of running business. The equity
10
rate of interest on the fixed principle, within a fixed period of time, hence the firm feel
tremendous pressure of returning the borrowed amount, when the company generate
insufficient profit or losses, (ii) debt financing also develops financial risks, because the
company have to pay the interest and the principle amount at time, irrespective of whether the
company have generated profit or loss, which can also lead to bankruptcy of the
company(Yazdanfar and Ohman 2015).
Equity financing also has many advantages and disadvantages, considering which
company decides to use equity financing for capital generation. Most of the company uses
financing as the main source of generating capital, i.e. a company’s maximum capital is from
the shareholder’s equity, rather than from debt (Nguyen and Rugman 2015). Some of the
main advantages of equity is- (i) compared to debt financing or other financing, equity
financing has less burden of repayment of loan or interest, which helps the company in using
the earnings in growing the business, (ii) in equity financing, equity holders are the partners
of the business, which means the growth of the business is the growth of the shareholders,
hence some of the shareholders, who are more knowledgeable or well connected, provides
feedback and necessary suggestions to grow the business and by considering the suggestion
and feedback, the business can learn grow as well, (iii) the other main merit of the equity
financing is that, there is no issue in lacking of creditworthiness, because poor credit history
does not affect equity financing, rather increases the chance of equity financing got more
preferred than debt financing (Cimini et al. 2015). There are also some disadvantages of
equity financing, out of which the main disadvantage is that the company loses its optimum
control on the business, because the shareholders interfere in operations as owners of the
equity shares of the company. The other major disadvantage is that, due to sharing
ownership, there is a chance of conflicts, in case of any distinction between the vision of the
owner and vision of the management, and management style of running business. The equity
FINANCIAL MANAGEMENT AND CONTROL
11
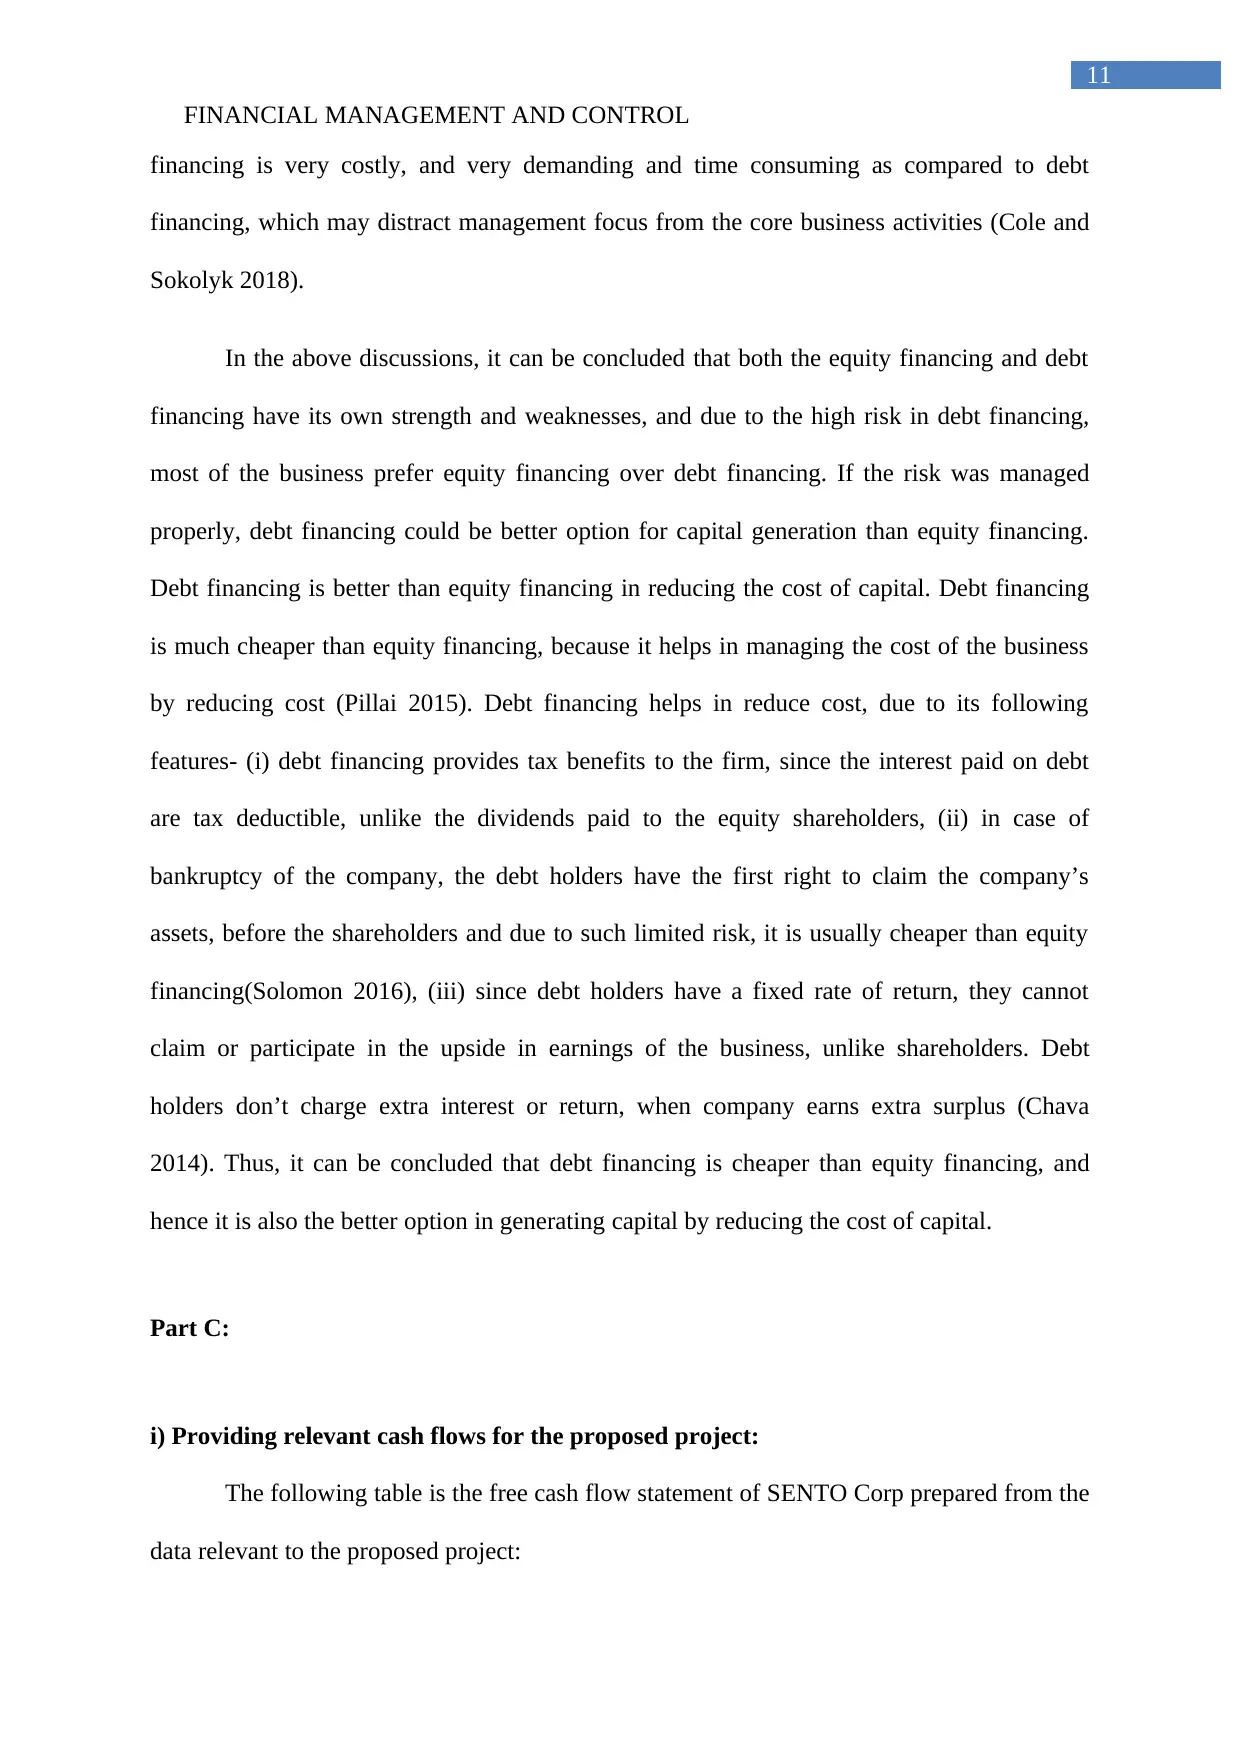
financing is very costly, and very demanding and time consuming as compared to debt
financing, which may distract management focus from the core business activities (Cole and
Sokolyk 2018).
In the above discussions, it can be concluded that both the equity financing and debt
financing have its own strength and weaknesses, and due to the high risk in debt financing,
most of the business prefer equity financing over debt financing. If the risk was managed
properly, debt financing could be better option for capital generation than equity financing.
Debt financing is better than equity financing in reducing the cost of capital. Debt financing
is much cheaper than equity financing, because it helps in managing the cost of the business
by reducing cost (Pillai 2015). Debt financing helps in reduce cost, due to its following
features- (i) debt financing provides tax benefits to the firm, since the interest paid on debt
are tax deductible, unlike the dividends paid to the equity shareholders, (ii) in case of
bankruptcy of the company, the debt holders have the first right to claim the company’s
assets, before the shareholders and due to such limited risk, it is usually cheaper than equity
financing(Solomon 2016), (iii) since debt holders have a fixed rate of return, they cannot
claim or participate in the upside in earnings of the business, unlike shareholders. Debt
holders don’t charge extra interest or return, when company earns extra surplus (Chava
2014). Thus, it can be concluded that debt financing is cheaper than equity financing, and
hence it is also the better option in generating capital by reducing the cost of capital.
Part C:
i) Providing relevant cash flows for the proposed project:
The following table is the free cash flow statement of SENTO Corp prepared from the
data relevant to the proposed project:
11
financing is very costly, and very demanding and time consuming as compared to debt
financing, which may distract management focus from the core business activities (Cole and
Sokolyk 2018).
In the above discussions, it can be concluded that both the equity financing and debt
financing have its own strength and weaknesses, and due to the high risk in debt financing,
most of the business prefer equity financing over debt financing. If the risk was managed
properly, debt financing could be better option for capital generation than equity financing.
Debt financing is better than equity financing in reducing the cost of capital. Debt financing
is much cheaper than equity financing, because it helps in managing the cost of the business
by reducing cost (Pillai 2015). Debt financing helps in reduce cost, due to its following
features- (i) debt financing provides tax benefits to the firm, since the interest paid on debt
are tax deductible, unlike the dividends paid to the equity shareholders, (ii) in case of
bankruptcy of the company, the debt holders have the first right to claim the company’s
assets, before the shareholders and due to such limited risk, it is usually cheaper than equity
financing(Solomon 2016), (iii) since debt holders have a fixed rate of return, they cannot
claim or participate in the upside in earnings of the business, unlike shareholders. Debt
holders don’t charge extra interest or return, when company earns extra surplus (Chava
2014). Thus, it can be concluded that debt financing is cheaper than equity financing, and
hence it is also the better option in generating capital by reducing the cost of capital.
Part C:
i) Providing relevant cash flows for the proposed project:
The following table is the free cash flow statement of SENTO Corp prepared from the
data relevant to the proposed project:
⊘ This is a preview!⊘
Do you want full access?
Subscribe today to unlock all pages.
Trusted by 1+ million students worldwide
1 out of 22
Related Documents


Your All-in-One AI-Powered Toolkit for Academic Success.
+13062052269
info@desklib.com
Available 24*7 on WhatsApp / Email
![[object Object]](/_next/static/media/star-bottom.7253800d.svg)
Unlock your academic potential
Copyright © 2020–2026 A2Z Services. All Rights Reserved. Developed and managed by ZUCOL.