Comprehensive Financial Analysis and Performance of Facebook Inc.
VerifiedAdded on 2020/03/01
|18
|4193
|70
Report
AI Summary
This report presents a financial analysis of Facebook Inc., examining its financial position and performance from 2014 to 2016. The analysis includes calculations and interpretations of key financial ratios, such as the current, quick, and cash ratios, providing insights into Facebook's liquidity and short-term solvency. Furthermore, the report assesses Facebook's profitability through the Return on Equity (ROE) and Return on Assets (ROA) ratios, highlighting the company's efficiency in generating profits from shareholder investments and total assets. The analysis also delves into Facebook's financial performance, examining gross profit margin and net profit margin, along with comparisons to industry peers and competitors like Adobe, Alphabet, and Microsoft. The report discusses the factors influencing Facebook's financial results, including revenue from advertising, payment and other fees, and changes in accounting policies. It also mentions the company's use of non-GAAP financial measures and its approach to share-based compensation. Overall, the report provides a comprehensive overview of Facebook's financial health and performance over the specified period.
FINANCIAL ACCOUNTING ANALYSIS
Paraphrase This Document
Need a fresh take? Get an instant paraphrase of this document with our AI Paraphraser
INTRODUCTION
Face book is one of the largest fastest growing social media around the world. Facebook Inc. It
provides the facility to the people to connect with each other through laptops, personal
computers, mobile devices and other surfaces and enables them to share their views, opinions,
photographs, videos and other activities online.
Facebook was founded by a Havard student, Mark Zuckerberg along with his other friends called
Eduardo Saverin, Andrew McCollum, Dustin Moskovitz and Chris Hughes and was launched on
February 4, 2004. It was initially developed as a portal for the Havard students only so that they
can remain connected with each other. However, in the later period, the service was extended to
other colleges' students and then ultimately, goes under the reach of everybody throughout the
world over a period of 13 years.
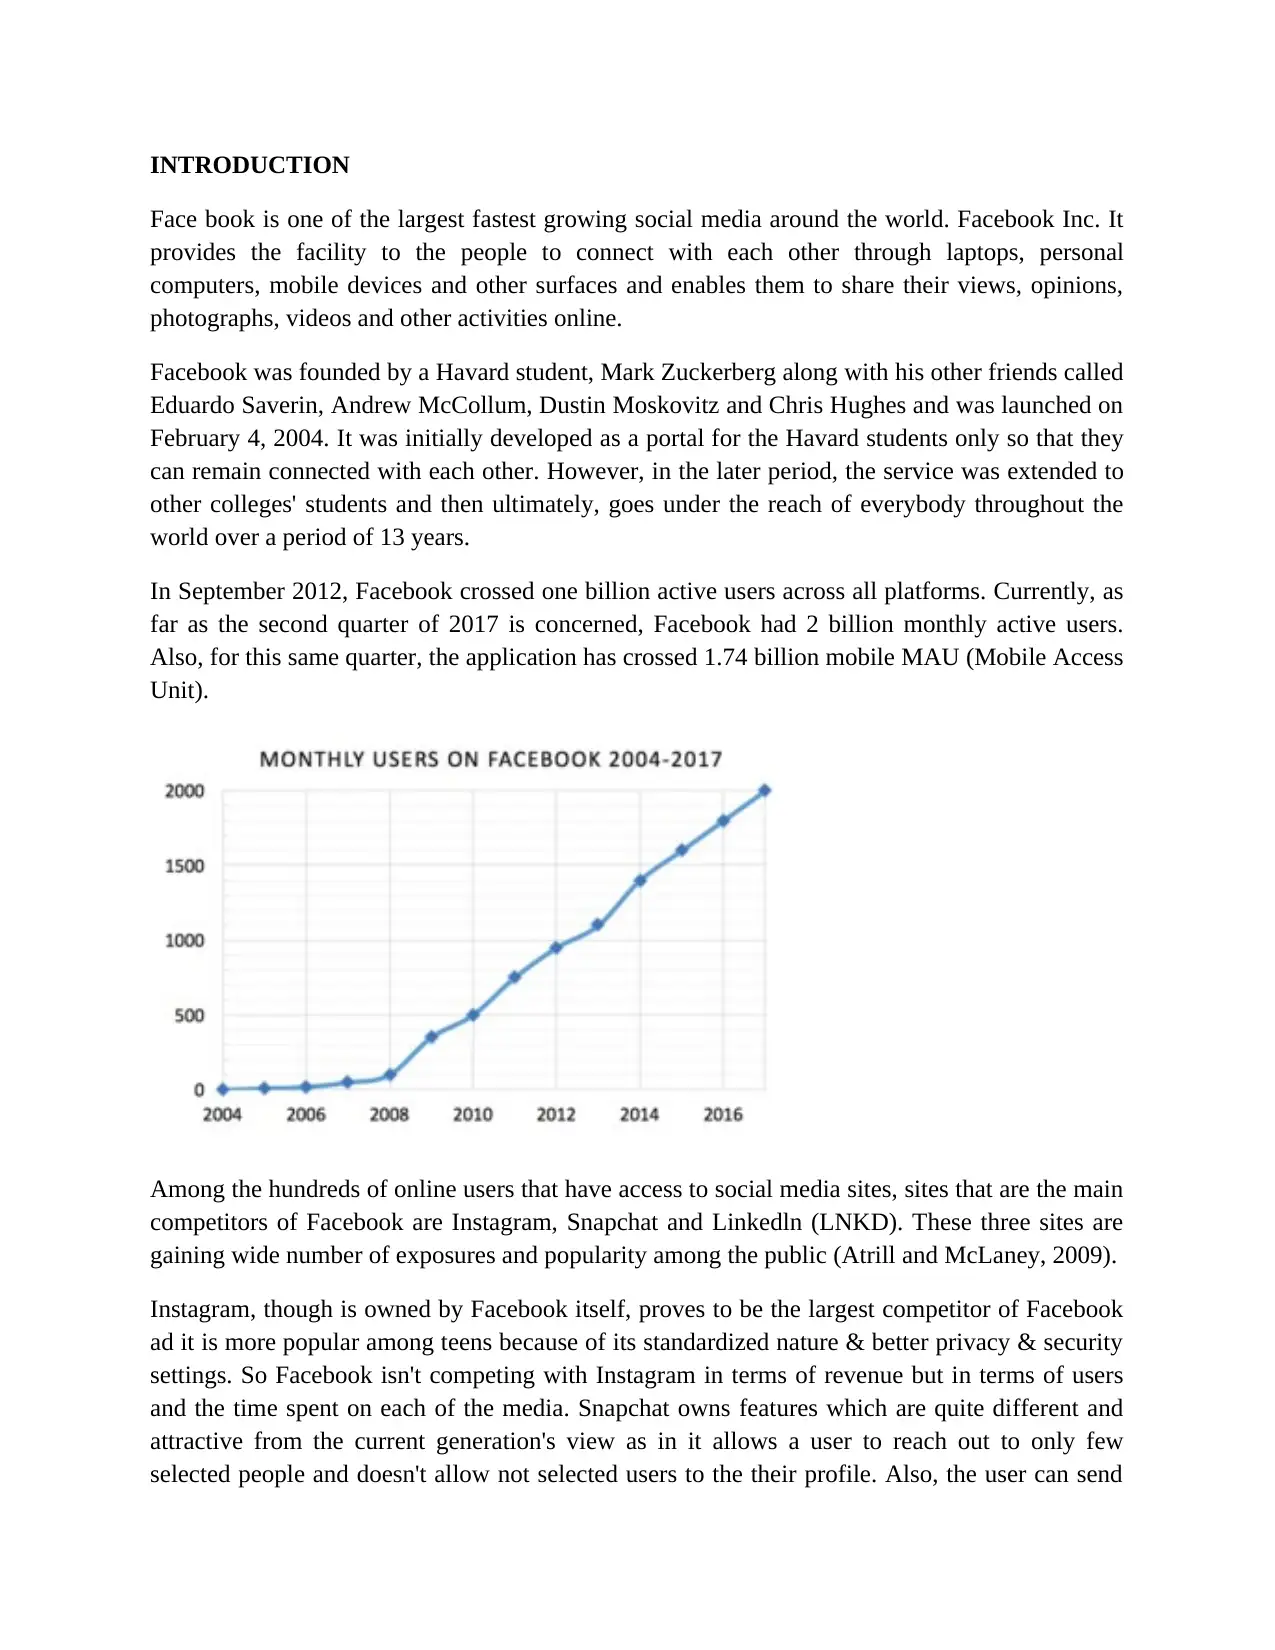
In September 2012, Facebook crossed one billion active users across all platforms. Currently, as
far as the second quarter of 2017 is concerned, Facebook had 2 billion monthly active users.
Also, for this same quarter, the application has crossed 1.74 billion mobile MAU (Mobile Access
Unit).
Among the hundreds of online users that have access to social media sites, sites that are the main
competitors of Facebook are Instagram, Snapchat and Linkedln (LNKD). These three sites are
gaining wide number of exposures and popularity among the public (Atrill and McLaney, 2009).
Instagram, though is owned by Facebook itself, proves to be the largest competitor of Facebook
ad it is more popular among teens because of its standardized nature & better privacy & security
settings. So Facebook isn't competing with Instagram in terms of revenue but in terms of users
and the time spent on each of the media. Snapchat owns features which are quite different and
attractive from the current generation's view as in it allows a user to reach out to only few
selected people and doesn't allow not selected users to the their profile. Also, the user can send
Face book is one of the largest fastest growing social media around the world. Facebook Inc. It
provides the facility to the people to connect with each other through laptops, personal
computers, mobile devices and other surfaces and enables them to share their views, opinions,
photographs, videos and other activities online.
Facebook was founded by a Havard student, Mark Zuckerberg along with his other friends called
Eduardo Saverin, Andrew McCollum, Dustin Moskovitz and Chris Hughes and was launched on
February 4, 2004. It was initially developed as a portal for the Havard students only so that they
can remain connected with each other. However, in the later period, the service was extended to
other colleges' students and then ultimately, goes under the reach of everybody throughout the
world over a period of 13 years.
In September 2012, Facebook crossed one billion active users across all platforms. Currently, as
far as the second quarter of 2017 is concerned, Facebook had 2 billion monthly active users.
Also, for this same quarter, the application has crossed 1.74 billion mobile MAU (Mobile Access
Unit).
Among the hundreds of online users that have access to social media sites, sites that are the main
competitors of Facebook are Instagram, Snapchat and Linkedln (LNKD). These three sites are
gaining wide number of exposures and popularity among the public (Atrill and McLaney, 2009).
Instagram, though is owned by Facebook itself, proves to be the largest competitor of Facebook
ad it is more popular among teens because of its standardized nature & better privacy & security
settings. So Facebook isn't competing with Instagram in terms of revenue but in terms of users
and the time spent on each of the media. Snapchat owns features which are quite different and
attractive from the current generation's view as in it allows a user to reach out to only few
selected people and doesn't allow not selected users to the their profile. Also, the user can send
his/her picture or text to the recipient who can view it for a shorter period of time only. So,
privacy is somewhere better in this case. Linkedln isn't as popular as Facebook but it is
somewhere earning the reputation of a professional platform for recruitment activities. This
application provides features of finding new jobs, potential applicants, etc. It is necessarily
gaining popularity ad it provides a better picture of future to people and therefore, is being
referred by people for employment purposes (Berry and Jarvis, 2007).
The other competitors include Google, Twitter, etc. However, the number of users of \these
applications is paltry in comparison to the number of users Facebook has. Therefore, these
applications are into a less direct competition with Facebook.
⊘ This is a preview!⊘
Do you want full access?
Subscribe today to unlock all pages.
Trusted by 1+ million students worldwide
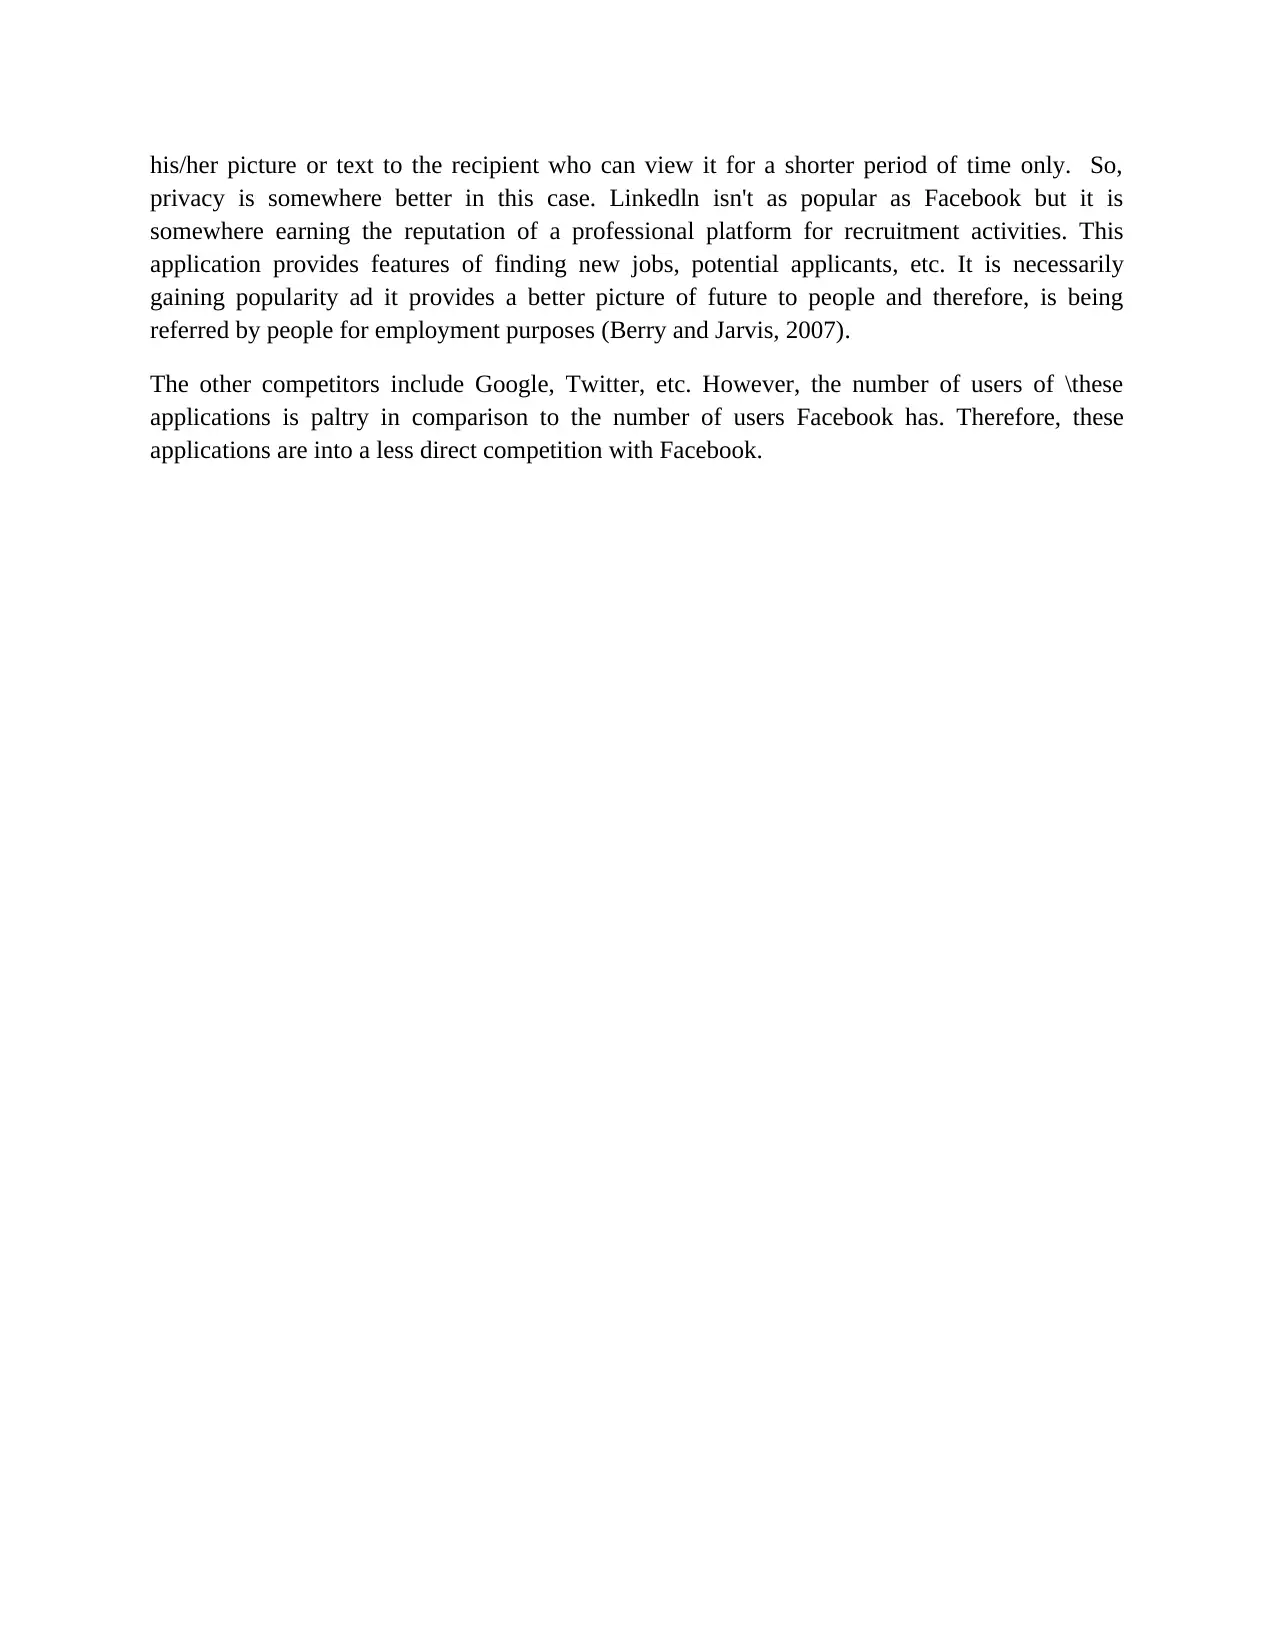
ANALYSIS OF FINANCIAL POSITION.
A company's financial position is being reflected by its assets and liabilities (Bruner, Eades and
Schill, 2017). The financial conditions that shows the status of assets & liabilities and owner's equity
and their interrelationships reflects a company's strengths and weaknesses or more precisely the
position of it in the market.
(FOR THE YEAR ENDED 31ST DECEMBER,2016,2015 & 2014)
(USD $ IN MILLIONS)
PARTICULARS 2016 2015 2014
CURRENT RATIO
Current Assets 34401 21652 13670
Current Liabilities 2875 1925 1424
Current Ratio 11.97 11.25 9.60
QUICK RATIO
Cash and cash equivalents 8903 4907 4315
Marketable securities 20546 13527 6884
Accounts receivables,net of
allowances for doubtful debts 3993 2559 1678
Total quick assets 33442 20993 12877
Current liabilities 2875 1925 1424
Quick Ratio 11.63 10.91 9.04
Paraphrase This Document
Need a fresh take? Get an instant paraphrase of this document with our AI Paraphraser
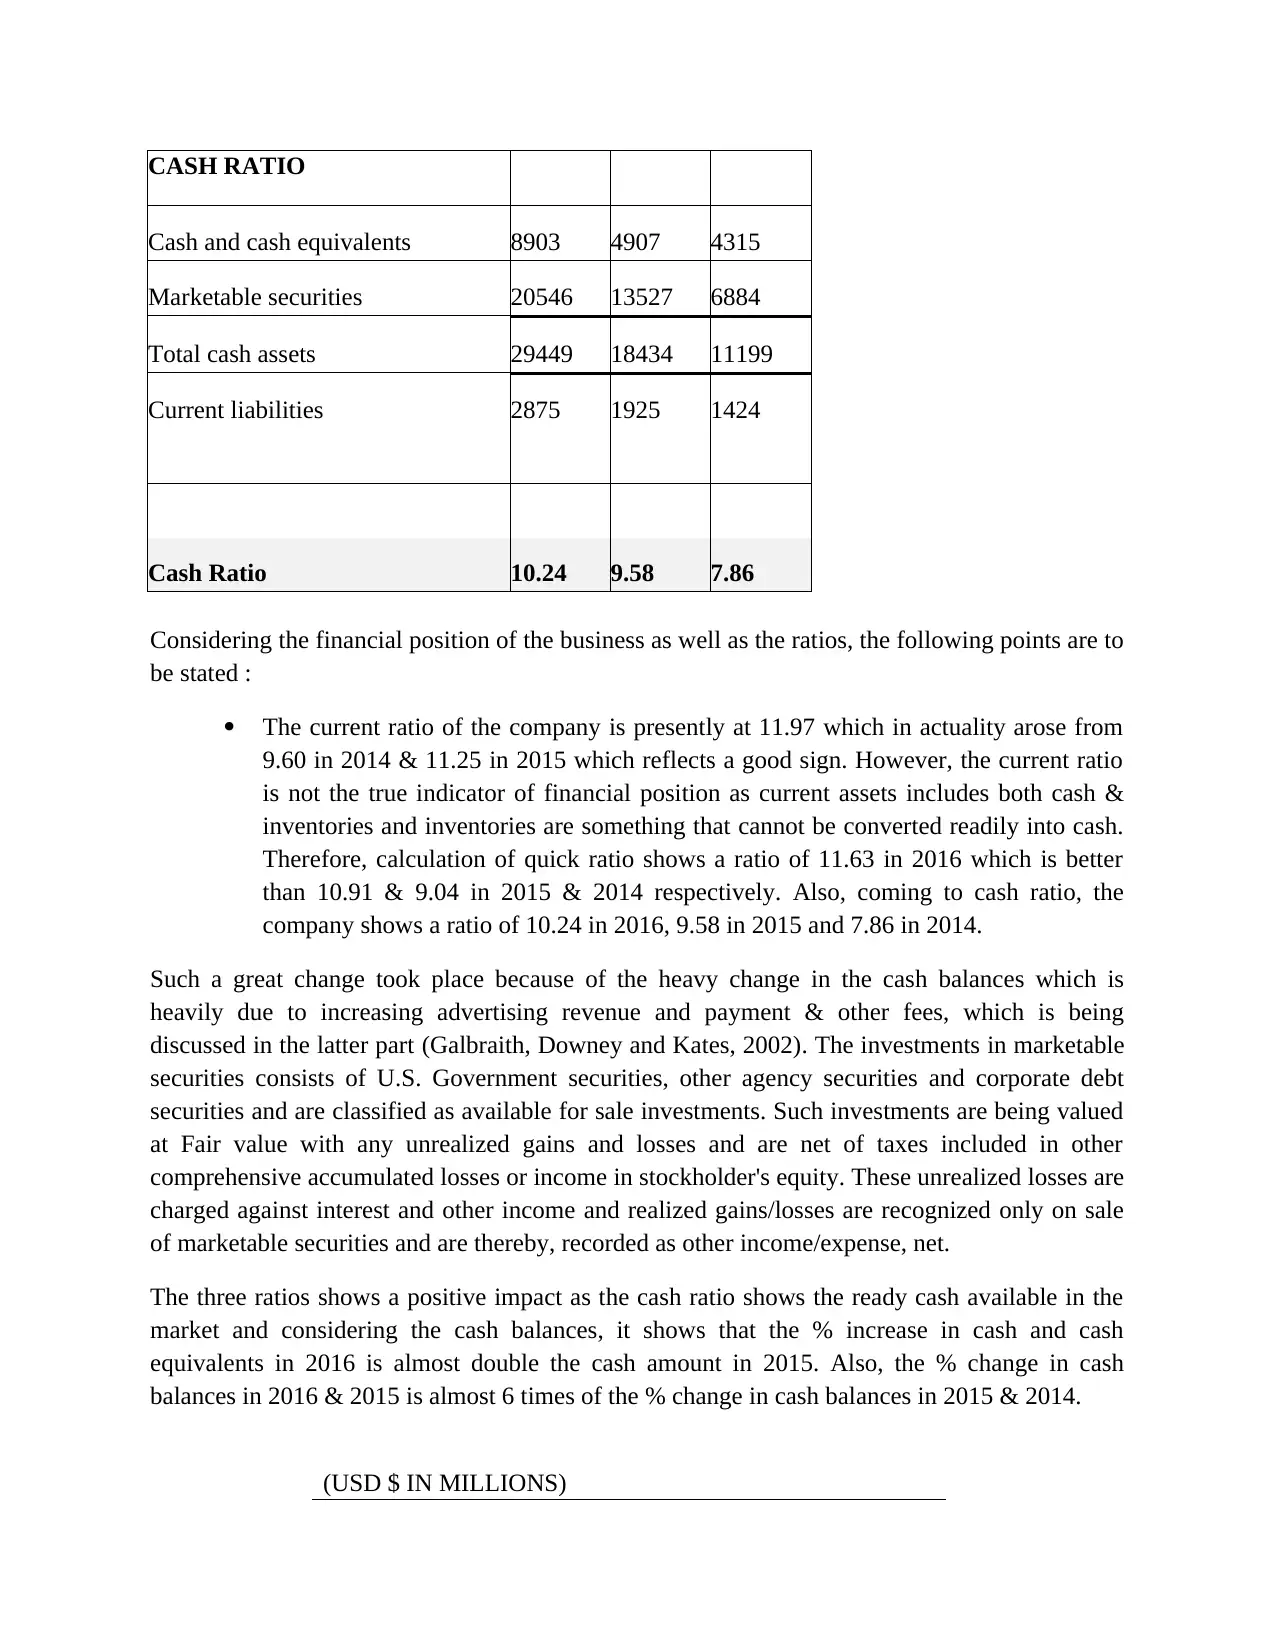
CASH RATIO
Cash and cash equivalents 8903 4907 4315
Marketable securities 20546 13527 6884
Total cash assets 29449 18434 11199
Current liabilities 2875 1925 1424
Cash Ratio 10.24 9.58 7.86
Considering the financial position of the business as well as the ratios, the following points are to
be stated :
The current ratio of the company is presently at 11.97 which in actuality arose from
9.60 in 2014 & 11.25 in 2015 which reflects a good sign. However, the current ratio
is not the true indicator of financial position as current assets includes both cash &
inventories and inventories are something that cannot be converted readily into cash.
Therefore, calculation of quick ratio shows a ratio of 11.63 in 2016 which is better
than 10.91 & 9.04 in 2015 & 2014 respectively. Also, coming to cash ratio, the
company shows a ratio of 10.24 in 2016, 9.58 in 2015 and 7.86 in 2014.
Such a great change took place because of the heavy change in the cash balances which is
heavily due to increasing advertising revenue and payment & other fees, which is being
discussed in the latter part (Galbraith, Downey and Kates, 2002). The investments in marketable
securities consists of U.S. Government securities, other agency securities and corporate debt
securities and are classified as available for sale investments. Such investments are being valued
at Fair value with any unrealized gains and losses and are net of taxes included in other
comprehensive accumulated losses or income in stockholder's equity. These unrealized losses are
charged against interest and other income and realized gains/losses are recognized only on sale
of marketable securities and are thereby, recorded as other income/expense, net.
The three ratios shows a positive impact as the cash ratio shows the ready cash available in the
market and considering the cash balances, it shows that the % increase in cash and cash
equivalents in 2016 is almost double the cash amount in 2015. Also, the % change in cash
balances in 2016 & 2015 is almost 6 times of the % change in cash balances in 2015 & 2014.
(USD $ IN MILLIONS)
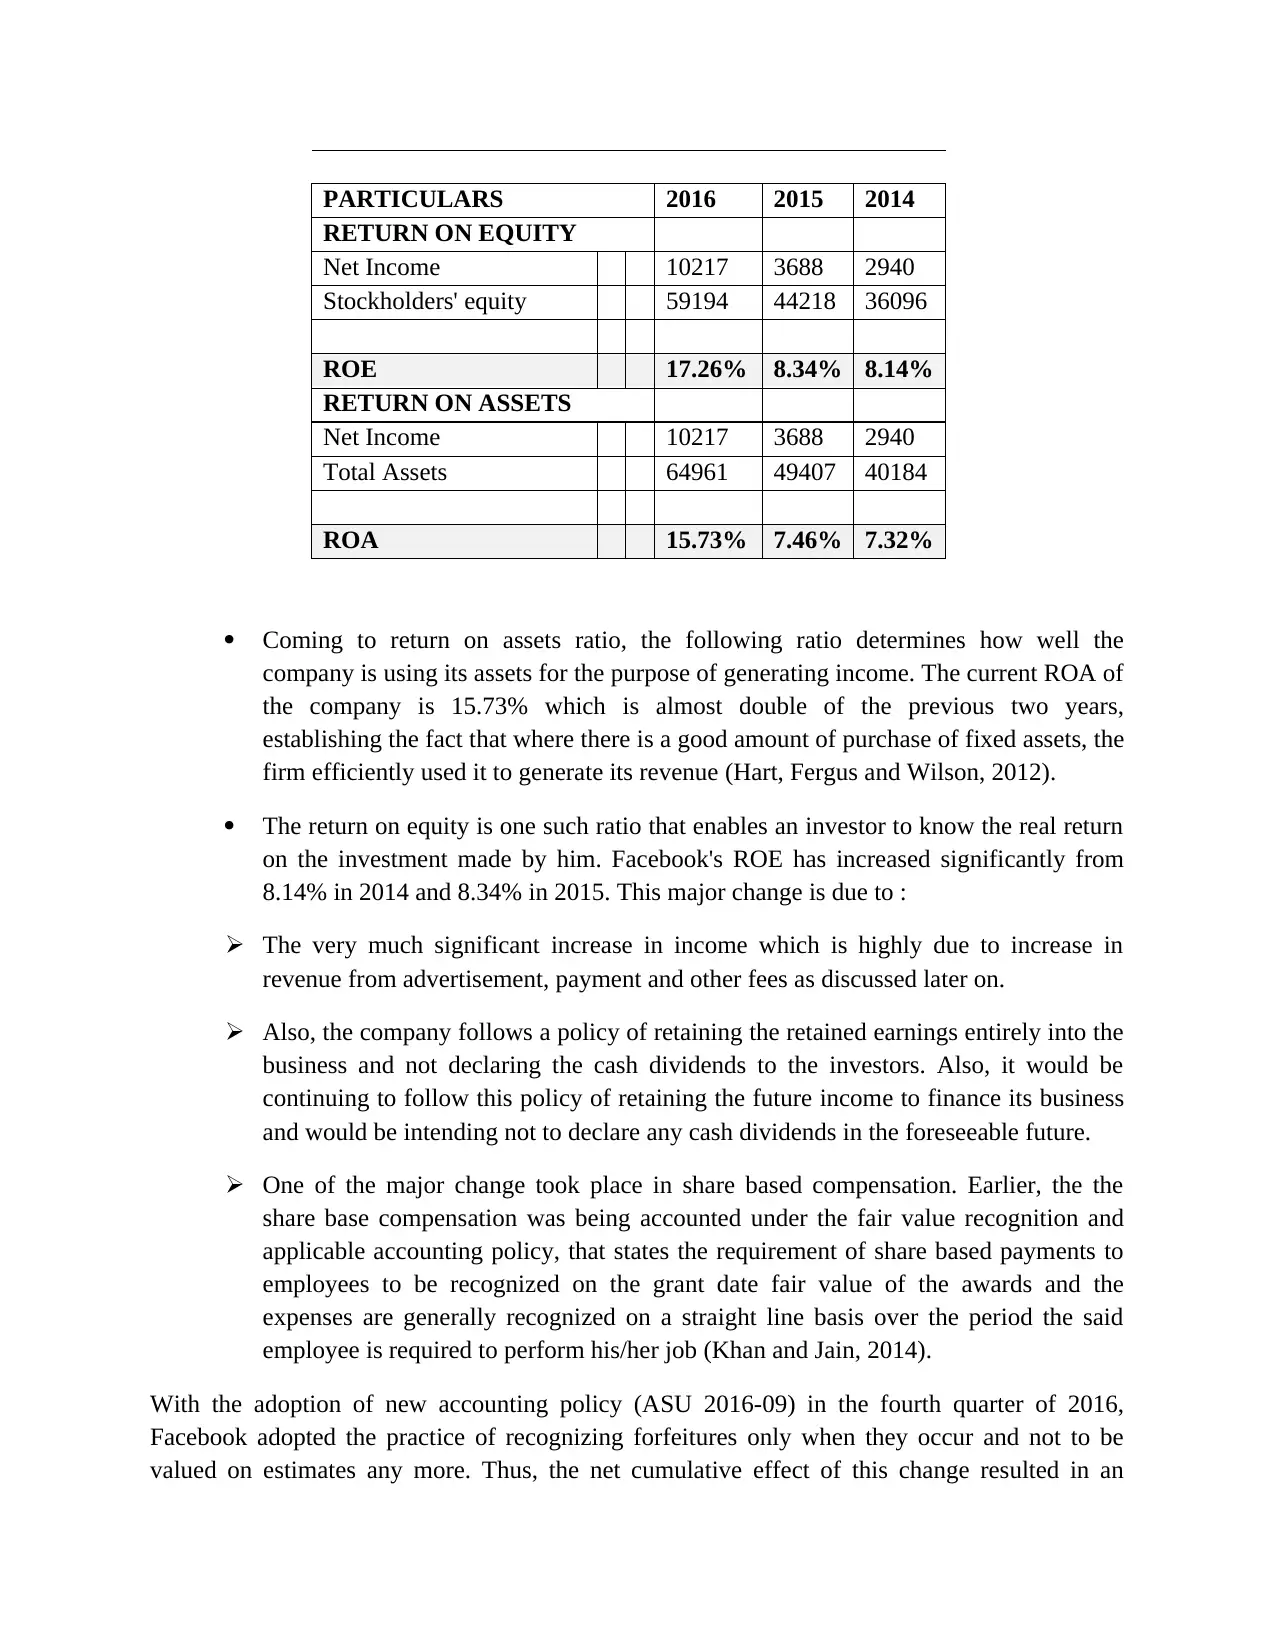
PARTICULARS 2016 2015 2014
RETURN ON EQUITY
Net Income 10217 3688 2940
Stockholders' equity 59194 44218 36096
ROE 17.26% 8.34% 8.14%
RETURN ON ASSETS
Net Income 10217 3688 2940
Total Assets 64961 49407 40184
ROA 15.73% 7.46% 7.32%
Coming to return on assets ratio, the following ratio determines how well the
company is using its assets for the purpose of generating income. The current ROA of
the company is 15.73% which is almost double of the previous two years,
establishing the fact that where there is a good amount of purchase of fixed assets, the
firm efficiently used it to generate its revenue (Hart, Fergus and Wilson, 2012).
The return on equity is one such ratio that enables an investor to know the real return
on the investment made by him. Facebook's ROE has increased significantly from
8.14% in 2014 and 8.34% in 2015. This major change is due to :
The very much significant increase in income which is highly due to increase in
revenue from advertisement, payment and other fees as discussed later on.
Also, the company follows a policy of retaining the retained earnings entirely into the
business and not declaring the cash dividends to the investors. Also, it would be
continuing to follow this policy of retaining the future income to finance its business
and would be intending not to declare any cash dividends in the foreseeable future.
One of the major change took place in share based compensation. Earlier, the the
share base compensation was being accounted under the fair value recognition and
applicable accounting policy, that states the requirement of share based payments to
employees to be recognized on the grant date fair value of the awards and the
expenses are generally recognized on a straight line basis over the period the said
employee is required to perform his/her job (Khan and Jain, 2014).
With the adoption of new accounting policy (ASU 2016-09) in the fourth quarter of 2016,
Facebook adopted the practice of recognizing forfeitures only when they occur and not to be
valued on estimates any more. Thus, the net cumulative effect of this change resulted in an
⊘ This is a preview!⊘
Do you want full access?
Subscribe today to unlock all pages.
Trusted by 1+ million students worldwide
increase of $39 million in the paid-in capital. Also, share based compensation for the years
ending December 31,2015 & 2014 were recorded net of estimated forfeitures.
It is more likely to discuss the financial performance of the company alongwith this analyzation
to arrive at a better conclusion.
ending December 31,2015 & 2014 were recorded net of estimated forfeitures.
It is more likely to discuss the financial performance of the company alongwith this analyzation
to arrive at a better conclusion.
Paraphrase This Document
Need a fresh take? Get an instant paraphrase of this document with our AI Paraphraser
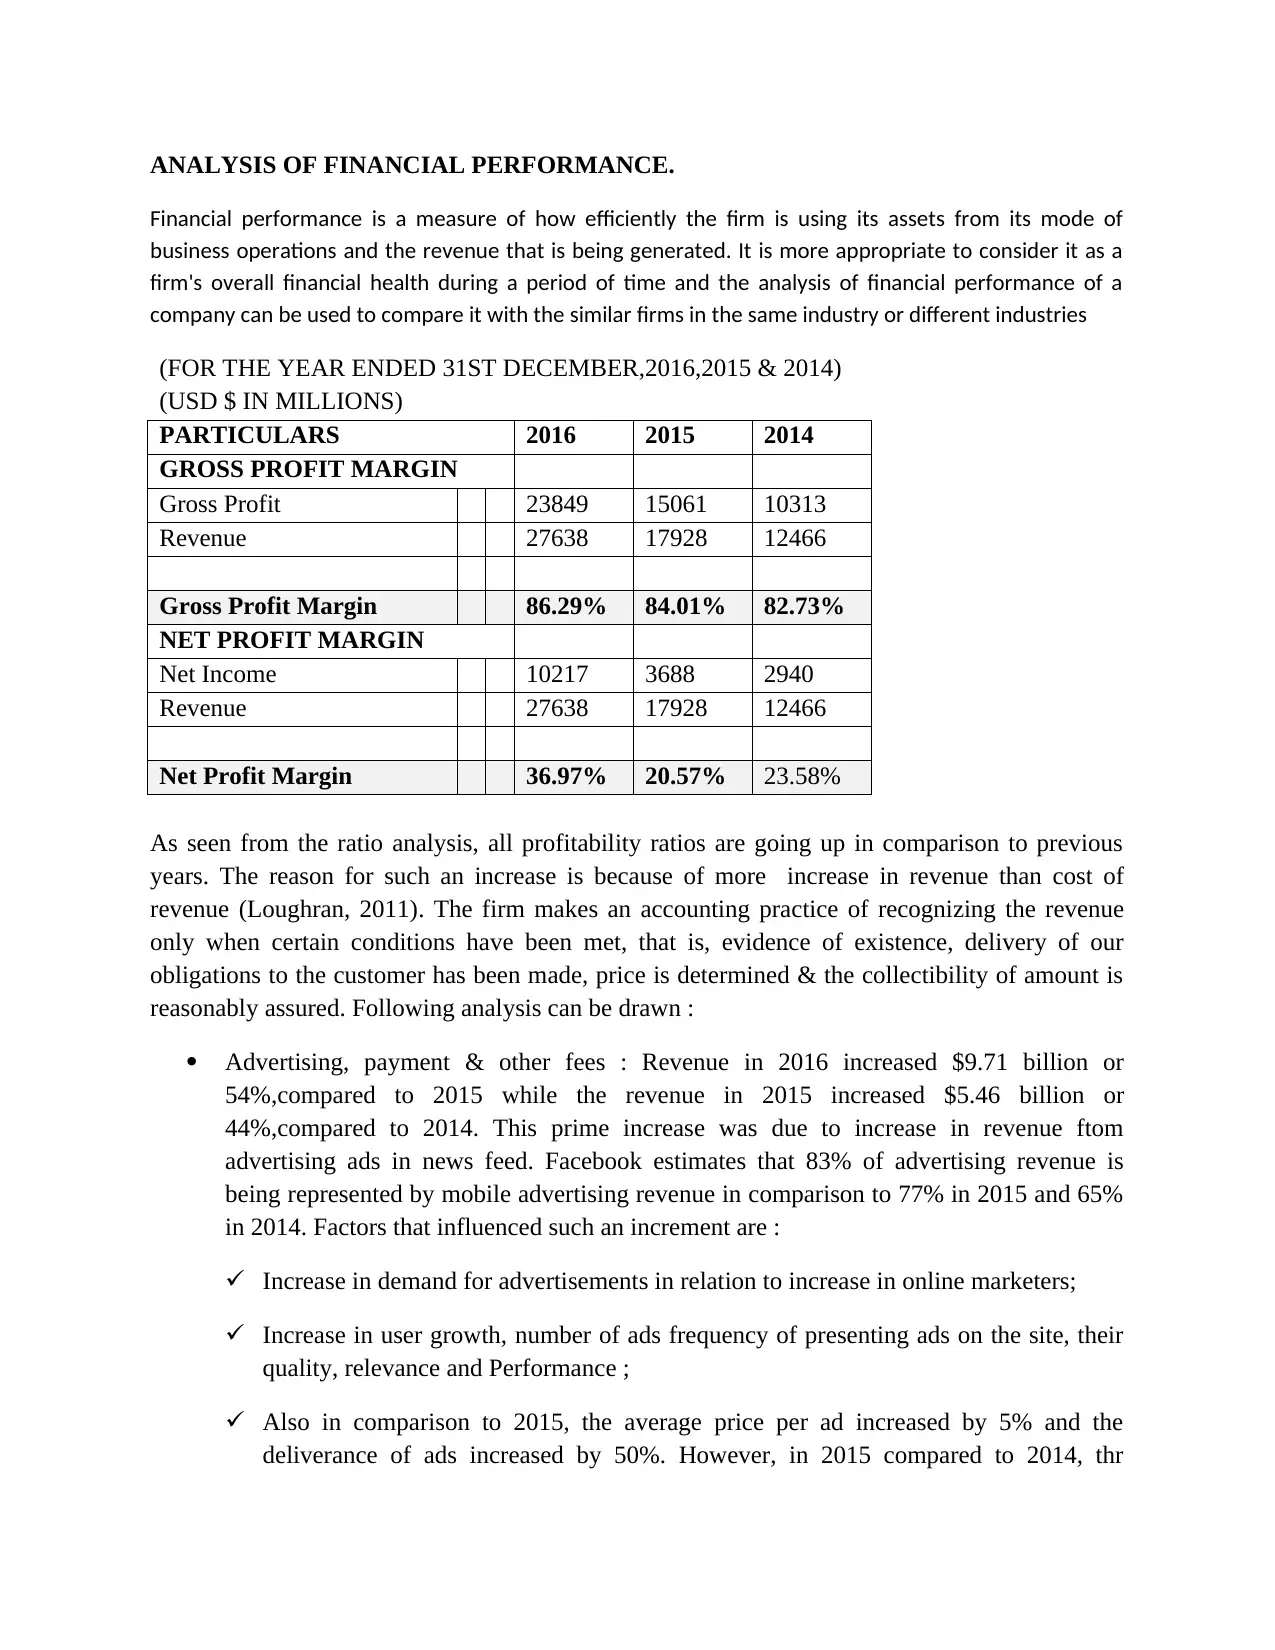
ANALYSIS OF FINANCIAL PERFORMANCE.
Financial performance is a measure of how efficiently the firm is using its assets from its mode of
business operations and the revenue that is being generated. It is more appropriate to consider it as a
firm's overall financial health during a period of time and the analysis of financial performance of a
company can be used to compare it with the similar firms in the same industry or different industries
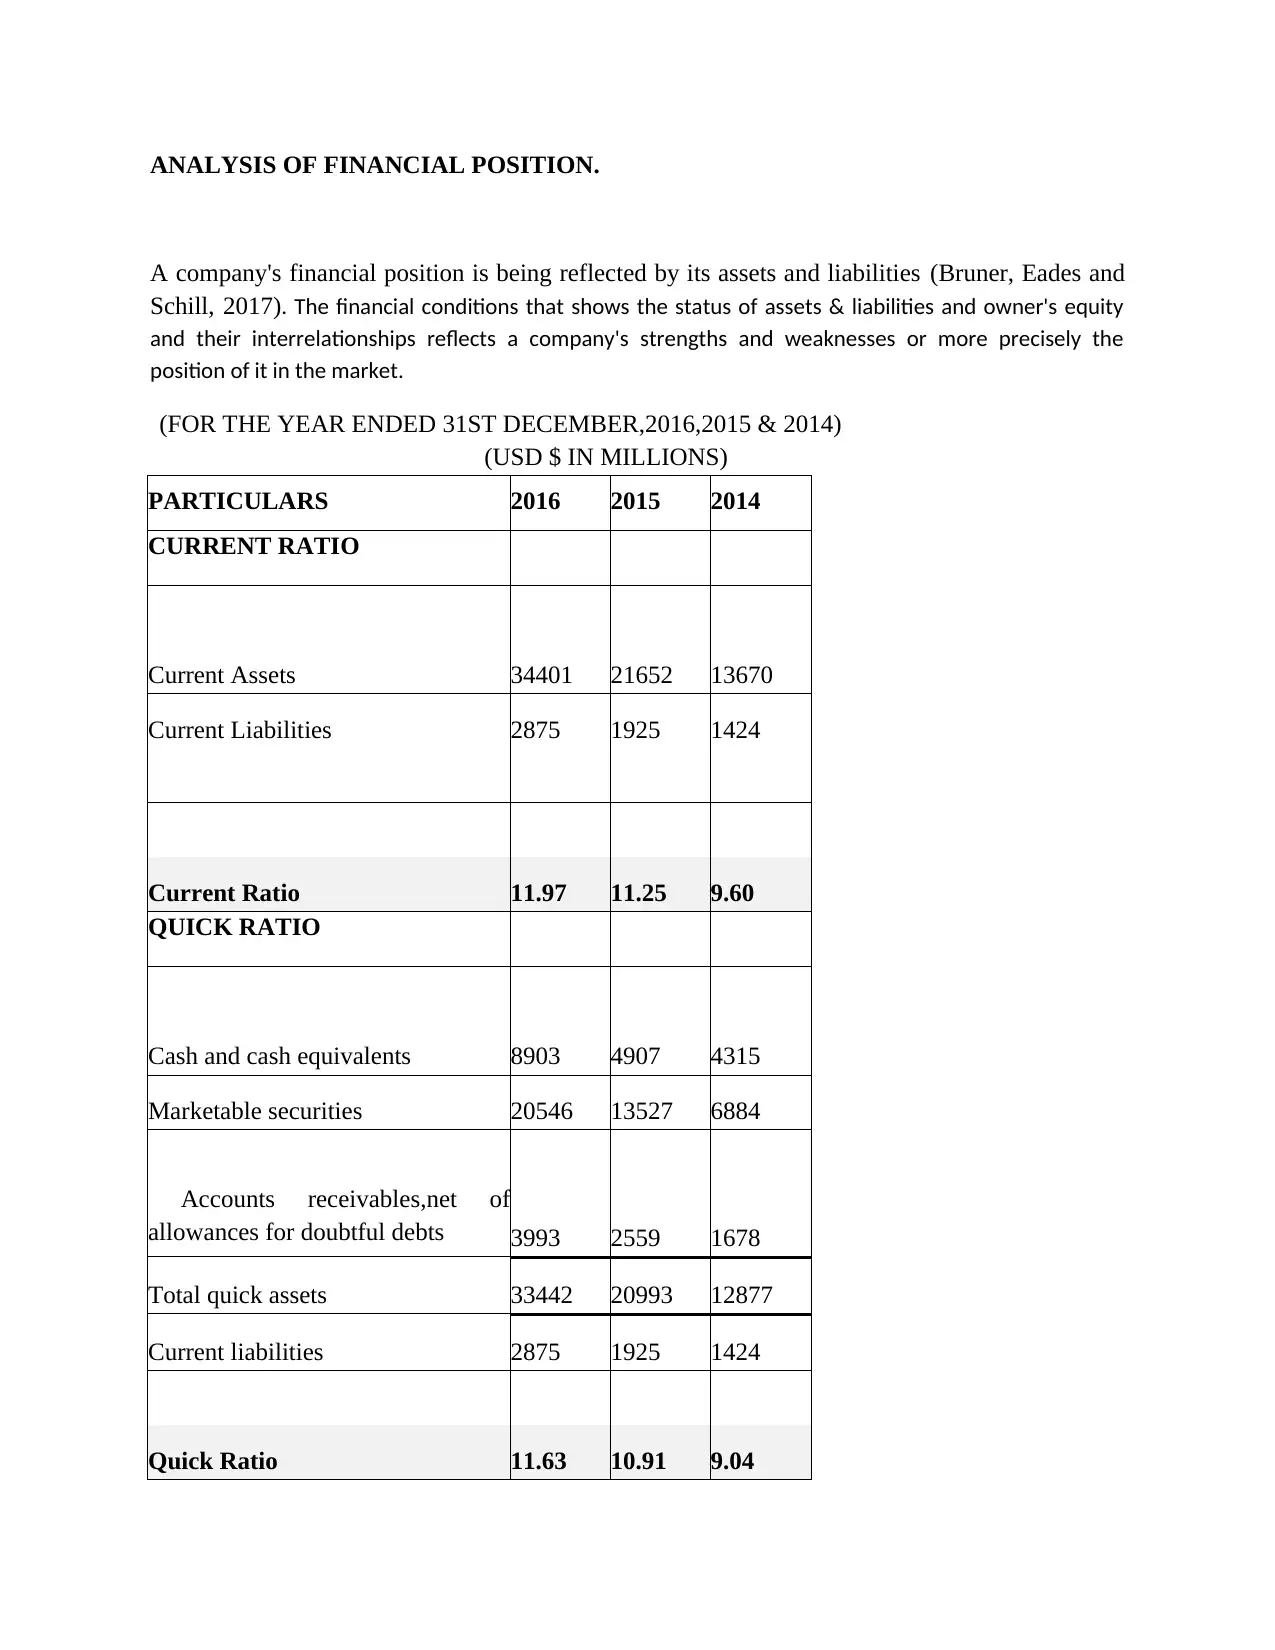
(FOR THE YEAR ENDED 31ST DECEMBER,2016,2015 & 2014)
(USD $ IN MILLIONS)
PARTICULARS 2016 2015 2014
GROSS PROFIT MARGIN
Gross Profit 23849 15061 10313
Revenue 27638 17928 12466
Gross Profit Margin 86.29% 84.01% 82.73%
NET PROFIT MARGIN
Net Income 10217 3688 2940
Revenue 27638 17928 12466
Net Profit Margin 36.97% 20.57% 23.58%
As seen from the ratio analysis, all profitability ratios are going up in comparison to previous
years. The reason for such an increase is because of more increase in revenue than cost of
revenue (Loughran, 2011). The firm makes an accounting practice of recognizing the revenue
only when certain conditions have been met, that is, evidence of existence, delivery of our
obligations to the customer has been made, price is determined & the collectibility of amount is
reasonably assured. Following analysis can be drawn :
Advertising, payment & other fees : Revenue in 2016 increased $9.71 billion or
54%,compared to 2015 while the revenue in 2015 increased $5.46 billion or
44%,compared to 2014. This prime increase was due to increase in revenue ftom
advertising ads in news feed. Facebook estimates that 83% of advertising revenue is
being represented by mobile advertising revenue in comparison to 77% in 2015 and 65%
in 2014. Factors that influenced such an increment are :
Increase in demand for advertisements in relation to increase in online marketers;
Increase in user growth, number of ads frequency of presenting ads on the site, their
quality, relevance and Performance ;
Also in comparison to 2015, the average price per ad increased by 5% and the
deliverance of ads increased by 50%. However, in 2015 compared to 2014, thr
Financial performance is a measure of how efficiently the firm is using its assets from its mode of
business operations and the revenue that is being generated. It is more appropriate to consider it as a
firm's overall financial health during a period of time and the analysis of financial performance of a
company can be used to compare it with the similar firms in the same industry or different industries
(FOR THE YEAR ENDED 31ST DECEMBER,2016,2015 & 2014)
(USD $ IN MILLIONS)
PARTICULARS 2016 2015 2014
GROSS PROFIT MARGIN
Gross Profit 23849 15061 10313
Revenue 27638 17928 12466
Gross Profit Margin 86.29% 84.01% 82.73%
NET PROFIT MARGIN
Net Income 10217 3688 2940
Revenue 27638 17928 12466
Net Profit Margin 36.97% 20.57% 23.58%
As seen from the ratio analysis, all profitability ratios are going up in comparison to previous
years. The reason for such an increase is because of more increase in revenue than cost of
revenue (Loughran, 2011). The firm makes an accounting practice of recognizing the revenue
only when certain conditions have been met, that is, evidence of existence, delivery of our
obligations to the customer has been made, price is determined & the collectibility of amount is
reasonably assured. Following analysis can be drawn :
Advertising, payment & other fees : Revenue in 2016 increased $9.71 billion or
54%,compared to 2015 while the revenue in 2015 increased $5.46 billion or
44%,compared to 2014. This prime increase was due to increase in revenue ftom
advertising ads in news feed. Facebook estimates that 83% of advertising revenue is
being represented by mobile advertising revenue in comparison to 77% in 2015 and 65%
in 2014. Factors that influenced such an increment are :
Increase in demand for advertisements in relation to increase in online marketers;
Increase in user growth, number of ads frequency of presenting ads on the site, their
quality, relevance and Performance ;
Also in comparison to 2015, the average price per ad increased by 5% and the
deliverance of ads increased by 50%. However, in 2015 compared to 2014, thr
average price increased by 140% while the deliverance rate decreased by 38%. This
was basically because of the product change & the shift towards the mobile usage
more than the personal computers because of which the display of ads reduced
(Palepu, Healy and Peek, 2016).
However, the revenue from payments and other fees decreased $96 million or 11%
compared to 2015 due to decrease in payments revenue received on account games being
played on personal computers (Banks and Giliberti, 2008).
Also, no customer represented 10% or more of the total revenue during all the three
years.
When it comes to cost of revenue, the company shows an increment of $922 million, or
32%,compared to 2015 while in 2015,it increased $714 million, or 33% in comparison to
2014. This increments are due to heavy increase in expenses related to data centers &
infrastructure and due to higher costs associated ads payment & various other partnership
agreements (Bhattacharyya, 2011).
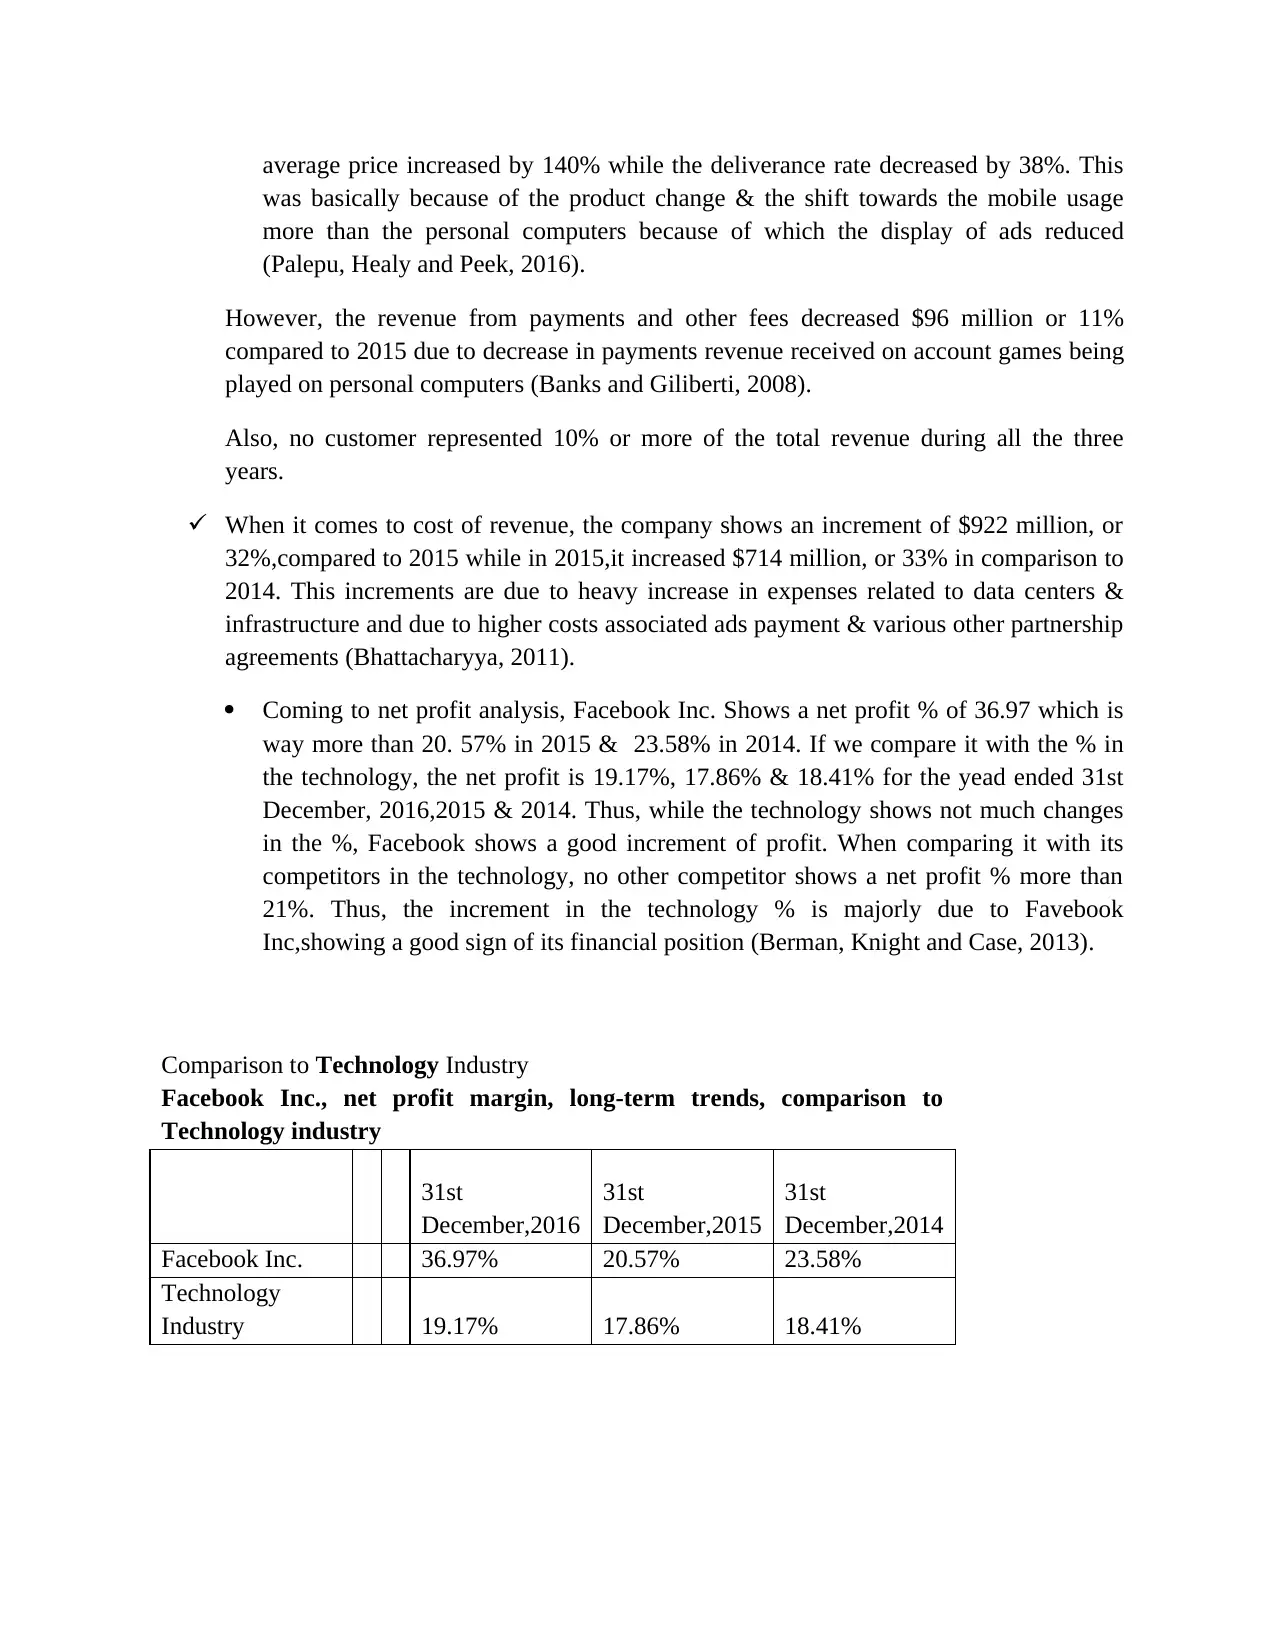
Coming to net profit analysis, Facebook Inc. Shows a net profit % of 36.97 which is
way more than 20. 57% in 2015 & 23.58% in 2014. If we compare it with the % in
the technology, the net profit is 19.17%, 17.86% & 18.41% for the yead ended 31st
December, 2016,2015 & 2014. Thus, while the technology shows not much changes
in the %, Facebook shows a good increment of profit. When comparing it with its
competitors in the technology, no other competitor shows a net profit % more than
21%. Thus, the increment in the technology % is majorly due to Favebook
Inc,showing a good sign of its financial position (Berman, Knight and Case, 2013).
Comparison to Technology Industry
Facebook Inc., net profit margin, long-term trends, comparison to
Technology industry
31st
December,2016
31st
December,2015
31st
December,2014
Facebook Inc. 36.97% 20.57% 23.58%
Technology
Industry 19.17% 17.86% 18.41%
was basically because of the product change & the shift towards the mobile usage
more than the personal computers because of which the display of ads reduced
(Palepu, Healy and Peek, 2016).
However, the revenue from payments and other fees decreased $96 million or 11%
compared to 2015 due to decrease in payments revenue received on account games being
played on personal computers (Banks and Giliberti, 2008).
Also, no customer represented 10% or more of the total revenue during all the three
years.
When it comes to cost of revenue, the company shows an increment of $922 million, or
32%,compared to 2015 while in 2015,it increased $714 million, or 33% in comparison to
2014. This increments are due to heavy increase in expenses related to data centers &
infrastructure and due to higher costs associated ads payment & various other partnership
agreements (Bhattacharyya, 2011).
Coming to net profit analysis, Facebook Inc. Shows a net profit % of 36.97 which is
way more than 20. 57% in 2015 & 23.58% in 2014. If we compare it with the % in
the technology, the net profit is 19.17%, 17.86% & 18.41% for the yead ended 31st
December, 2016,2015 & 2014. Thus, while the technology shows not much changes
in the %, Facebook shows a good increment of profit. When comparing it with its
competitors in the technology, no other competitor shows a net profit % more than
21%. Thus, the increment in the technology % is majorly due to Favebook
Inc,showing a good sign of its financial position (Berman, Knight and Case, 2013).
Comparison to Technology Industry
Facebook Inc., net profit margin, long-term trends, comparison to
Technology industry
31st
December,2016
31st
December,2015
31st
December,2014
Facebook Inc. 36.97% 20.57% 23.58%
Technology
Industry 19.17% 17.86% 18.41%
⊘ This is a preview!⊘
Do you want full access?
Subscribe today to unlock all pages.
Trusted by 1+ million students worldwide
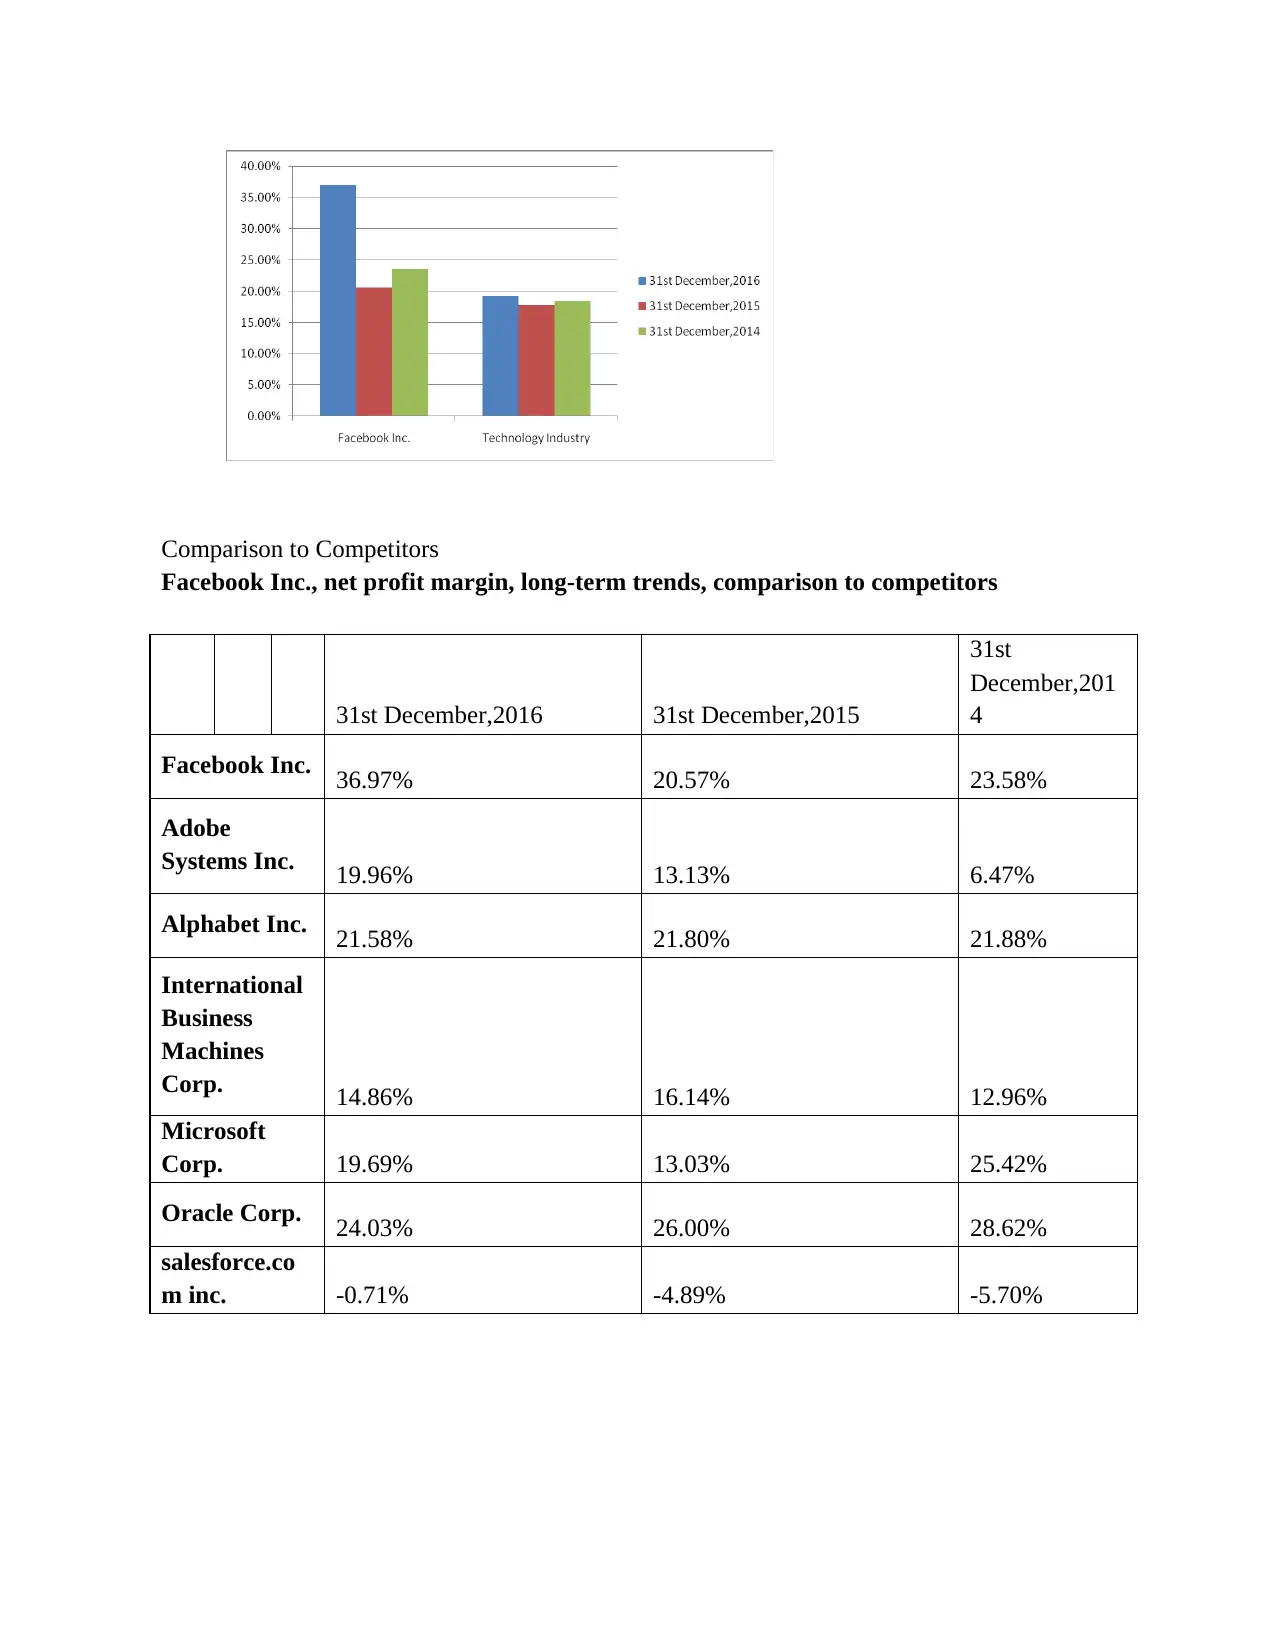
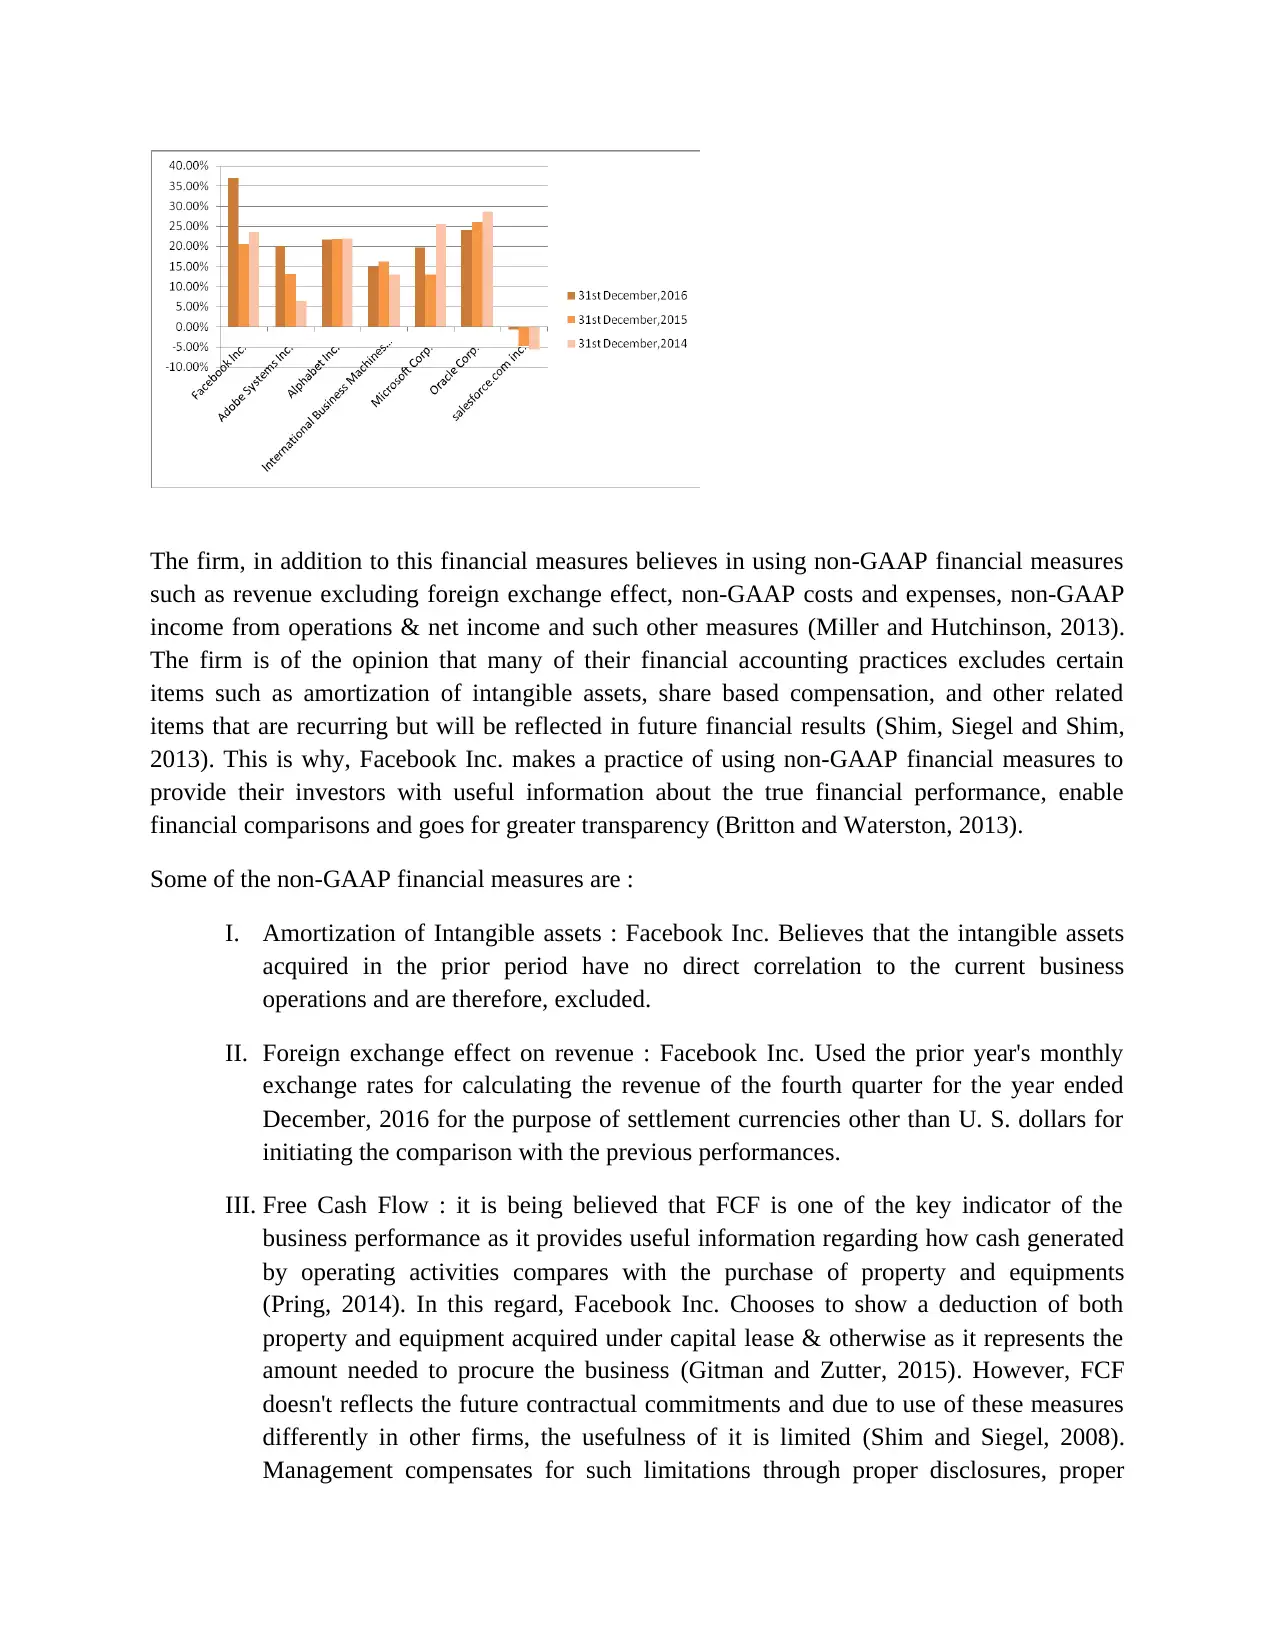
Comparison to Competitors
Facebook Inc., net profit margin, long-term trends, comparison to competitors
31st December,2016 31st December,2015
31st
December,201
4
Facebook Inc. 36.97% 20.57% 23.58%
Adobe
Systems Inc. 19.96% 13.13% 6.47%
Alphabet Inc. 21.58% 21.80% 21.88%
International
Business
Machines
Corp. 14.86% 16.14% 12.96%
Microsoft
Corp. 19.69% 13.03% 25.42%
Oracle Corp. 24.03% 26.00% 28.62%
salesforce.co
m inc. -0.71% -4.89% -5.70%
Paraphrase This Document
Need a fresh take? Get an instant paraphrase of this document with our AI Paraphraser
The firm, in addition to this financial measures believes in using non-GAAP financial measures
such as revenue excluding foreign exchange effect, non-GAAP costs and expenses, non-GAAP
income from operations & net income and such other measures (Miller and Hutchinson, 2013).
The firm is of the opinion that many of their financial accounting practices excludes certain
items such as amortization of intangible assets, share based compensation, and other related
items that are recurring but will be reflected in future financial results (Shim, Siegel and Shim,
2013). This is why, Facebook Inc. makes a practice of using non-GAAP financial measures to
provide their investors with useful information about the true financial performance, enable
financial comparisons and goes for greater transparency (Britton and Waterston, 2013).
Some of the non-GAAP financial measures are :
I. Amortization of Intangible assets : Facebook Inc. Believes that the intangible assets
acquired in the prior period have no direct correlation to the current business
operations and are therefore, excluded.
II. Foreign exchange effect on revenue : Facebook Inc. Used the prior year's monthly
exchange rates for calculating the revenue of the fourth quarter for the year ended
December, 2016 for the purpose of settlement currencies other than U. S. dollars for
initiating the comparison with the previous performances.
III. Free Cash Flow : it is being believed that FCF is one of the key indicator of the
business performance as it provides useful information regarding how cash generated
by operating activities compares with the purchase of property and equipments
(Pring, 2014). In this regard, Facebook Inc. Chooses to show a deduction of both
property and equipment acquired under capital lease & otherwise as it represents the
amount needed to procure the business (Gitman and Zutter, 2015). However, FCF
doesn't reflects the future contractual commitments and due to use of these measures
differently in other firms, the usefulness of it is limited (Shim and Siegel, 2008).
Management compensates for such limitations through proper disclosures, proper
financial statements in accordance with GAAP, and reconciliation of FCF to the most
directly comparable GAAP (Salvatore, 2012).
directly comparable GAAP (Salvatore, 2012).
⊘ This is a preview!⊘
Do you want full access?
Subscribe today to unlock all pages.
Trusted by 1+ million students worldwide
1 out of 18
Related Documents


Your All-in-One AI-Powered Toolkit for Academic Success.
+13062052269
info@desklib.com
Available 24*7 on WhatsApp / Email
![[object Object]](/_next/static/media/star-bottom.7253800d.svg)
Unlock your academic potential
Copyright © 2020–2026 A2Z Services. All Rights Reserved. Developed and managed by ZUCOL.