Facebook Financial Analysis Report
VerifiedAdded on 2019/09/18
|15
|3458
|327
Report
AI Summary
This report provides a comprehensive financial analysis of Facebook Inc., covering a five-year period. The analysis includes liquidity ratios (current and quick ratios), profitability ratios (operating margin, net profit margin, ROE, and ROA), efficiency ratios (receivable turnover, fixed asset turnover, and asset turnover), and capital structure analysis (debt/equity and times interest coverage). The report also examines Facebook's stock market performance, including price changes and valuation ratios (P/E, price-to-sales, price-to-book, and price-to-cash flow). A comparative analysis against industry averages is conducted throughout. The report concludes with limitations of the analysis (lack of qualitative analysis and future strategy assessment) and recommendations for Facebook, focusing on improving efficiency, receivables management, asset utilization, and cost control to maintain and enhance profitability and stock performance.
Running Head: FACEBOOK ANALYSIS
Assignment Title
Student Name
Student Number
Course Name
Instructor Name
Date
1
Assignment Title
Student Name
Student Number
Course Name
Instructor Name
Date
1
Paraphrase This Document
Need a fresh take? Get an instant paraphrase of this document with our AI Paraphraser
FACEBOOK ANALYSIS
Table of Contents
Introduction......................................................................................................................................3
Financial Performance Analysis......................................................................................................3
Liquidity Analysis.......................................................................................................................4
Profitability..................................................................................................................................5
Efficiency.....................................................................................................................................7
Capital Structure..........................................................................................................................9
Stock Market Performance........................................................................................................10
Problems or Limitation..................................................................................................................11
Recommendation...........................................................................................................................12
Conclusion.....................................................................................................................................13
Reference.......................................................................................................................................14
2
FACEBOOK ANALYSIS
Introduction
Facebook Inc., is a company that falls under the Internet information providing industry
was incorporated on 29, July 2004 (Yahoo Finance, n.d.). Facebook focuses on building products
that would make people connect with each other using a computer, mobile or any other devices
(Reuters, n.d.). The Company provides a safe and secured platform to share their personal and
professional information with others across the world and provides all world information to
them. The product of the company includes Facebook, WhatsApp, Instagram, Oculus, and
Messengers (Weinberger, 2015). They provide platforms that are extensively used by various
companies for marketing their products, and they generate revenue by selling advertisement
placements to marketers. Facebook is popular around the world and is used by millions of people
across the globe. In this paper, there is a detailed financial analysis performed to know about the
financial performed of Facebook and recommendations are provided for improving them.
Financial Performance Analysis
It is essential to make a comparative financial analysis using the historical financial
information of the company. In this case, the five-year financial ratio is taken into consideration
for making an analysis of the financial performance and position of the company (Horngren,
Harrison and Oliver, 2011). There are industrial data available for the company that is used for
making a comparative analysis so an appropriate evaluation of the financial performance of
Facebook can be performed. In this section, there is a detailed analysis of liquidity, profitability,
efficiency, capital structure and stock performance of the company over the past five years.
3
⊘ This is a preview!⊘
Do you want full access?
Subscribe today to unlock all pages.
Trusted by 1+ million students worldwide
FACEBOOK ANALYSIS
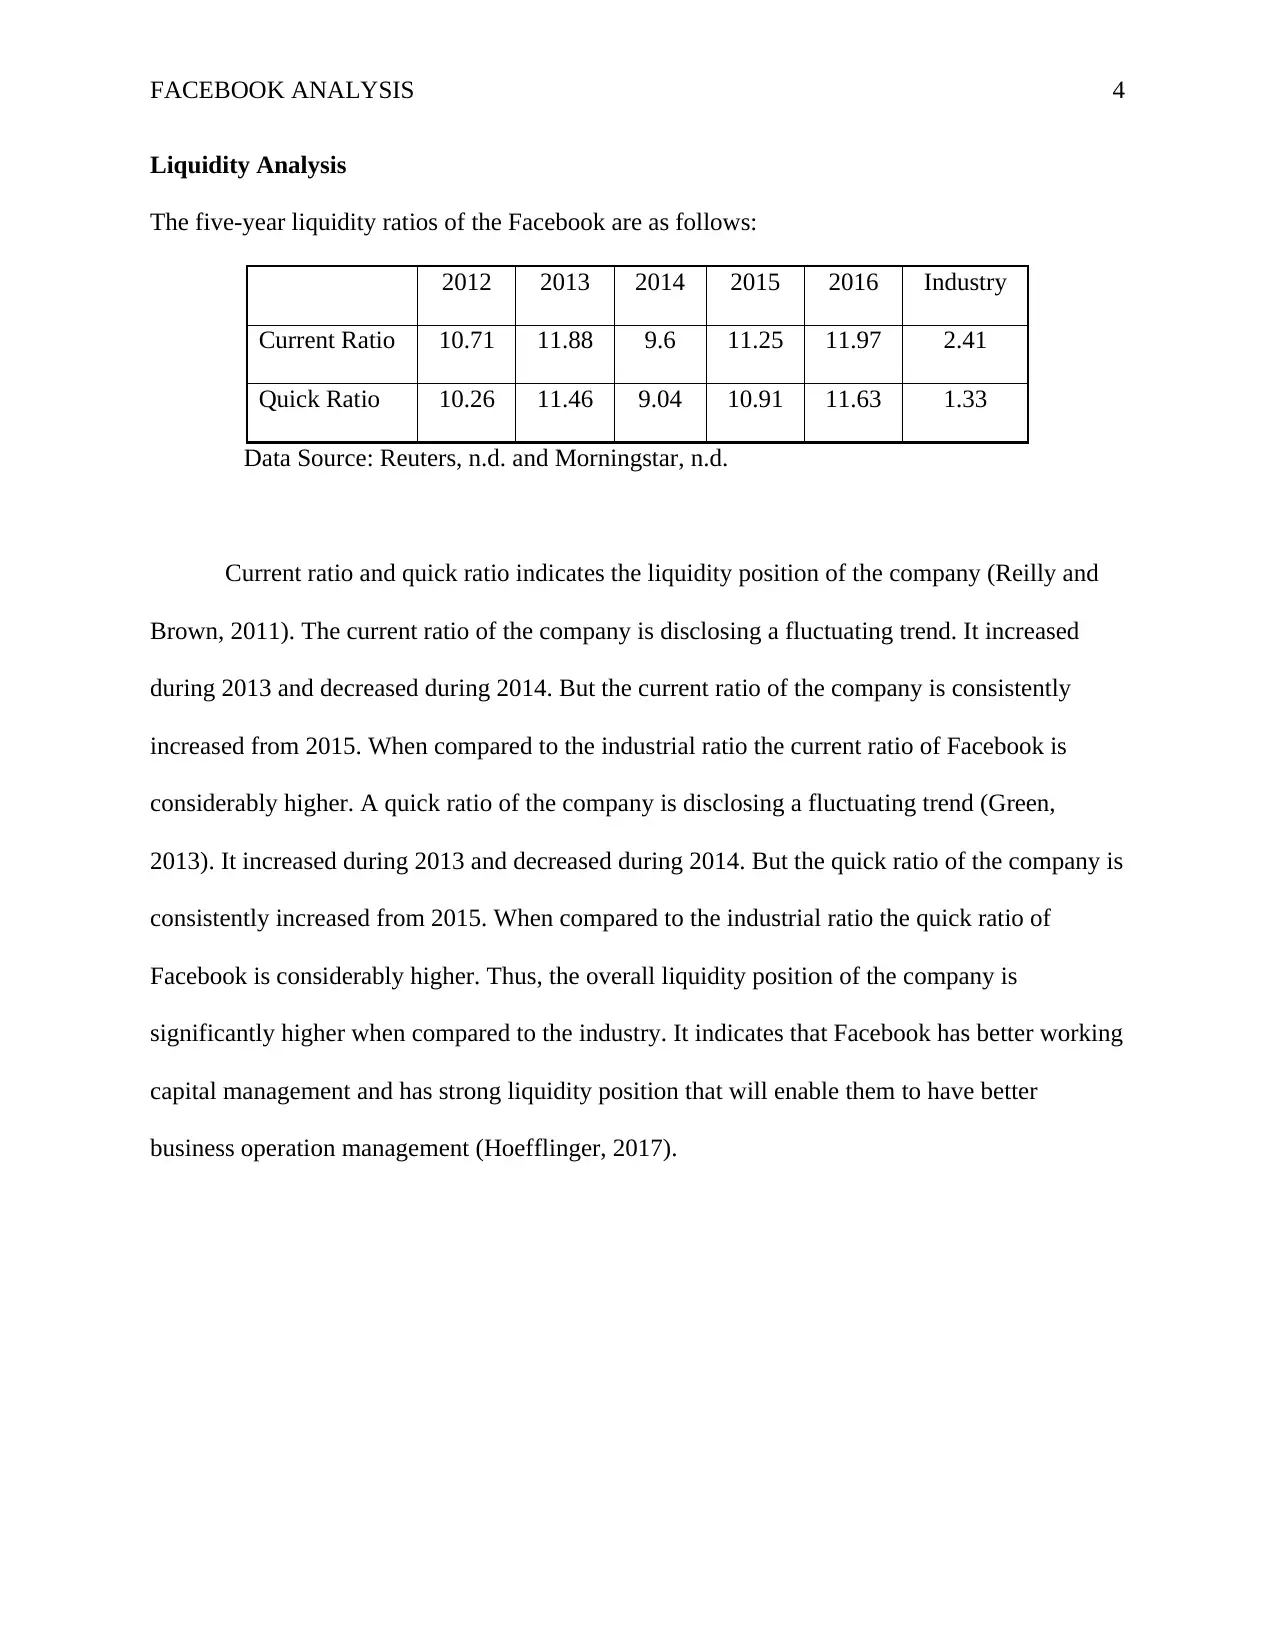
Liquidity Analysis
The five-year liquidity ratios of the Facebook are as follows:
2012 2013 2014 2015 2016 Industry
Current Ratio 10.71 11.88 9.6 11.25 11.97 2.41
Quick Ratio 10.26 11.46 9.04 10.91 11.63 1.33
Data Source: Reuters, n.d. and Morningstar, n.d.
Current ratio and quick ratio indicates the liquidity position of the company (Reilly and
Brown, 2011). The current ratio of the company is disclosing a fluctuating trend. It increased
during 2013 and decreased during 2014. But the current ratio of the company is consistently
increased from 2015. When compared to the industrial ratio the current ratio of Facebook is
considerably higher. A quick ratio of the company is disclosing a fluctuating trend (Green,
2013). It increased during 2013 and decreased during 2014. But the quick ratio of the company is
consistently increased from 2015. When compared to the industrial ratio the quick ratio of
Facebook is considerably higher. Thus, the overall liquidity position of the company is
significantly higher when compared to the industry. It indicates that Facebook has better working
capital management and has strong liquidity position that will enable them to have better
business operation management (Hoefflinger, 2017).
4
Paraphrase This Document
Need a fresh take? Get an instant paraphrase of this document with our AI Paraphraser
FACEBOOK ANALYSIS
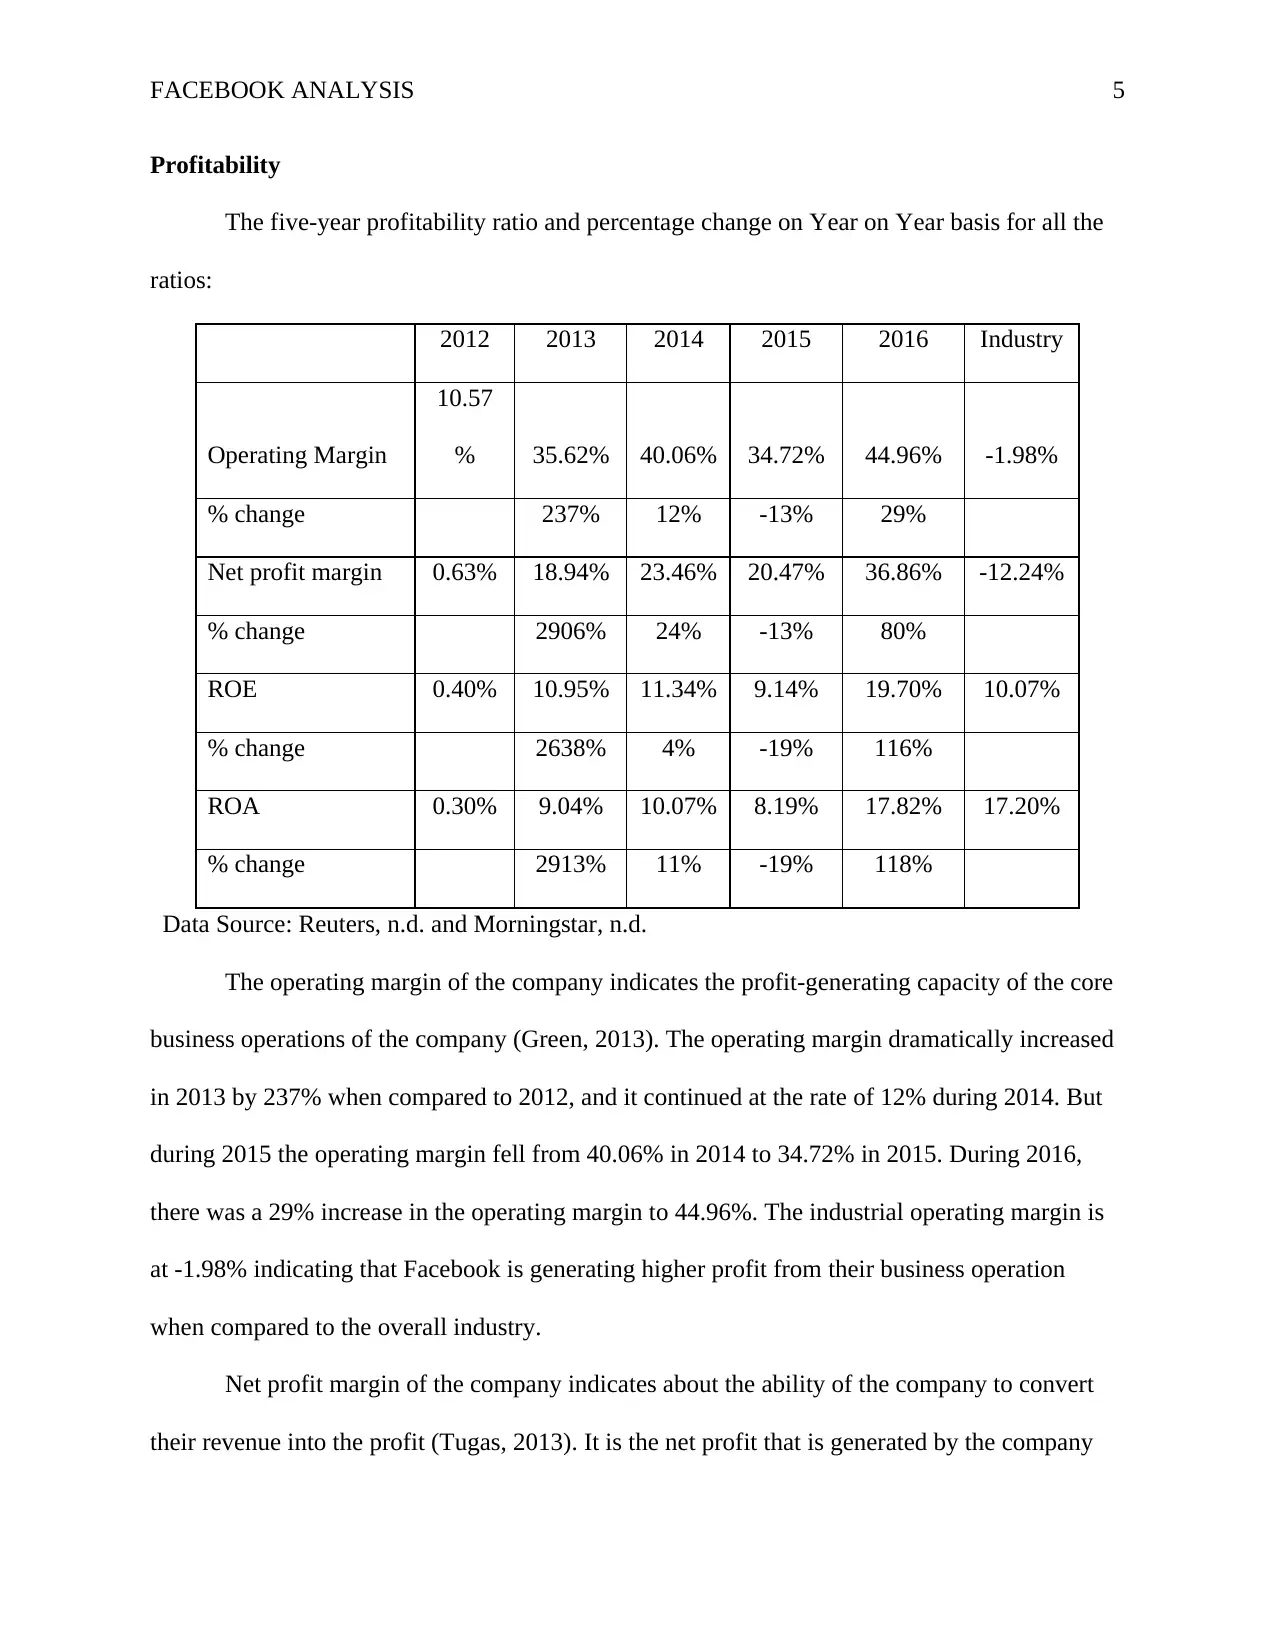
Profitability
The five-year profitability ratio and percentage change on Year on Year basis for all the
ratios:
2012 2013 2014 2015 2016 Industry
Operating Margin
10.57
% 35.62% 40.06% 34.72% 44.96% -1.98%
% change 237% 12% -13% 29%
Net profit margin 0.63% 18.94% 23.46% 20.47% 36.86% -12.24%
% change 2906% 24% -13% 80%
ROE 0.40% 10.95% 11.34% 9.14% 19.70% 10.07%
% change 2638% 4% -19% 116%
ROA 0.30% 9.04% 10.07% 8.19% 17.82% 17.20%
% change 2913% 11% -19% 118%
Data Source: Reuters, n.d. and Morningstar, n.d.
The operating margin of the company indicates the profit-generating capacity of the core
business operations of the company (Green, 2013). The operating margin dramatically increased
in 2013 by 237% when compared to 2012, and it continued at the rate of 12% during 2014. But
during 2015 the operating margin fell from 40.06% in 2014 to 34.72% in 2015. During 2016,
there was a 29% increase in the operating margin to 44.96%. The industrial operating margin is
at -1.98% indicating that Facebook is generating higher profit from their business operation
when compared to the overall industry.
Net profit margin of the company indicates about the ability of the company to convert
their revenue into the profit (Tugas, 2013). It is the net profit that is generated by the company
5
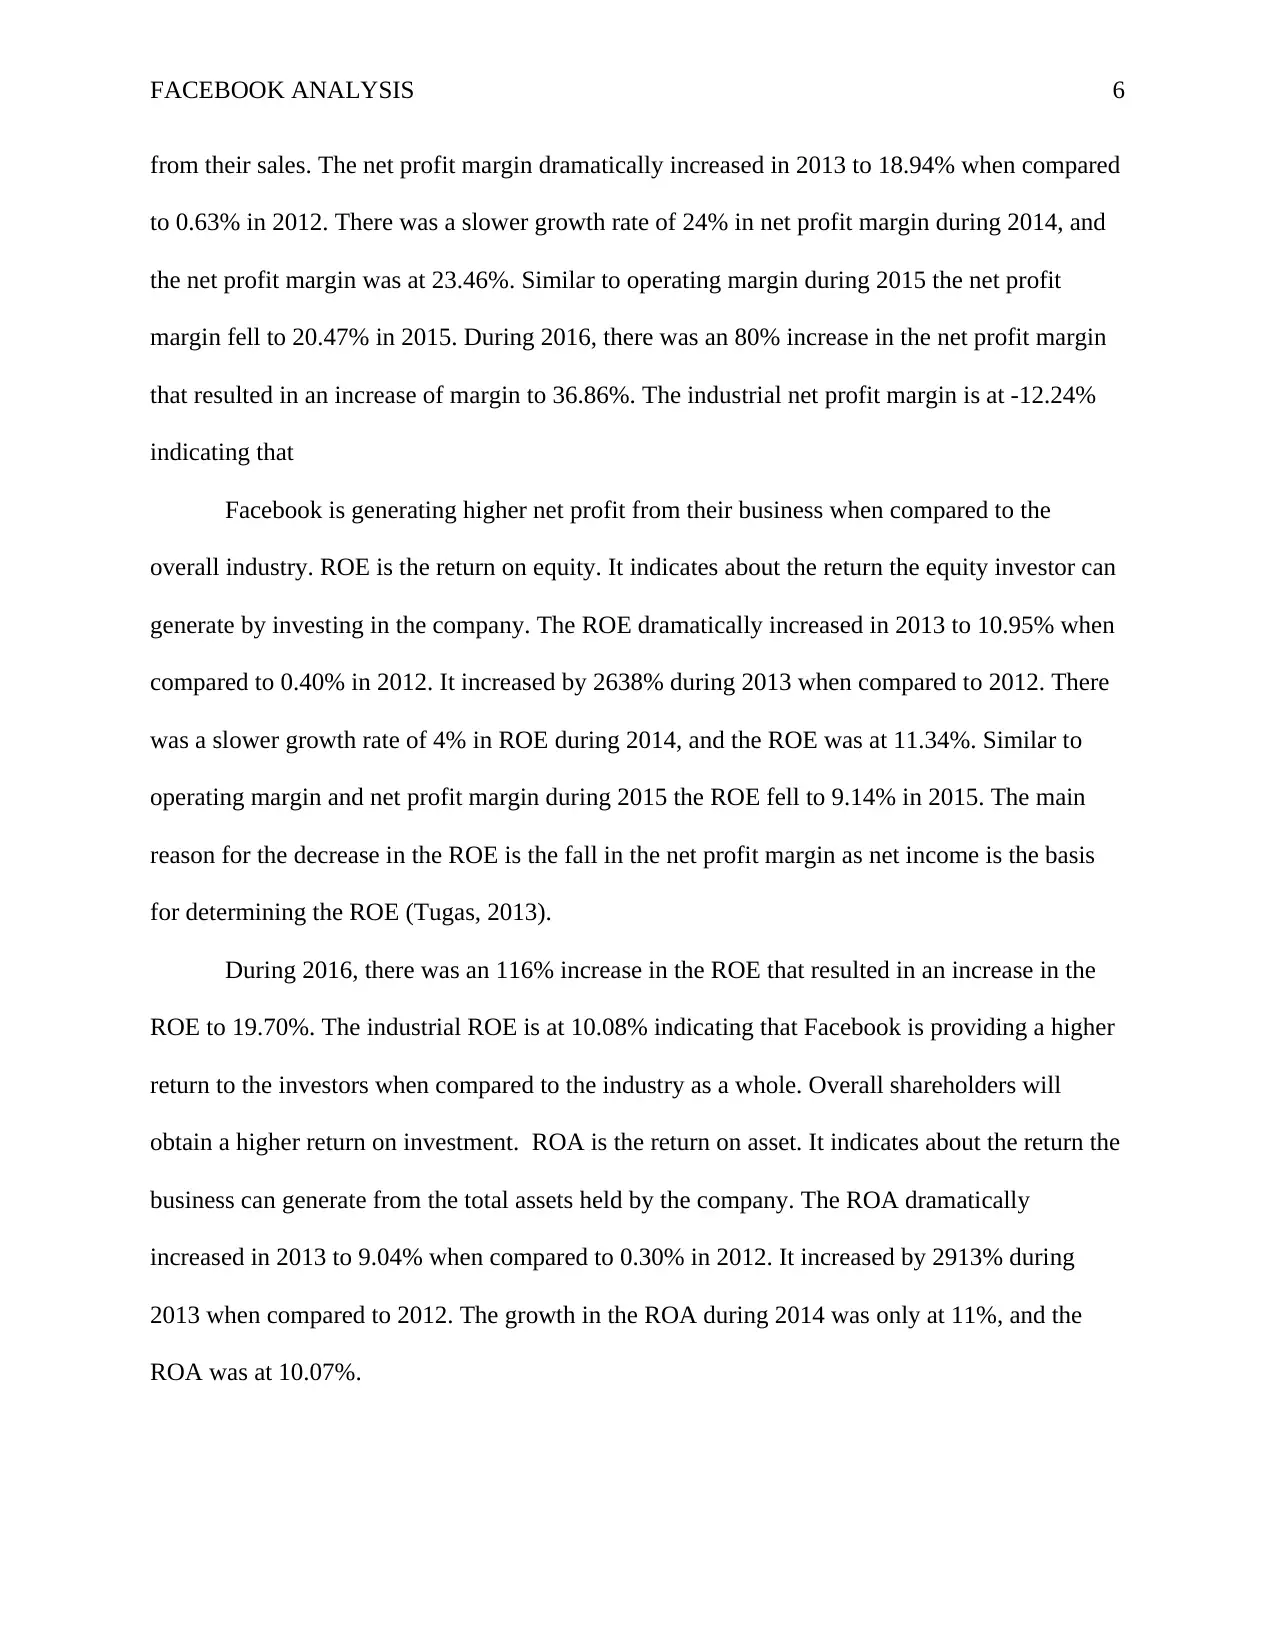
FACEBOOK ANALYSIS
from their sales. The net profit margin dramatically increased in 2013 to 18.94% when compared
to 0.63% in 2012. There was a slower growth rate of 24% in net profit margin during 2014, and
the net profit margin was at 23.46%. Similar to operating margin during 2015 the net profit
margin fell to 20.47% in 2015. During 2016, there was an 80% increase in the net profit margin
that resulted in an increase of margin to 36.86%. The industrial net profit margin is at -12.24%
indicating that
Facebook is generating higher net profit from their business when compared to the
overall industry. ROE is the return on equity. It indicates about the return the equity investor can
generate by investing in the company. The ROE dramatically increased in 2013 to 10.95% when
compared to 0.40% in 2012. It increased by 2638% during 2013 when compared to 2012. There
was a slower growth rate of 4% in ROE during 2014, and the ROE was at 11.34%. Similar to
operating margin and net profit margin during 2015 the ROE fell to 9.14% in 2015. The main
reason for the decrease in the ROE is the fall in the net profit margin as net income is the basis
for determining the ROE (Tugas, 2013).
During 2016, there was an 116% increase in the ROE that resulted in an increase in the
ROE to 19.70%. The industrial ROE is at 10.08% indicating that Facebook is providing a higher
return to the investors when compared to the industry as a whole. Overall shareholders will
obtain a higher return on investment. ROA is the return on asset. It indicates about the return the
business can generate from the total assets held by the company. The ROA dramatically
increased in 2013 to 9.04% when compared to 0.30% in 2012. It increased by 2913% during
2013 when compared to 2012. The growth in the ROA during 2014 was only at 11%, and the
ROA was at 10.07%.
6
⊘ This is a preview!⊘
Do you want full access?
Subscribe today to unlock all pages.
Trusted by 1+ million students worldwide
FACEBOOK ANALYSIS
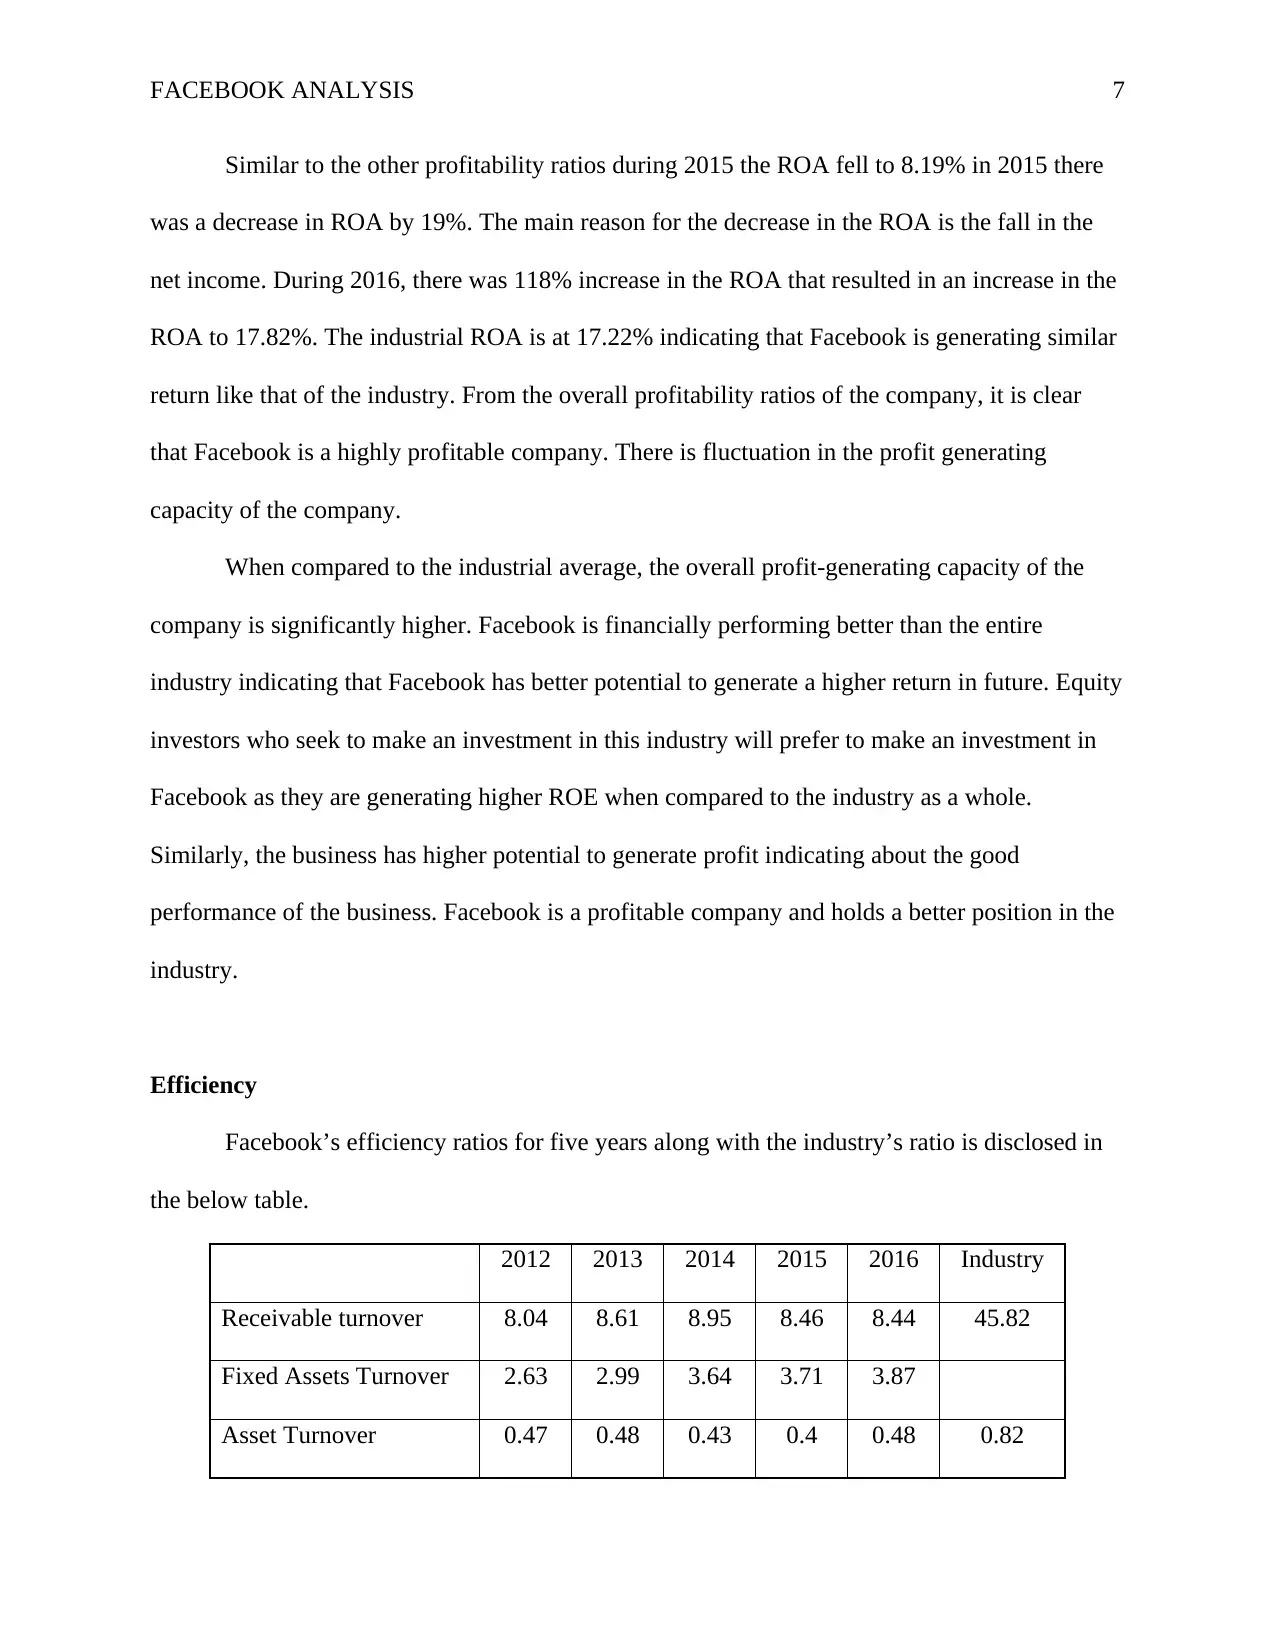
Similar to the other profitability ratios during 2015 the ROA fell to 8.19% in 2015 there
was a decrease in ROA by 19%. The main reason for the decrease in the ROA is the fall in the
net income. During 2016, there was 118% increase in the ROA that resulted in an increase in the
ROA to 17.82%. The industrial ROA is at 17.22% indicating that Facebook is generating similar
return like that of the industry. From the overall profitability ratios of the company, it is clear
that Facebook is a highly profitable company. There is fluctuation in the profit generating
capacity of the company.
When compared to the industrial average, the overall profit-generating capacity of the
company is significantly higher. Facebook is financially performing better than the entire
industry indicating that Facebook has better potential to generate a higher return in future. Equity
investors who seek to make an investment in this industry will prefer to make an investment in
Facebook as they are generating higher ROE when compared to the industry as a whole.
Similarly, the business has higher potential to generate profit indicating about the good
performance of the business. Facebook is a profitable company and holds a better position in the
industry.
Efficiency
Facebook’s efficiency ratios for five years along with the industry’s ratio is disclosed in
the below table.
2012 2013 2014 2015 2016 Industry
Receivable turnover 8.04 8.61 8.95 8.46 8.44 45.82
Fixed Assets Turnover 2.63 2.99 3.64 3.71 3.87
Asset Turnover 0.47 0.48 0.43 0.4 0.48 0.82
7
Paraphrase This Document
Need a fresh take? Get an instant paraphrase of this document with our AI Paraphraser
FACEBOOK ANALYSIS
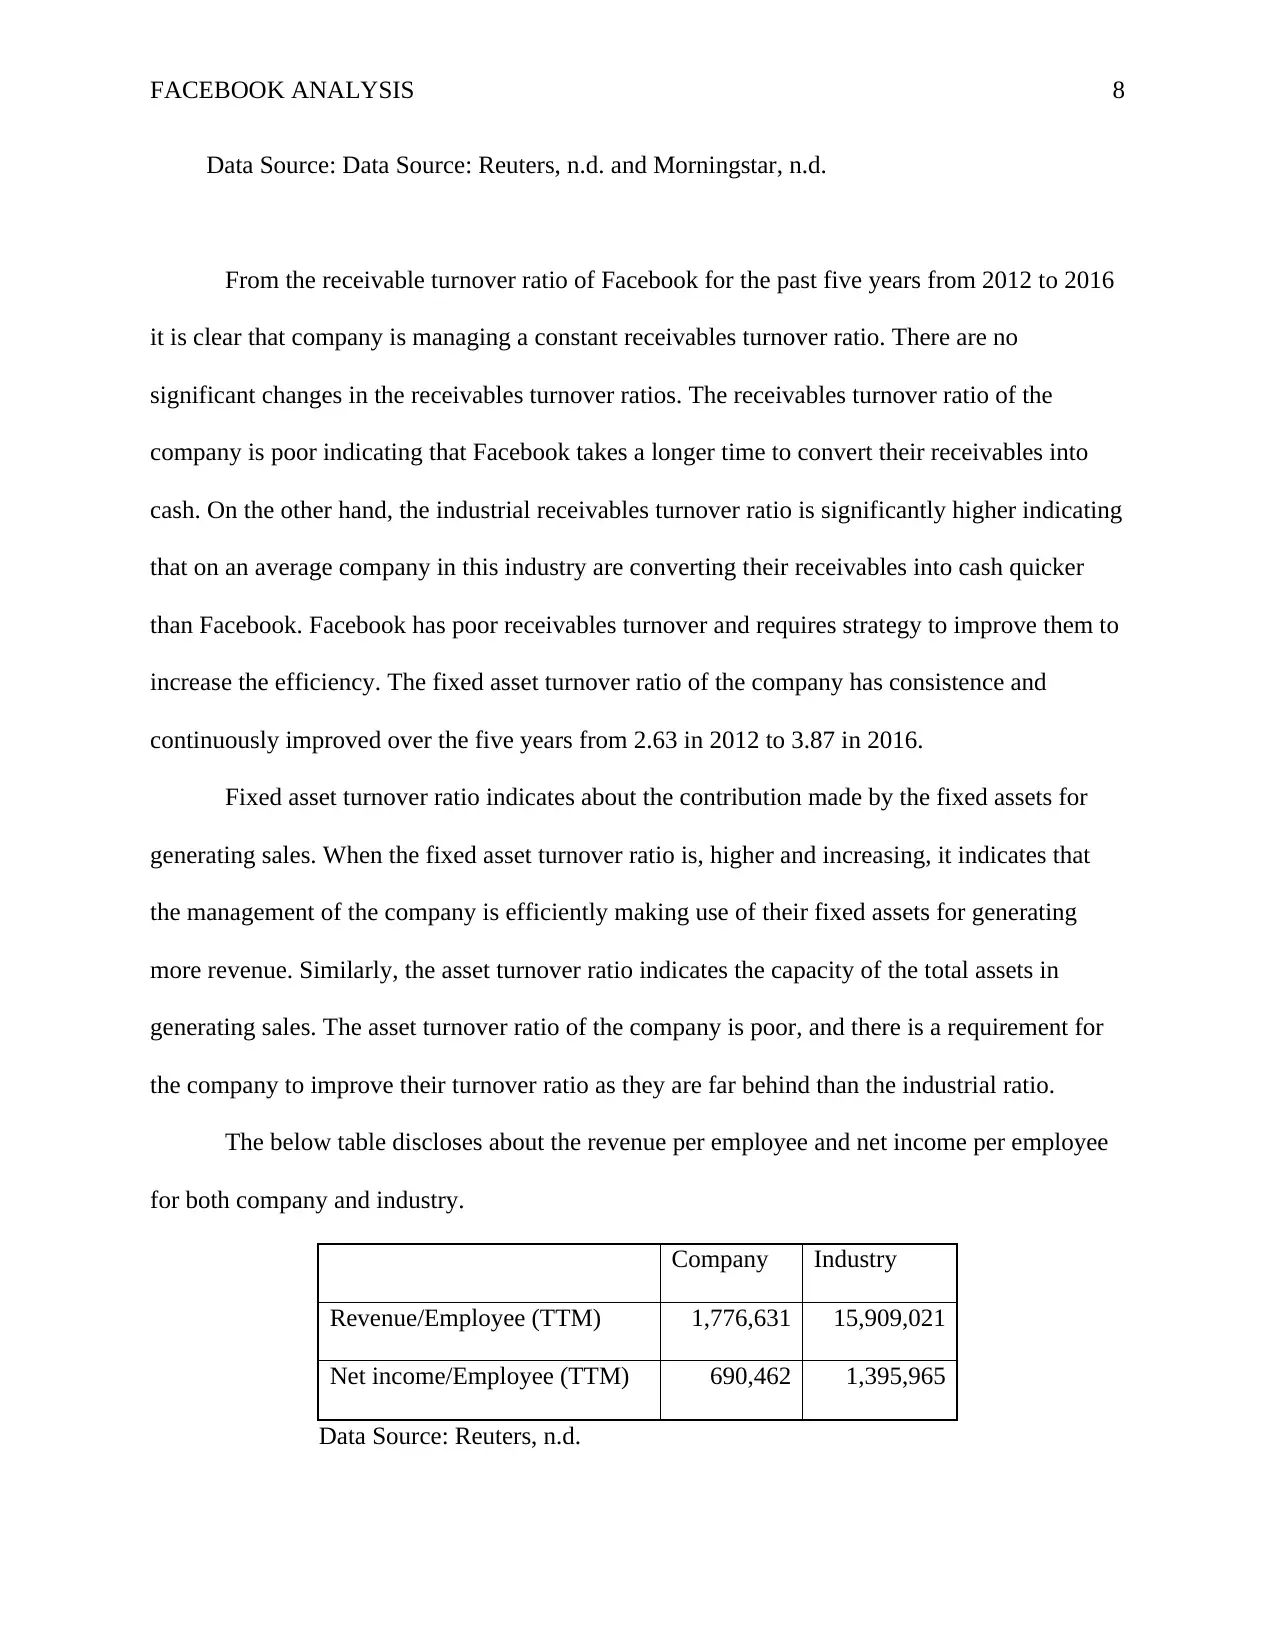
Data Source: Data Source: Reuters, n.d. and Morningstar, n.d.
From the receivable turnover ratio of Facebook for the past five years from 2012 to 2016
it is clear that company is managing a constant receivables turnover ratio. There are no
significant changes in the receivables turnover ratios. The receivables turnover ratio of the
company is poor indicating that Facebook takes a longer time to convert their receivables into
cash. On the other hand, the industrial receivables turnover ratio is significantly higher indicating
that on an average company in this industry are converting their receivables into cash quicker
than Facebook. Facebook has poor receivables turnover and requires strategy to improve them to
increase the efficiency. The fixed asset turnover ratio of the company has consistence and
continuously improved over the five years from 2.63 in 2012 to 3.87 in 2016.
Fixed asset turnover ratio indicates about the contribution made by the fixed assets for
generating sales. When the fixed asset turnover ratio is, higher and increasing, it indicates that
the management of the company is efficiently making use of their fixed assets for generating
more revenue. Similarly, the asset turnover ratio indicates the capacity of the total assets in
generating sales. The asset turnover ratio of the company is poor, and there is a requirement for
the company to improve their turnover ratio as they are far behind than the industrial ratio.
The below table discloses about the revenue per employee and net income per employee
for both company and industry.
Company Industry
Revenue/Employee (TTM) 1,776,631 15,909,021
Net income/Employee (TTM) 690,462 1,395,965
Data Source: Reuters, n.d.
8
FACEBOOK ANALYSIS
From the table, it is clear that the company is competitive in generating higher revenue
and net income per employee. The overall business efficiency of Facebook is below average
when compared to the industry.
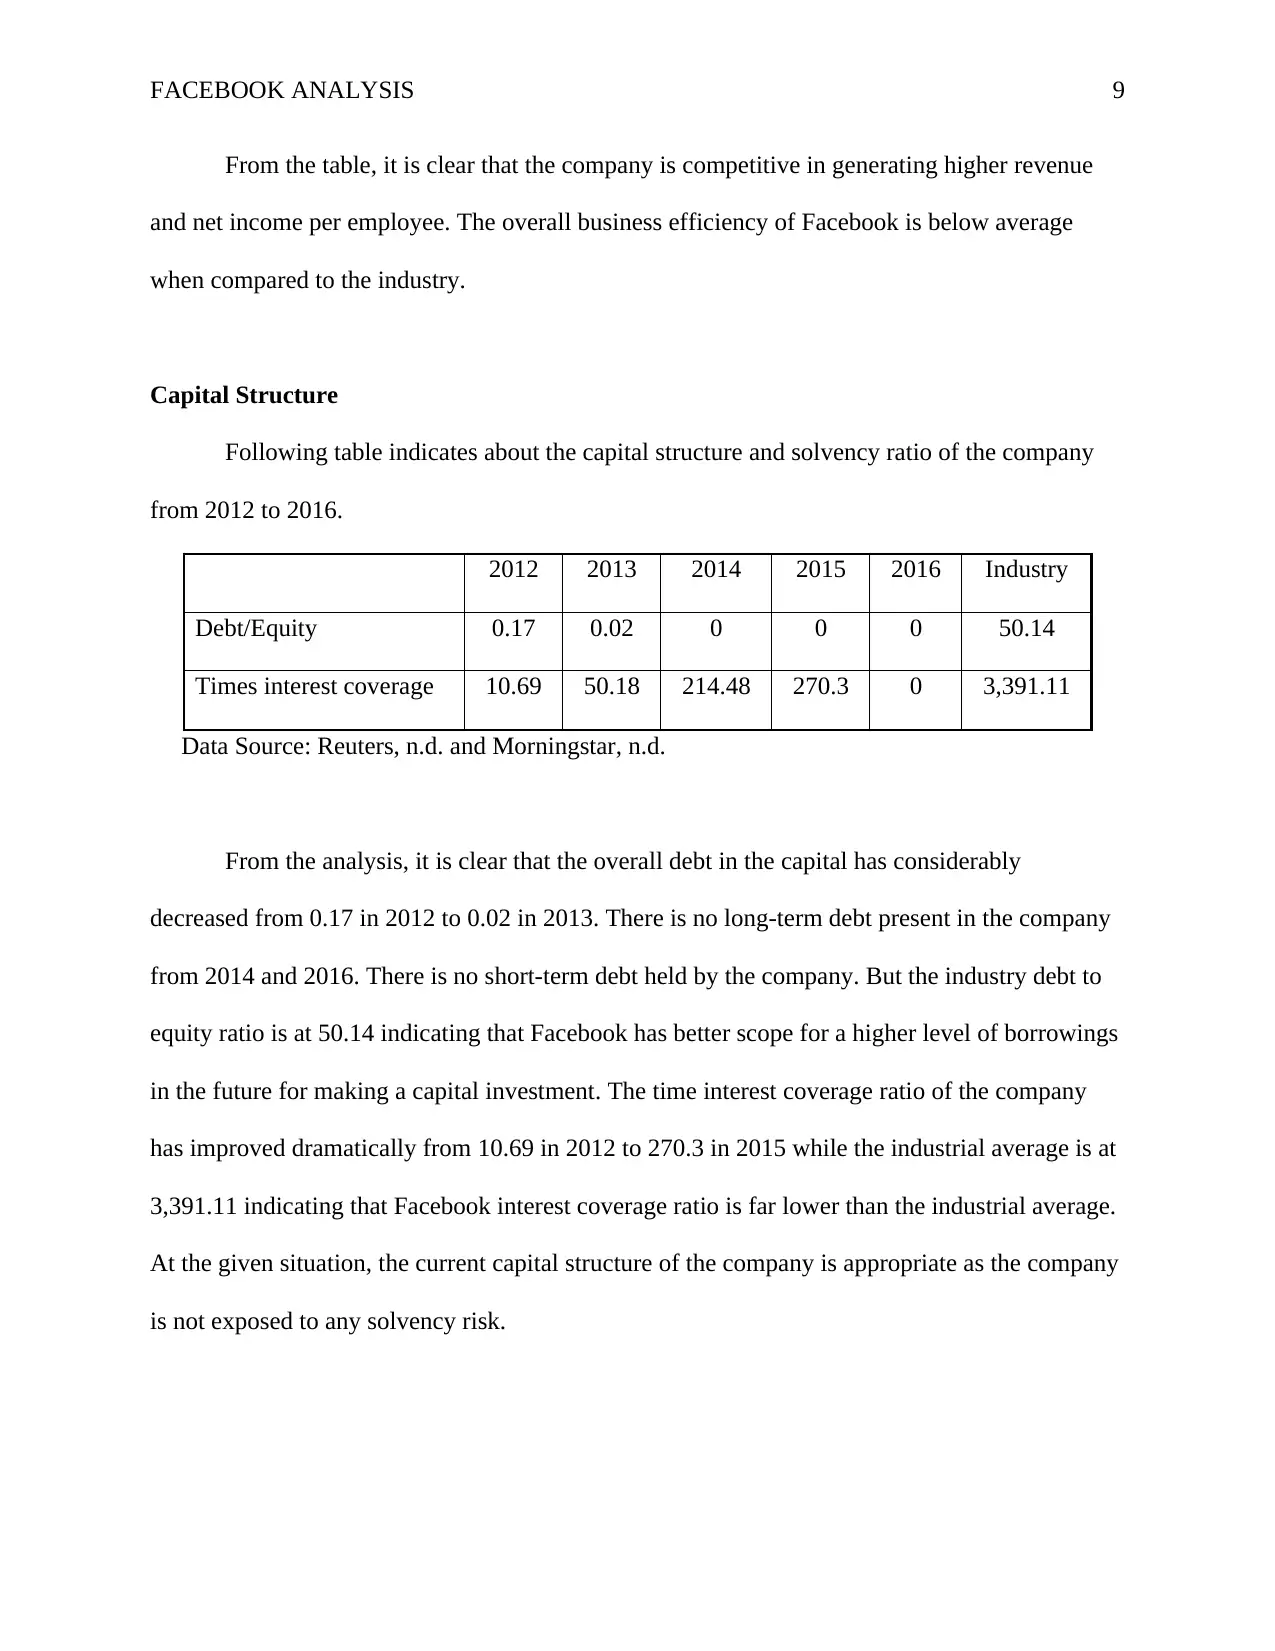
Capital Structure
Following table indicates about the capital structure and solvency ratio of the company
from 2012 to 2016.
2012 2013 2014 2015 2016 Industry
Debt/Equity 0.17 0.02 0 0 0 50.14
Times interest coverage 10.69 50.18 214.48 270.3 0 3,391.11
Data Source: Reuters, n.d. and Morningstar, n.d.
From the analysis, it is clear that the overall debt in the capital has considerably
decreased from 0.17 in 2012 to 0.02 in 2013. There is no long-term debt present in the company
from 2014 and 2016. There is no short-term debt held by the company. But the industry debt to
equity ratio is at 50.14 indicating that Facebook has better scope for a higher level of borrowings
in the future for making a capital investment. The time interest coverage ratio of the company
has improved dramatically from 10.69 in 2012 to 270.3 in 2015 while the industrial average is at
3,391.11 indicating that Facebook interest coverage ratio is far lower than the industrial average.
At the given situation, the current capital structure of the company is appropriate as the company
is not exposed to any solvency risk.
9
From the table, it is clear that the company is competitive in generating higher revenue
and net income per employee. The overall business efficiency of Facebook is below average
when compared to the industry.
Capital Structure
Following table indicates about the capital structure and solvency ratio of the company
from 2012 to 2016.
2012 2013 2014 2015 2016 Industry
Debt/Equity 0.17 0.02 0 0 0 50.14
Times interest coverage 10.69 50.18 214.48 270.3 0 3,391.11
Data Source: Reuters, n.d. and Morningstar, n.d.
From the analysis, it is clear that the overall debt in the capital has considerably
decreased from 0.17 in 2012 to 0.02 in 2013. There is no long-term debt present in the company
from 2014 and 2016. There is no short-term debt held by the company. But the industry debt to
equity ratio is at 50.14 indicating that Facebook has better scope for a higher level of borrowings
in the future for making a capital investment. The time interest coverage ratio of the company
has improved dramatically from 10.69 in 2012 to 270.3 in 2015 while the industrial average is at
3,391.11 indicating that Facebook interest coverage ratio is far lower than the industrial average.
At the given situation, the current capital structure of the company is appropriate as the company
is not exposed to any solvency risk.
9
⊘ This is a preview!⊘
Do you want full access?
Subscribe today to unlock all pages.
Trusted by 1+ million students worldwide
FACEBOOK ANALYSIS
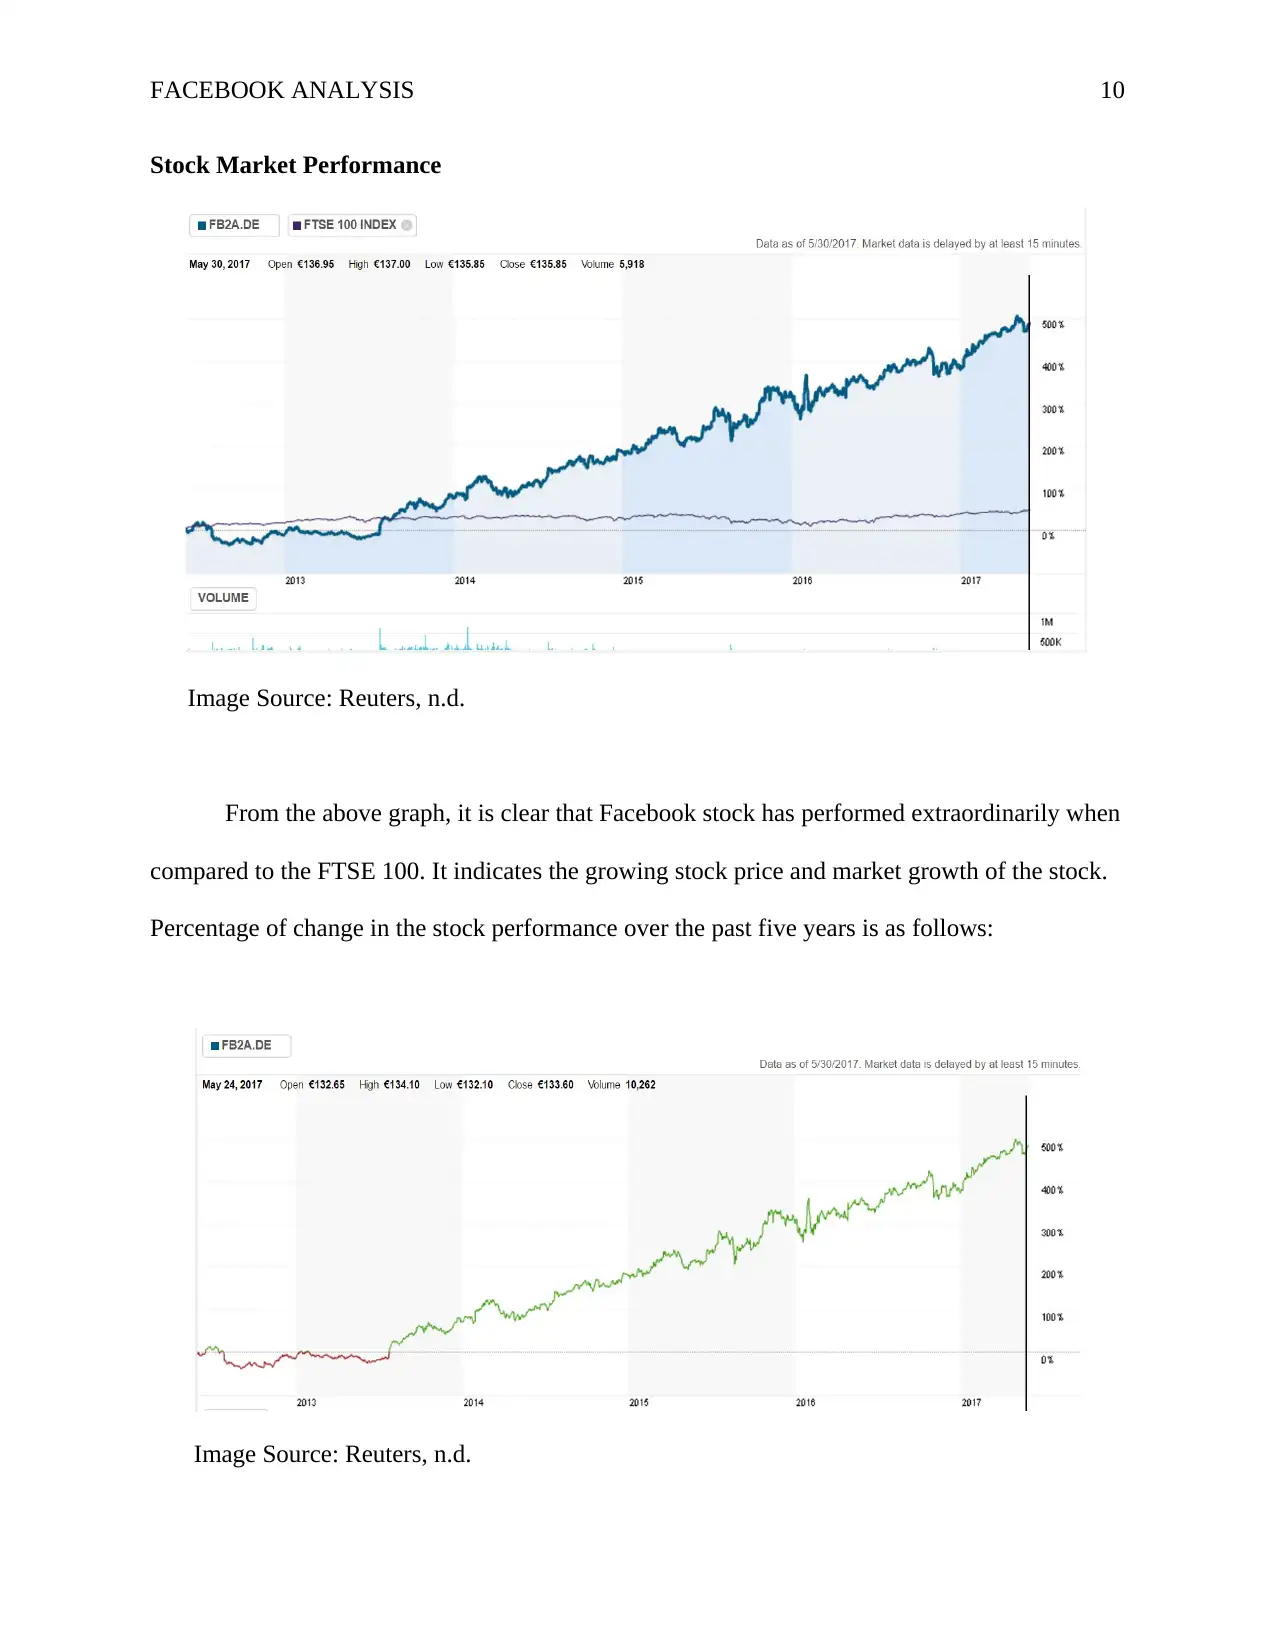
Stock Market Performance
Image Source: Reuters, n.d.
From the above graph, it is clear that Facebook stock has performed extraordinarily when
compared to the FTSE 100. It indicates the growing stock price and market growth of the stock.
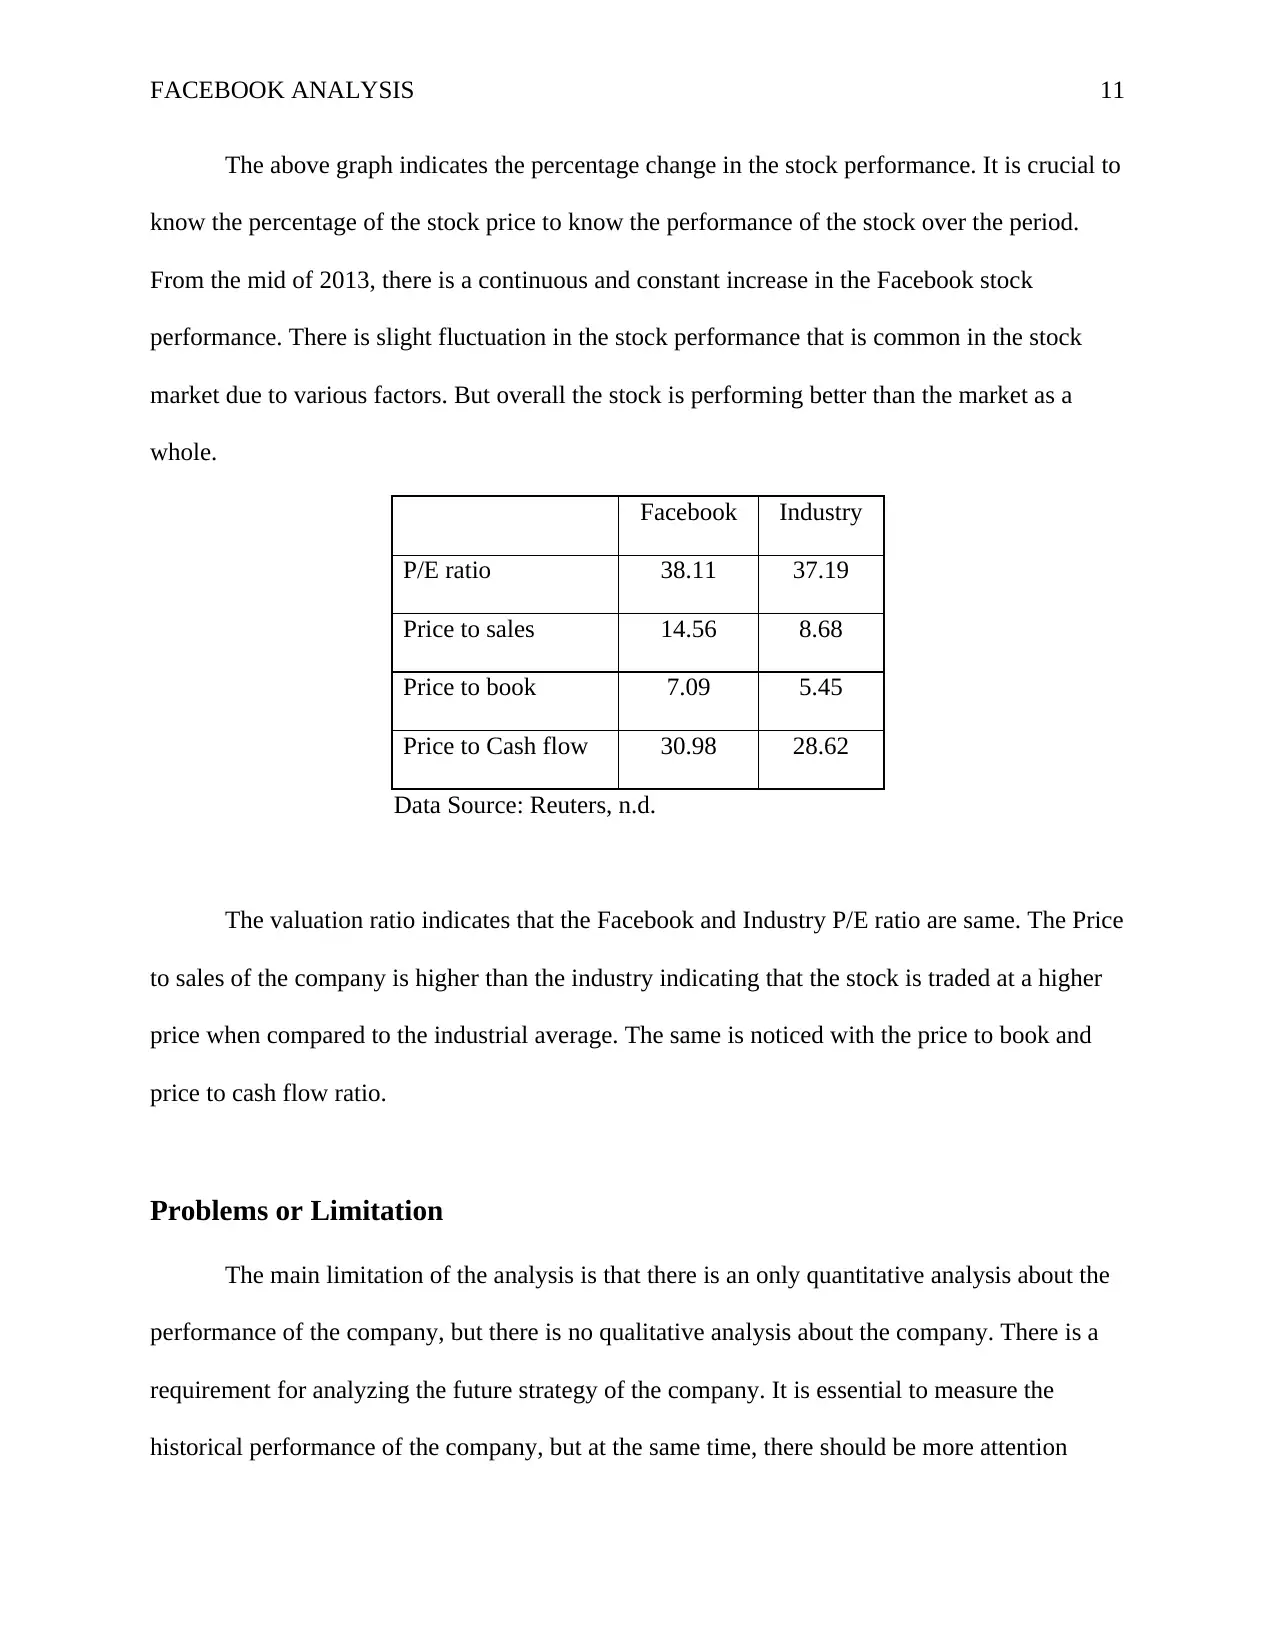
Percentage of change in the stock performance over the past five years is as follows:
Image Source: Reuters, n.d.
10
Stock Market Performance
Image Source: Reuters, n.d.
From the above graph, it is clear that Facebook stock has performed extraordinarily when
compared to the FTSE 100. It indicates the growing stock price and market growth of the stock.
Percentage of change in the stock performance over the past five years is as follows:
Image Source: Reuters, n.d.
10
Paraphrase This Document
Need a fresh take? Get an instant paraphrase of this document with our AI Paraphraser
FACEBOOK ANALYSIS
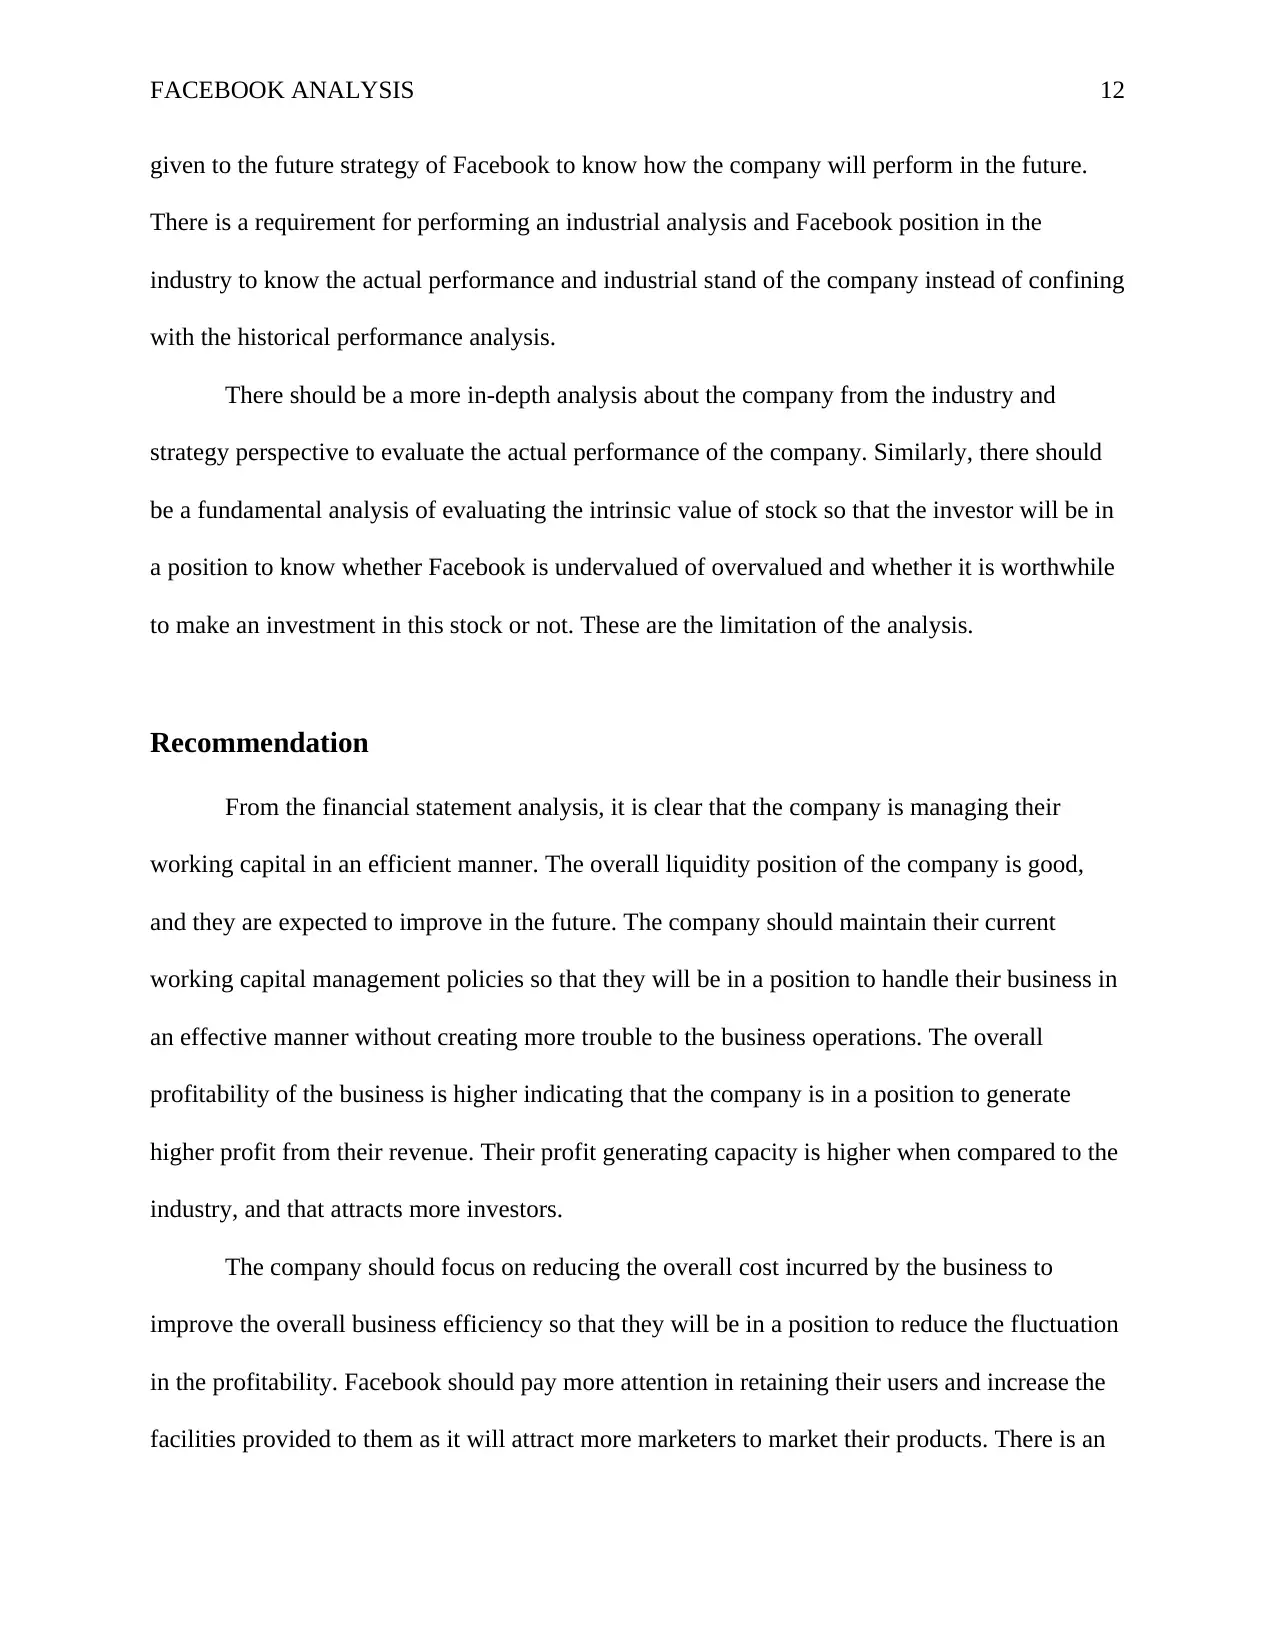
The above graph indicates the percentage change in the stock performance. It is crucial to
know the percentage of the stock price to know the performance of the stock over the period.
From the mid of 2013, there is a continuous and constant increase in the Facebook stock
performance. There is slight fluctuation in the stock performance that is common in the stock
market due to various factors. But overall the stock is performing better than the market as a
whole.
Facebook Industry
P/E ratio 38.11 37.19
Price to sales 14.56 8.68
Price to book 7.09 5.45
Price to Cash flow 30.98 28.62
Data Source: Reuters, n.d.
The valuation ratio indicates that the Facebook and Industry P/E ratio are same. The Price
to sales of the company is higher than the industry indicating that the stock is traded at a higher
price when compared to the industrial average. The same is noticed with the price to book and
price to cash flow ratio.
Problems or Limitation
The main limitation of the analysis is that there is an only quantitative analysis about the
performance of the company, but there is no qualitative analysis about the company. There is a
requirement for analyzing the future strategy of the company. It is essential to measure the
historical performance of the company, but at the same time, there should be more attention
11
FACEBOOK ANALYSIS
given to the future strategy of Facebook to know how the company will perform in the future.
There is a requirement for performing an industrial analysis and Facebook position in the
industry to know the actual performance and industrial stand of the company instead of confining
with the historical performance analysis.
There should be a more in-depth analysis about the company from the industry and
strategy perspective to evaluate the actual performance of the company. Similarly, there should
be a fundamental analysis of evaluating the intrinsic value of stock so that the investor will be in
a position to know whether Facebook is undervalued of overvalued and whether it is worthwhile
to make an investment in this stock or not. These are the limitation of the analysis.
Recommendation
From the financial statement analysis, it is clear that the company is managing their
working capital in an efficient manner. The overall liquidity position of the company is good,
and they are expected to improve in the future. The company should maintain their current
working capital management policies so that they will be in a position to handle their business in
an effective manner without creating more trouble to the business operations. The overall
profitability of the business is higher indicating that the company is in a position to generate
higher profit from their revenue. Their profit generating capacity is higher when compared to the
industry, and that attracts more investors.
The company should focus on reducing the overall cost incurred by the business to
improve the overall business efficiency so that they will be in a position to reduce the fluctuation
in the profitability. Facebook should pay more attention in retaining their users and increase the
facilities provided to them as it will attract more marketers to market their products. There is an
12
⊘ This is a preview!⊘
Do you want full access?
Subscribe today to unlock all pages.
Trusted by 1+ million students worldwide
1 out of 15
Related Documents


Your All-in-One AI-Powered Toolkit for Academic Success.
+13062052269
info@desklib.com
Available 24*7 on WhatsApp / Email
![[object Object]](/_next/static/media/star-bottom.7253800d.svg)
Unlock your academic potential
Copyright © 2020–2026 A2Z Services. All Rights Reserved. Developed and managed by ZUCOL.