QHO430: Data Analysis of Facebook Revenue and User Statistics
VerifiedAdded on 2023/06/10
|11
|2526
|358
Report
AI Summary
This report presents an analysis of Facebook's revenue in relation to its number of active users. It utilizes quantitative data and various data analysis tools, including descriptive statistics and regression analysis, to identify the correlation between these two variables. The study examines the methodology used, data sources, and appropriateness of the data collected from secondary sources. The analysis includes the presentation and visualization of data, such as revenue breakdown by geography and monthly active users. Furthermore, the report discusses the achievement of objectives, group functioning, and areas for future development, including issues faced and potential improvements. The findings reveal a strong positive correlation between Facebook's active users and its revenue, with the analysis highlighting the importance of data authenticity and effective communication in group projects.
Data Analysis Tools and
application
application
Paraphrase This Document
Need a fresh take? Get an instant paraphrase of this document with our AI Paraphraser
TABLE OF CONTENTS
INTRODUCTION...........................................................................................................................3
MAIN BODY...................................................................................................................................3
Objectives....................................................................................................................................3
Methodology and own contribution............................................................................................3
Source of data..............................................................................................................................4
Appropriateness of the data.........................................................................................................5
Analysis performed.....................................................................................................................5
Presenting and visualising the data.............................................................................................6
Achievement and conclusions.....................................................................................................8
Group functioning together and future development..................................................................8
Issues faced and what can be done differently in future.............................................................9
CONCLUSION................................................................................................................................9
REFERENCES..............................................................................................................................10
INTRODUCTION
Data analysis is being defined as the evaluation of the data in order to evaluate it and
draw inferences from the same. For solving any of the problem the use of data is being done in
order to analyse and solve it for evaluating the issue and try to find appropriate solution. The
current research is based on the analysis of relation between revenue of Facebook and the
number of active users being present. The current research will outline the different data analysis
tools and will be finding the solution to the problem. The aim of the project is to identify the
relation between the revenue generated and the number of active users being present. In the end,
the analysis of the group function will be outlined and will be evaluated that whether the working
within group is being done in better manner or not.
MAIN BODY
Objectives
The objective is being defined as the base through which the study is being conducted.
This is very essential because of the reason that the when the objective of the study will not be
clear than it will be affecting the working of the study. Hence, the objectives set for the present
study is as follows-
To analyse the concept of revenue and number of active user for Facebook along with its
significance.
To assess the relationship between the number of users present and the revenue being generated.
Methodology and own contribution
For the purpose of the project quantitative data has been used (Cr, 2020) Facebook plc
which is one of the most salient micro blogging site organization and providing a range of social
media services is considered for fulfilment of the project. Quantitative data such as revenue
generation and number of active users were taken into consideration.
Research philosophy:
The research philosophy of the research has been conceptual and analytical in nature
since for the project quantitative data had been used. Besides the source of data the nature of data
is secondary which is used in the project.
Approach of research:
⊘ This is a preview!⊘
Do you want full access?
Subscribe today to unlock all pages.
Trusted by 1+ million students worldwide
The approach of the research was quantitative. The gathered data about the organization
are quantitative in nature where number of active users and due to their activities the generated
revenues were taken into consideration (Pandey and Pandey, 2021)
Data collection :
it refers to the process of gathering data for fulfilment of the project, here the data of
Facebook plc has been gathered by using secondary sources. In the project quantitative data are
used, quantitative data stand for the information which can be manifested in form of quantity
such as active customers and generated revenue are taken with respect to the entity.
Data analysis:
In the research data has been analysed using quantitative techniques. Quantitative
techniques refers to the techniques which are used to analyse data and reveals the outcomes by
proceeding quantitative data. Techniques such as regression, correlation, mean, median, kurtosis
etc. are used.
The self contribution in the research is phenomenon. In the research I strived to present
views on the organizational performance, with this regard quantitative data are used and sort of
quantitative techniques such as central values of the data, evaluation of deviation and variance,
some other calculations as regression in order to decipher relationship between depended on and
independent variables used in the research. I decided the realm so can make my understanding
deeper and decipher some hidden aspects which is great matter of my interest. I collected data
form various sources and while collecting also ensured its usefulness and authenticity so can
offer better to the society. To my point of view the final outcomes would be wonderful for
further study and making better understanding about the taken issues.
Further, I tried to make it useful to interpret the relationship between active customers
and generated revenue of the organization. Various analysis which are applied in attempt to
analyse the data paved way to spill hidden aspects of active customers and their influence on the
revenue variable. The research will be very helpful for the users since as a team unit immense
amount of efforts is inculcated.
Source of data
The data used in the research is collected using secondary sources of data. Secondary
sources are used to collect the data. For Facebook plc their active users who are currently using
Paraphrase This Document
Need a fresh take? Get an instant paraphrase of this document with our AI Paraphraser
the online services provided by the organization and the revenue generated from the customers
are considered (Bolander, Chaker, 2021)
The organization is operating its business across the world and having higher returns too
so for the purpose of the research where various quantitative tools had to be used, the data was
collected form the authentic sources in order to carry out the research.
Appropriateness of the data
In a research the authenticity of collected data is very prominent since the final outcomes
are also depended on it. If the data is collected form the sources which are lacking when it comes
to their authenticity then the final outcomes will be misleading. In any research project
considering ethical norms is one of the most prominent act for research.
The data is taken form the authentic sources such as official websites, while collecting
data the authenticity was utterly ensured so can carry out research in appropriate manner. The
data is collected form secondary sources, so it was already collected and used by some other
parties.
Analysis performed
Descriptive statistics
No. of active user Revenue generated
Mean 2320.8 56.16
Standard Error 159.2624877 10.38424769
Median 2320 55.8
Mode #N/A #N/A
Standard Deviation 356.1217488 23.21988372
Sample Variance 126822.7 539.163
Kurtosis -0.317743179 -1.291967283
Skewness 0.079798548 0.088310985
Range 937 58.4
Minimum 1860 27.6
Maximum 2797 86
Sum 11604 280.8
Count 5 5
With the help of the descriptive statistics it is clear that the average number of active
users with Facebook is 2320.8 and average revenue generated is 56.16. Along with this it was
also analysed that the standard deviation outlines that number of active users is having more
dispersion as compared to the revenue generated.
Regression analysis
Regression
Statistics
Multiple R 0.99504
R Square 0.9901
Adjusted R
Square 0.9868
Standard Error 2.66798
Observations 5
ANOVA
df SS MS F
Significance
F
Regression 1 2135.3 2135.3 299.981 0.00042
Residual 3 21.3543 7.11811
Total 4 2156.65
Coefficients
Standard
Error t Stat P-value
Lower
95%
Upper
95%
Lower
95.0%
Upper
95.0%
Intercept -94.41 8.77494 -10.759 0.00172 -122.34 -66.484 -122.34 -66.484
No. of active
user 0.06488 0.00375 17.32 0.00042 0.05296 0.0768 0.05296 0.0768
With the help of the regression analysis it is clear that there is high correlation within
both the variables that is revenue and the number of active users. The R is 99.5 % which implies
that both the variables are highly correlated. Along with this the significance value is 0.00042
which is less than the standard that is 0.05. This implies that the revenue is being affected by the
changes in number of active users.
Presenting and visualising the data
Revenue breakdown by geography
2016 2017 2018 2019 2020
US 12.6 17.7 24.1 30.2 36.2
Canada 0.9 1.3 1.6 2 2.2
Europe+ Russia+ Turkey 6.8 10.1 13.6 16.8 20.3
Asia- Pacific 5 7.9 11.7 15.4 19.8
⊘ This is a preview!⊘
Do you want full access?
Subscribe today to unlock all pages.
Trusted by 1+ million students worldwide
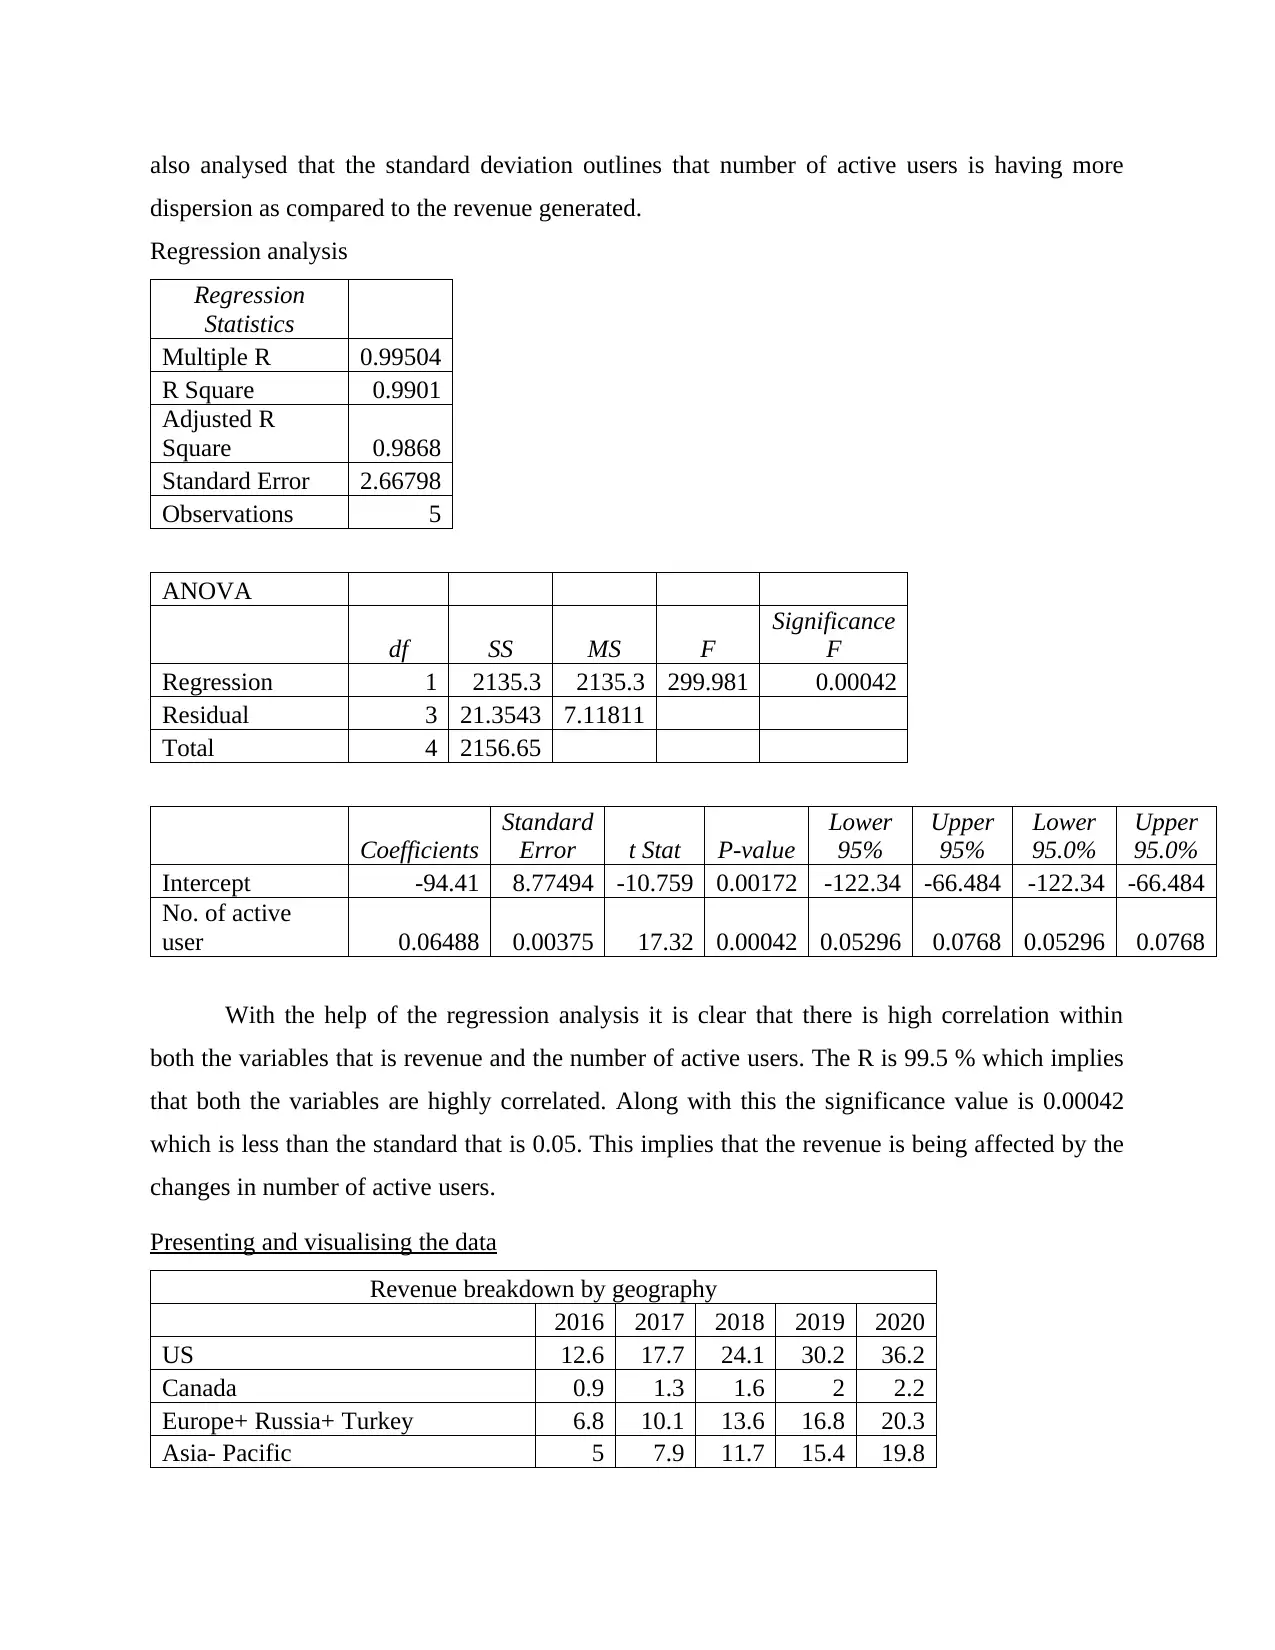
Rest of the world 2.4 3.5 4.7 6.3 7.3
With the help of the above graphical presentation it is clear that the working for
Facebook and the revenue being generated is increasing since 2016. Every year the trend
identified is increasing and this will be benefitting the company to grow and develop (Mölder
and et.al., 2021). Also the graph is highlighting the increasing trend and majorly in US market.
Monthly active users by geography
2016 2017 2018 2019 2020
US and Canada 231 239 242 248 258
Europe+ Russia+ Turkey 349 370 381 394 419
Asia- Pacific 673 828 947 1038 1199
Rest of the world 606 692 750 817 921
Paraphrase This Document
Need a fresh take? Get an instant paraphrase of this document with our AI Paraphraser
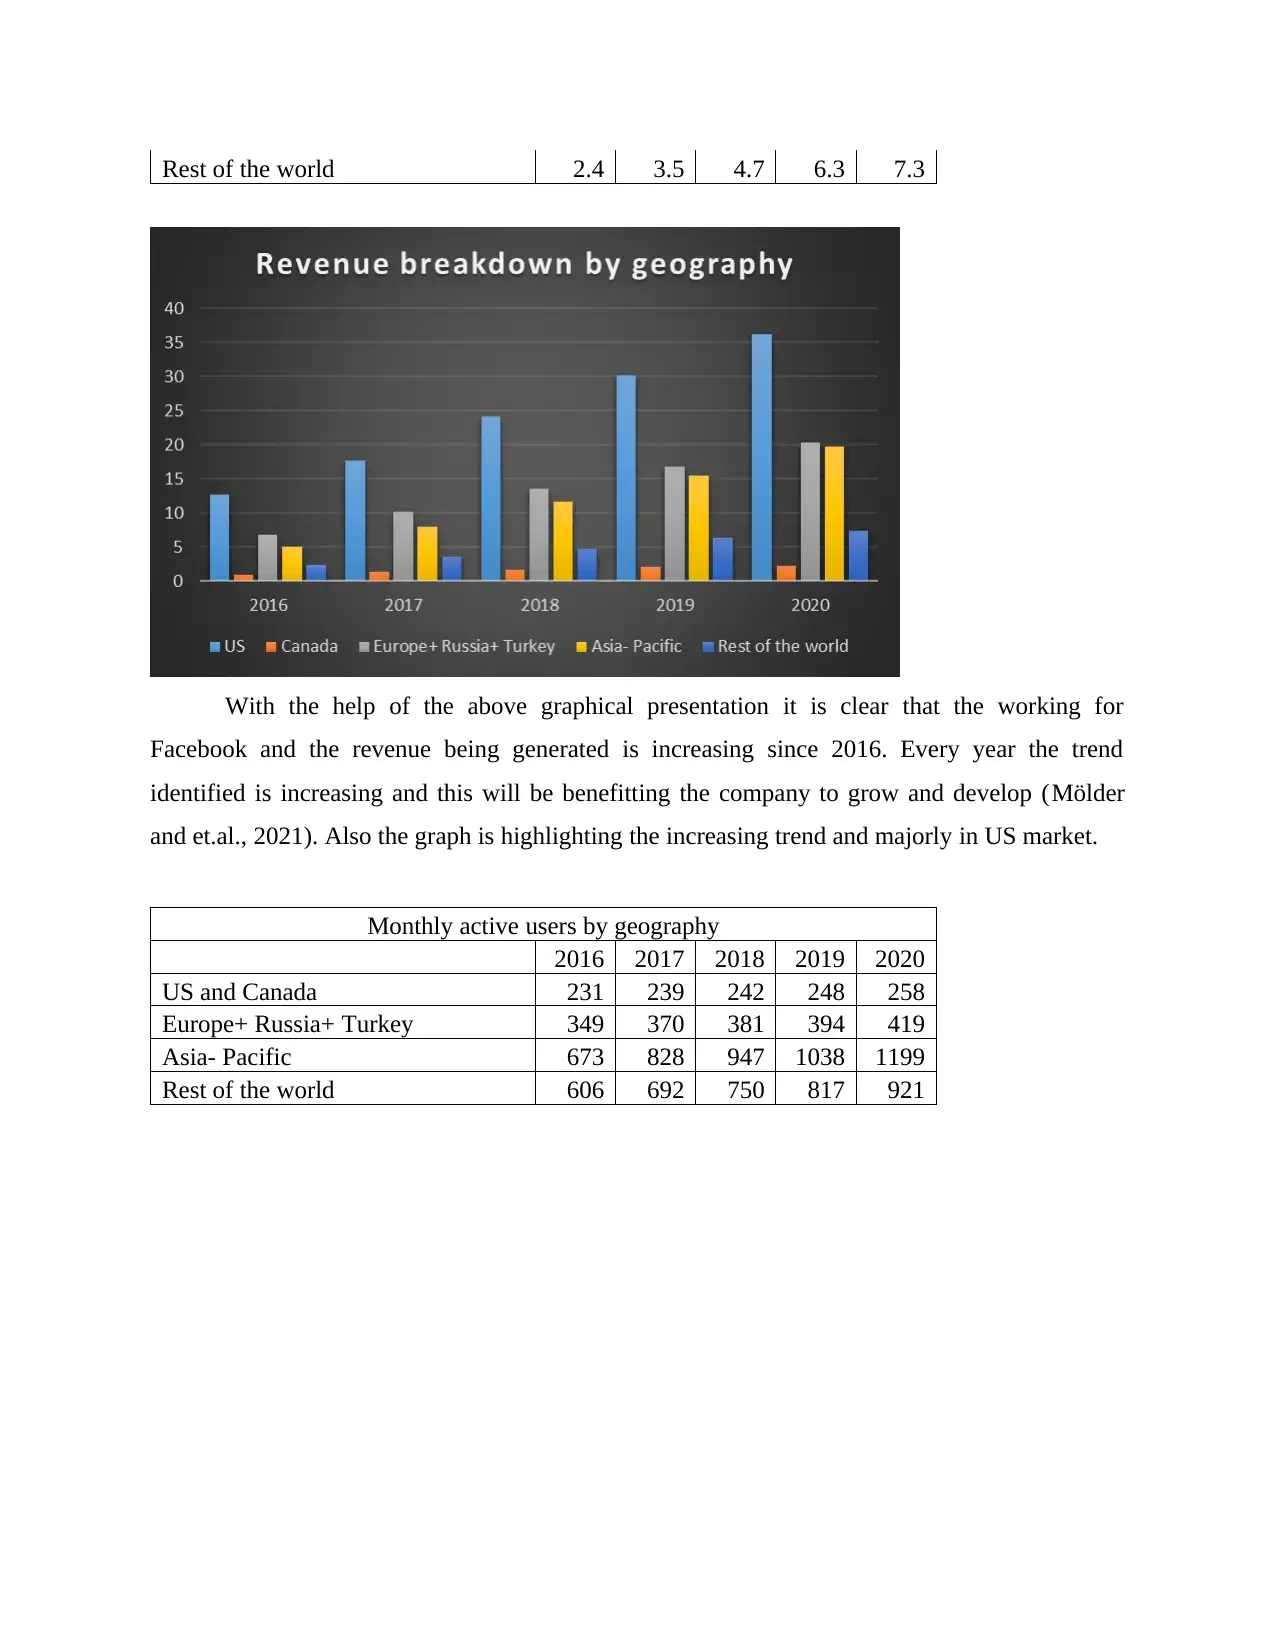
Further with the help of the above data and chart it is clear that the monthly active users
of Facebook are also increasing. This is pertaining to the fact that currently the use of internet
and social media is increasing and this improves the working profitability of the company
(Mahdavinejad and et.al., 2018). Thus, with the help of the above chart it is clear that number of
active users is being increasing and this will be improving the working efficiency of the
company and ultimately the profitability of the company increases.
Achievement and conclusions
With the help of the above analysis it is clear that the objective has been achieved and
this is good. It is concluded that the changes in the number of users affects the revenue earned by
the company as well.
Group functioning together and future development
With the help of the above analysis it is clear that when the work is being done in a group
then this is beneficial for the successful completion of the project. The reason underlying this
fact is that when the working will be good then this will be resulting in attainment of objectives
of business. With this group event I learnt that in group the different ideas are generated and this
improves the functioning of the whole project in better manner (Miles, Huberman and Saldaña,
2018). Also for the better future working I will prefer to use the Tuckman team development
theory as it provides a wider base to make the team. In case team will be strong then this will be
resulting in better outcome.
Issues faced and what can be done differently in future
In the research there were a few issues were faced, since the research was in depth so on
the way some sort of roadblocks is already expected. Major issues as lack of confidence and
sometimes poor communication too (Alsharif, Albreem, Solyman, 2021)
While working on the project due to some communicational barriers it became a bit more hectic
work, which can be considered the biggest issue we faced yet some counter techniques were used
in order to reduce the malicious affects of miscommunication.
From the gained experience it can be said that there is need to inculcate some new aspects
for the purpose of making future researches more affective and without obstacles (Bokhove,
2022) The confidence factor is very essential so for gaining it there is need to enhance better
analytical and research field skills, which would be paving way for higher confidence. At the
same time a well-structured communication structure is also needed before starting such
research. It will help to make the communication well channelized and will reduce sort of
barriers. For barrier less communication some modern tools can be used and for eradication of
bottlenecks it can be revised on regular interval.
CONCLUSION
From the report above it can be summarized, in the report research has been carried out,
with this respect the data of Facebook plc were collected by using authentic sources. The
secondary sources of data were used where generated revenues by the organization and their
active customer had been collected. The report presented entire research to the fullest length
covering various dimensions such as research methodology where different perspectives such as
data types, philosophy, data collection, data analysis were covered, it was also substantiated with
owns contribution in the research too.
Here different quantitative techniques were used to interpret the collected data, then for
making it more perceivable visualization was also taken into consideration. At the end of the
report some set of issues were contemplated such as the difficulties faced and how it might be
taken to the direction of betterment in the future in order to hike the performance as a group.
⊘ This is a preview!⊘
Do you want full access?
Subscribe today to unlock all pages.
Trusted by 1+ million students worldwide
REFERENCES
Books and Journals
Alsharif, M. H., Albreem, M. A., Solyman, A. A. 2021. Toward 6g communication
networks: terahertz frequency challenges and open research
issues. Computers, Materials & Continua. 66(3). pp.2831-2842. <
https://www.researchgate.net/profile/Mahmoud-Albreem-2/publication/
348204464_Toward_6G_Communication_Networks_Terahertz_Frequency
_Challenges_and_Open_Research_Issues/links/
6049a5e2299bf1f5d83d9b2e/Toward-6G-Communication-Networks-
Terahertz-Frequency-Challenges-and-Open-Research-Issues.pdf >
Bokhove, C., 2022. The role of analytical variability in secondary data replications: A
replication of Kim et al.(2014). Educational Research and Evaluation.
27(1-2). pp.141-163.
<https://www.tandfonline.com/doi/full/10.1080/13803611.2021.2022319>
Bolander, W., Chaker, 2021. Operationalizing salesperson performance with secondary data:
aligning practice, scholarship, and theory. Journal of the Academy of
Marketing Science. 49(3). pp.462-481.
<https://link.springer.com/article/10.1007/s11747-020-00752-0>
Cr, K., 2020. Research methodology methods and techniques.
<https://pdfcookie.com/documents/research-methodology-methods-and-
techniques-by-cr-kothari-7rv3wzk460ld>
Ho, J., and et.al., 2019. Moving beyond P values: data analysis with estimation
graphics. Nature methods. 16(7). pp.565-566.
(https://www.nature.com/articles/s41592-019-0470-3)
Mahdavinejad, M.S., and et.al., 2018. Machine learning for Internet of Things data analysis:
A survey. Digital Communications and Networks. 4(3). pp.161-175.
(https://www.sciencedirect.com/science/article/pii/S235286481730247X)
Miles, M.B., Huberman, A.M. and Saldaña, J., 2018. Qualitative data analysis: A methods
sourcebook. Sage publications. (https://books.google.co.in/books?
hl=en&lr=&id=lCh_DwAAQBAJ&oi=fnd&pg=PP1&dq=Miles,+M.B.,
+Huberman,+A.M.+and+Salda%C3%B1a,+J.,
+2018.+Qualitative+data+analysis:+A+methods+sourcebook.
+Sage+publications.&ots=2SepLGClah&sig=ORcaExSSHwD18aDDLP7P
eVjrj8c&redir_esc=y#v=onepage&q=Miles%2C%20M.B.%2C
%20Huberman%2C%20A.M.%20and%20Salda%C3%B1a%2C%20J.%2C
%202018.%20Qualitative%20data%20analysis%3A%20A%20methods
%20sourcebook.%20Sage%20publications.&f=false)
Mölder, F., and et.al., 2021. Sustainable data analysis with Snakemake. F1000Research. 10.
(https://www.ncbi.nlm.nih.gov/pmc/articles/PMC8114187/)
Paraphrase This Document
Need a fresh take? Get an instant paraphrase of this document with our AI Paraphraser

Pandey, P. and Pandey, M. M., 2021. Research methodology tools and techniques. Bridge
Center.
Center.
1 out of 11
Related Documents


Your All-in-One AI-Powered Toolkit for Academic Success.
+13062052269
info@desklib.com
Available 24*7 on WhatsApp / Email
![[object Object]](/_next/static/media/star-bottom.7253800d.svg)
Unlock your academic potential
Copyright © 2020–2026 A2Z Services. All Rights Reserved. Developed and managed by ZUCOL.