Individual Report: Analyzing Facebook Revenue Impact by User Growth

Verified

Added on  2023/06/10

|10
|562
|143
Report
AI Summary
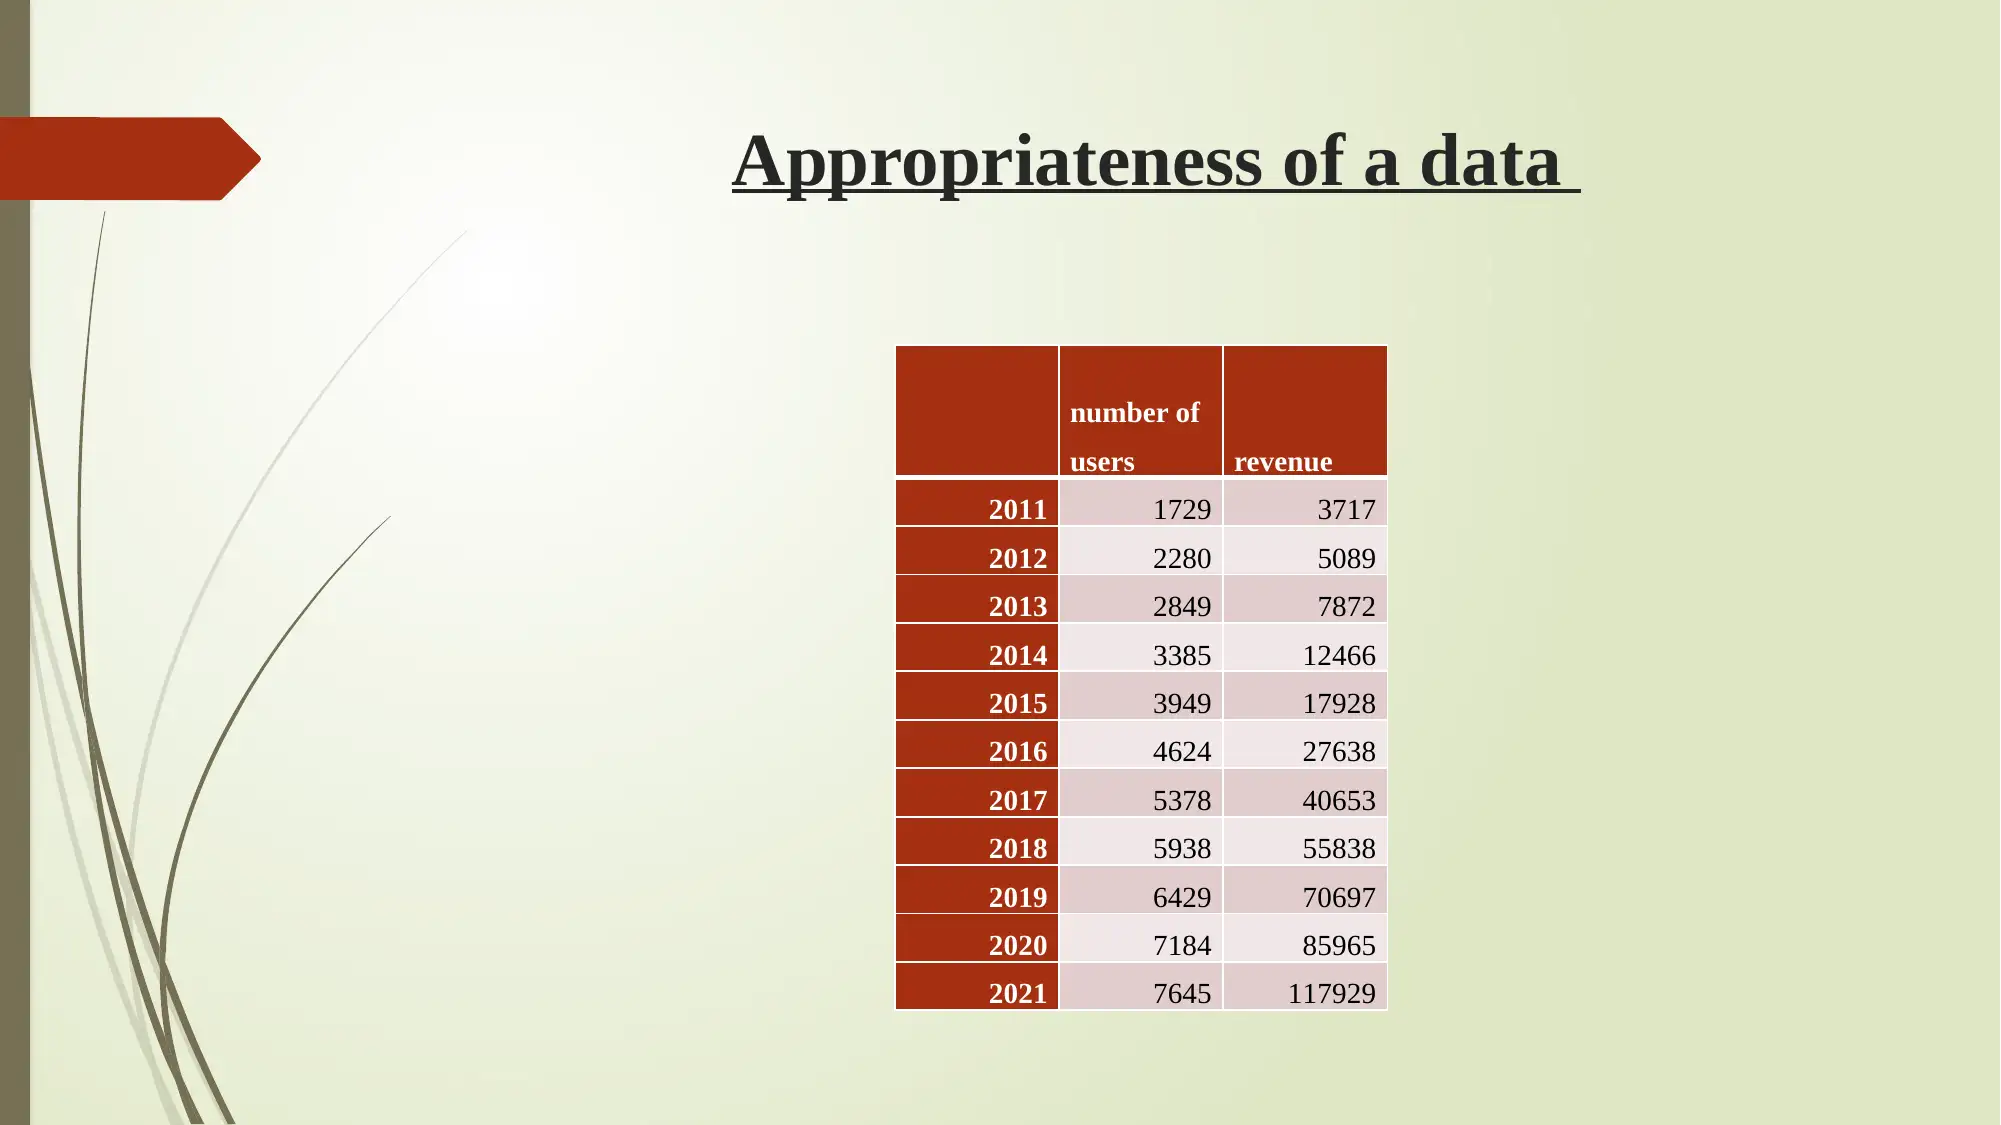
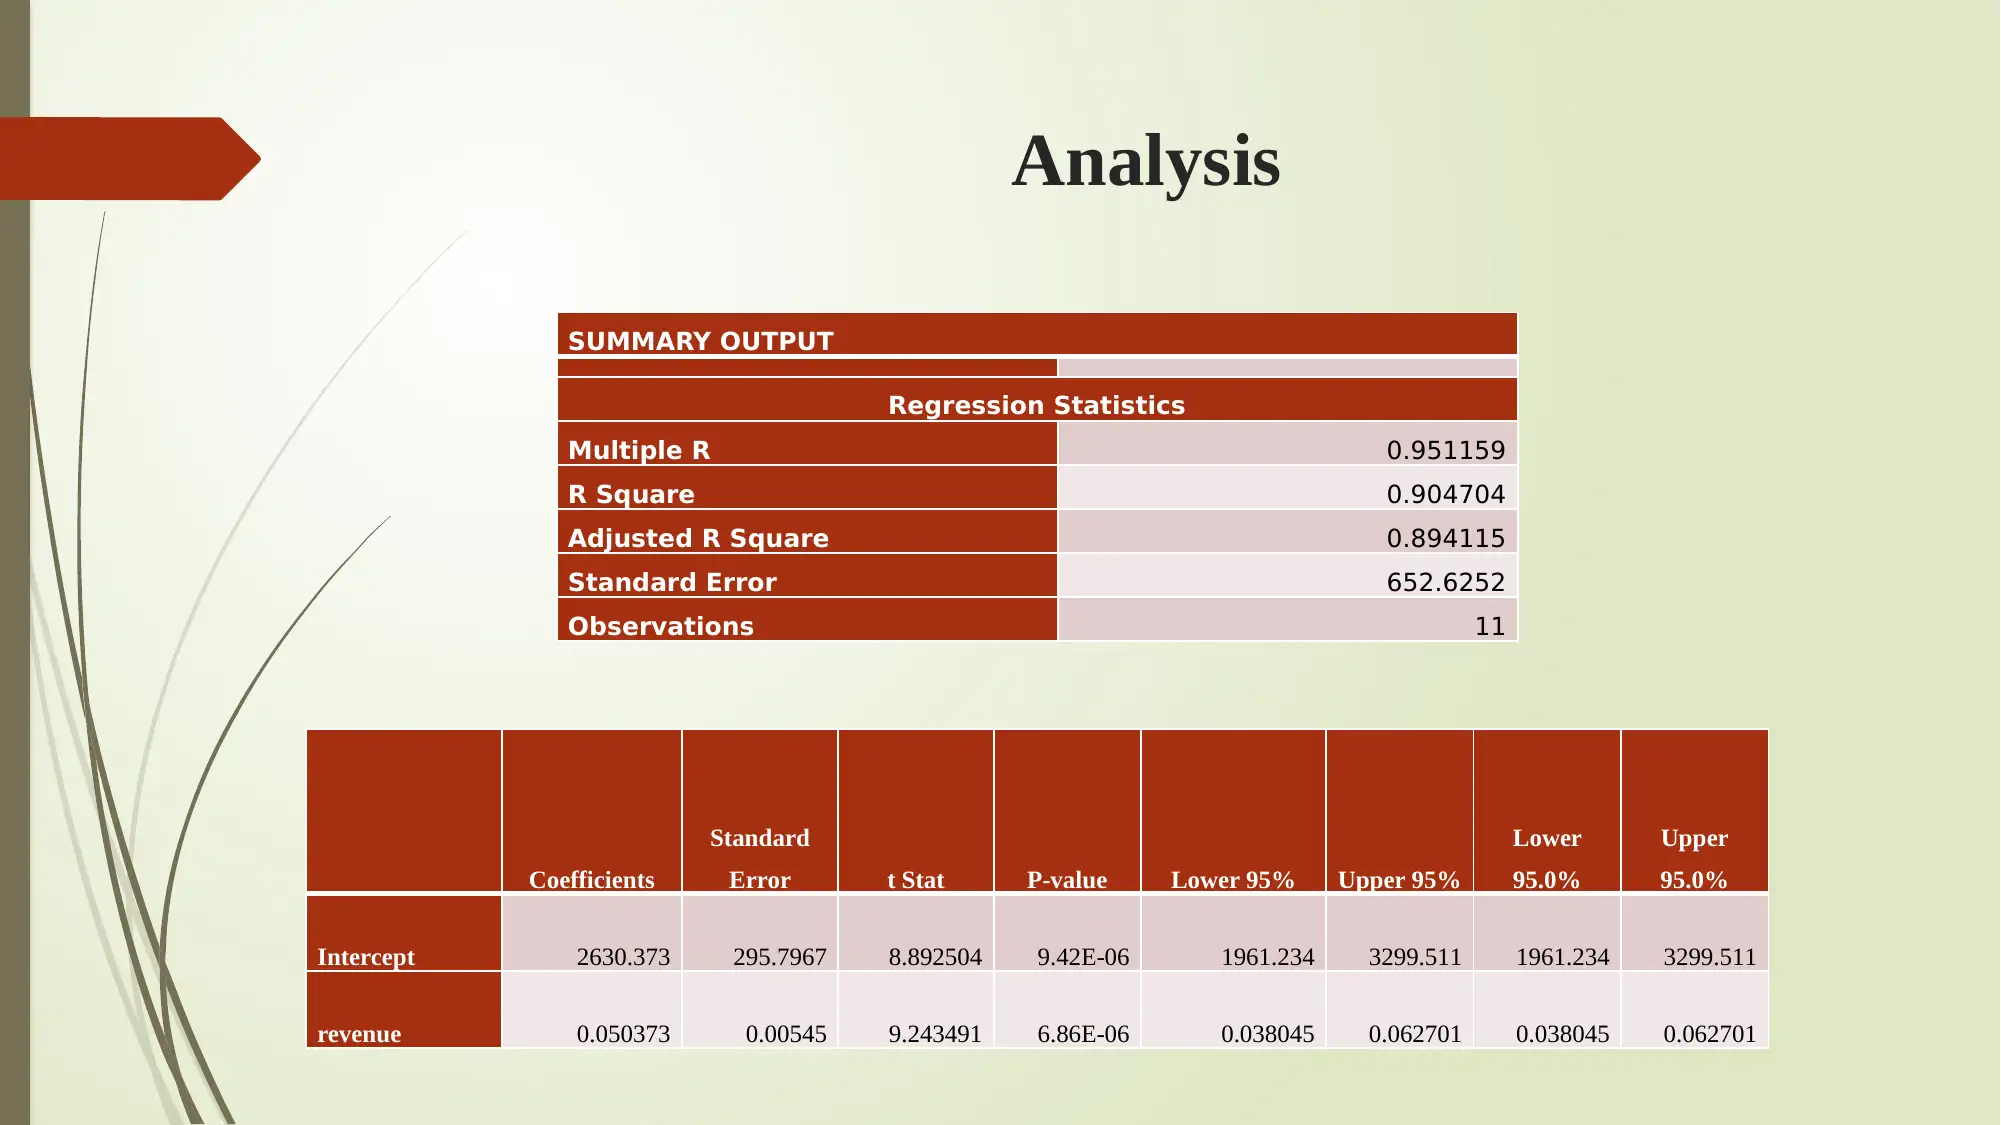
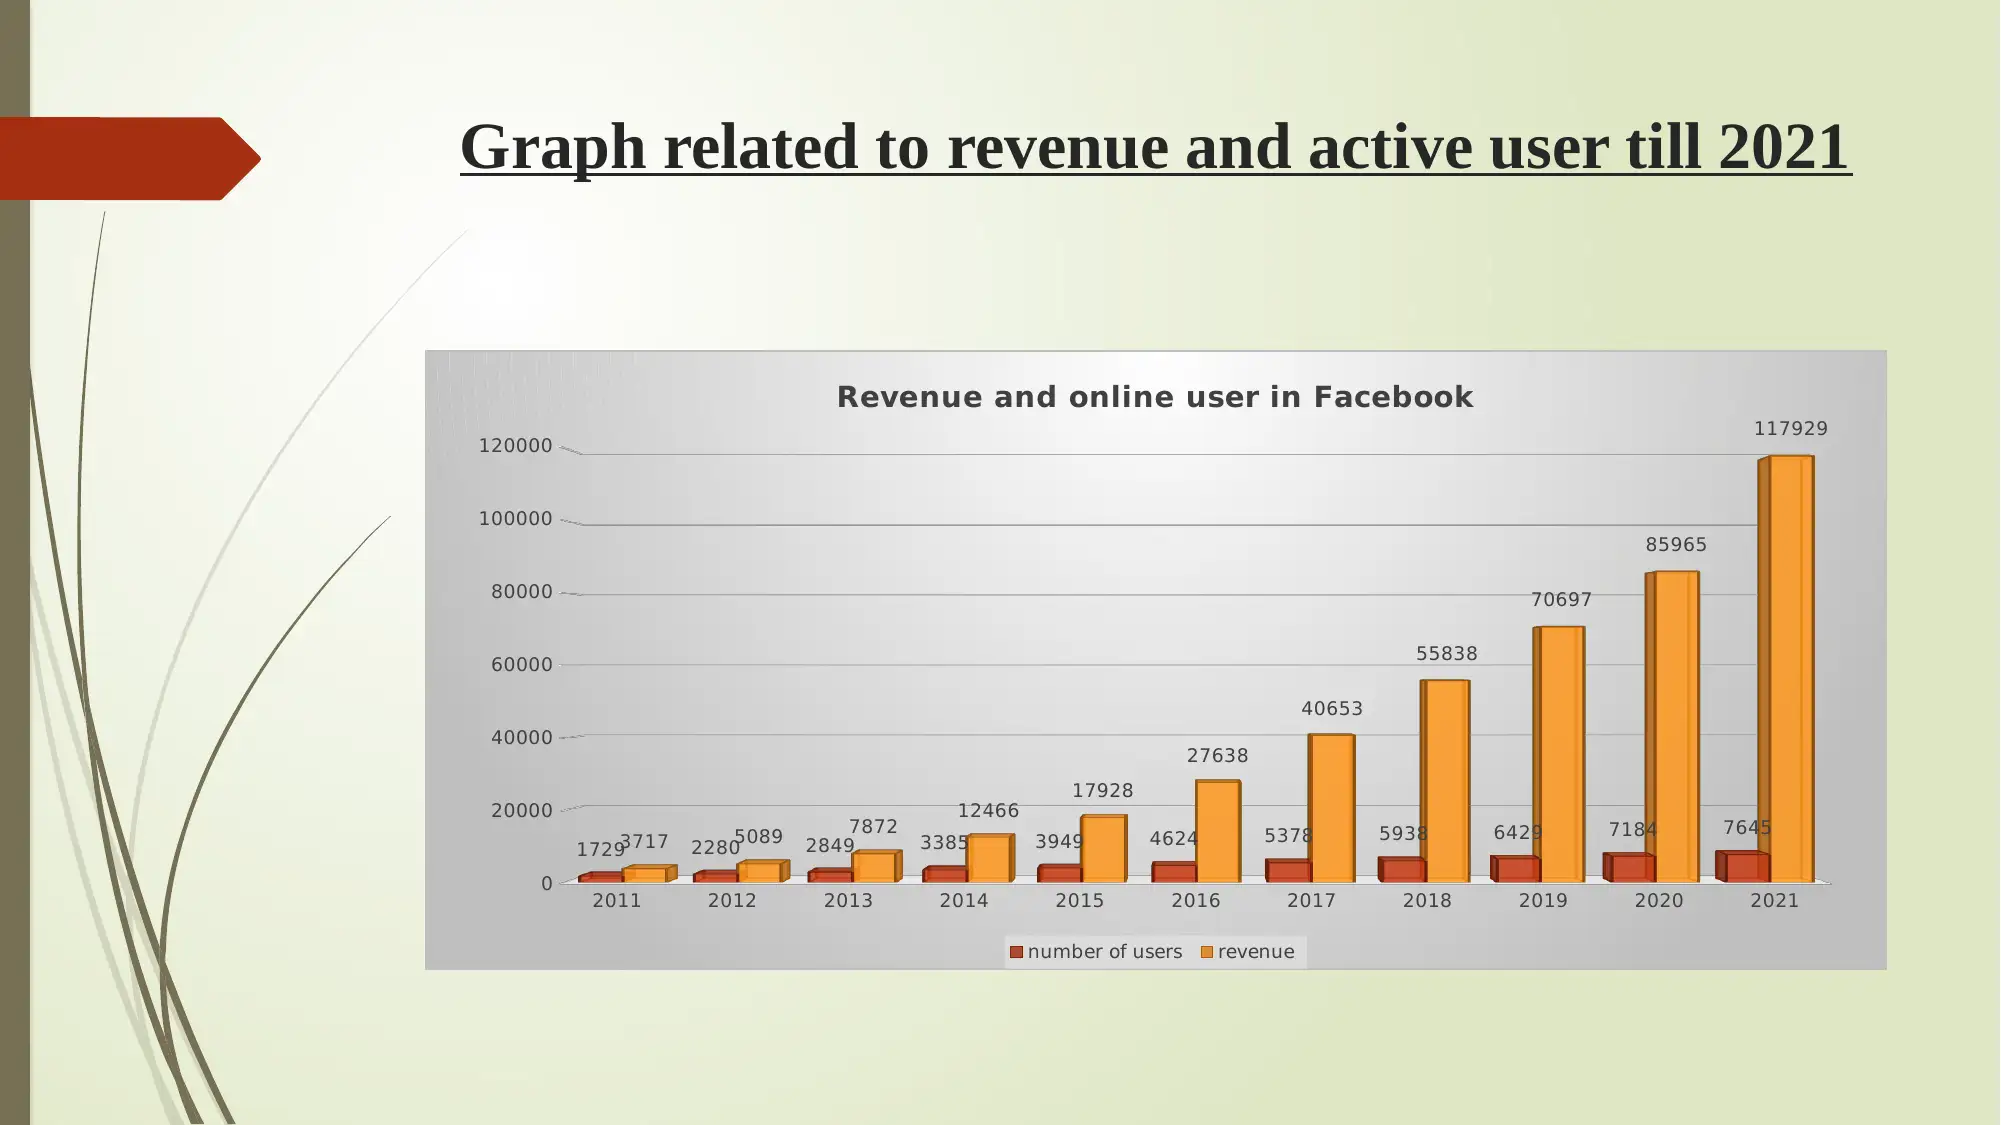
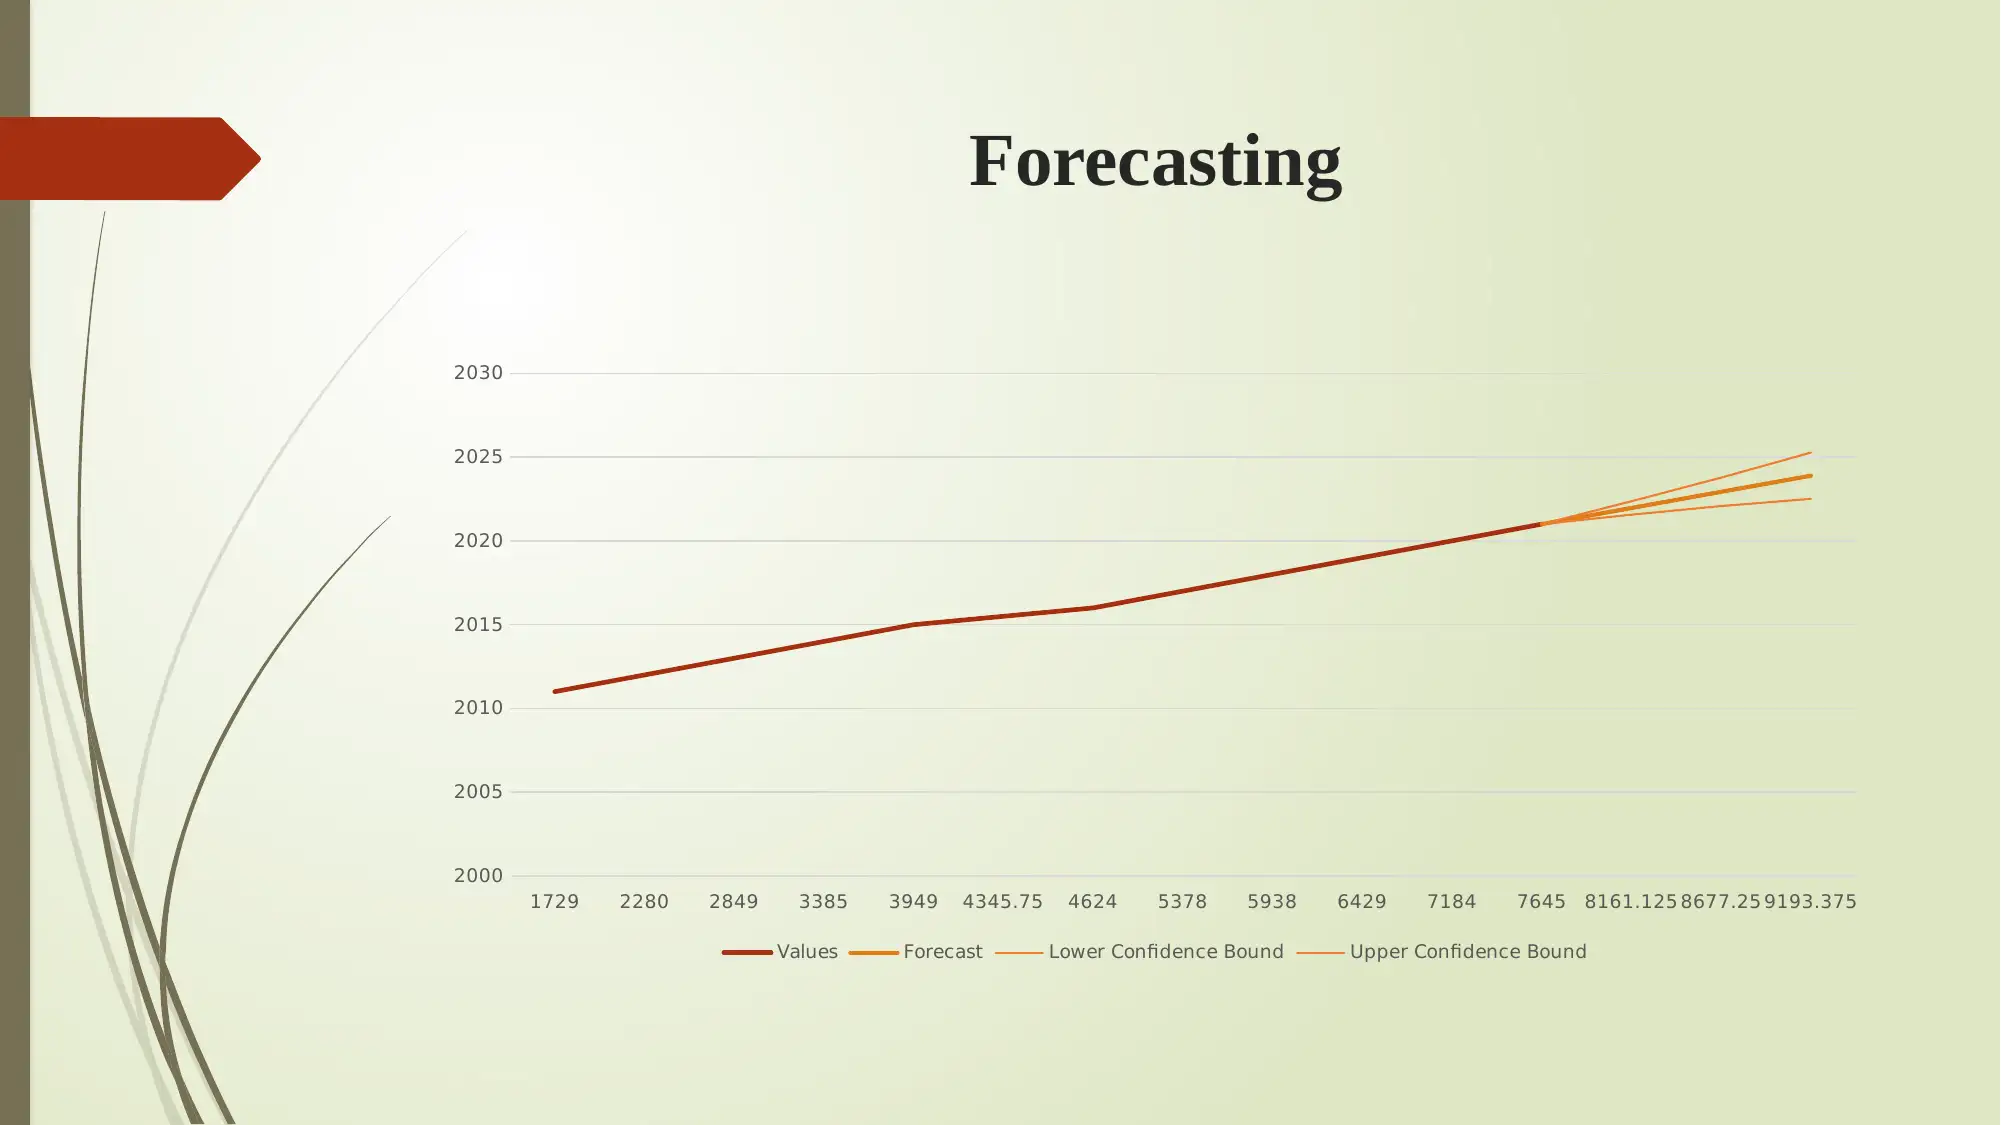
This report analyzes the relationship between Facebook's online users and its revenue from 2011 to 2021. The study aims to determine the impact of users on Facebook's revenue, utilizing data analysis and regression techniques. The analysis includes a data table showing user numbers and revenue figures, along with a regression analysis summary. A graph illustrates the trend of revenue and online users over the years. The forecasting section projects future values based on the existing data. The report concludes that an increase in online users positively impacts the company's revenue, and that Excel is a useful tool for this type of data analysis. References to relevant sources are also provided to support the analysis.
Document Page
Individual report
tabler-icon-diamond-filled.svg

Paraphrase This Document

Need a fresh take? Get an instant paraphrase of this document with our AI Paraphraser
Document Page
Project aim and objective
The current project aim is to determine the impact of users over revenue of Facebook and
that is why, the results may be vary. With the help of this outcome, the chances of
implementing steps will be change because to raise the performance of the company, there
is a need to determine he loophole.
Objectives
With the help of present study, the scholar try to attain the relationship between
the profit and online users within Facebook.
Document Page
Appropriateness of a data
number of
users revenue
2011 1729 3717
2012 2280 5089
2013 2849 7872
2014 3385 12466
2015 3949 17928
2016 4624 27638
2017 5378 40653
2018 5938 55838
2019 6429 70697
2020 7184 85965
2021 7645 117929
Document Page
Analysis
Coefficients
Standard
Error t Stat P-value Lower 95% Upper 95%
Lower
95.0%
Upper
95.0%
Intercept 2630.373 295.7967 8.892504 9.42E-06 1961.234 3299.511 1961.234 3299.511
revenue 0.050373 0.00545 9.243491 6.86E-06 0.038045 0.062701 0.038045 0.062701
SUMMARY OUTPUT
Regression Statistics
Multiple R 0.951159
R Square 0.904704
Adjusted R Square 0.894115
Standard Error 652.6252
Observations 11
tabler-icon-diamond-filled.svg

Paraphrase This Document

Need a fresh take? Get an instant paraphrase of this document with our AI Paraphraser
Document Page
Graph related to revenue and active user till 2021
2011 2012 2013 2014 2015 2016 2017 2018 2019 2020 2021
0
20000
40000
60000
80000
100000
120000
1729 2280 2849 3385 3949 4624 5378 5938 6429 7184 7645
3717 5089 7872 12466
17928
27638
40653
55838
70697
85965
117929
Revenue and online user in Facebook
number of users revenue
Document Page
Forecasting
1729 2280 2849 3385 3949 4345.75 4624 5378 5938 6429 7184 7645 8161.125 8677.25 9193.375
2000
2005
2010
2015
2020
2025
2030
Values Forecast Lower Confidence Bound Upper Confidence Bound
Document Page
How did the group function together
The group function together in order to attain the defined aim in an effective manner
because the work is distributed equally among all the members that help to improve the
results.
Further, due to having unique capabilities, the project is able to meet the defined aim of the
study and prove the relationship between the variable so that effective outcome can be
generated
tabler-icon-diamond-filled.svg

Paraphrase This Document

Need a fresh take? Get an instant paraphrase of this document with our AI Paraphraser
Document Page
Conclusion
By summing up above report it has been concluded that there is a positive impact over the
results such that through regression the relationship has proved and that is why, when the
number of online users increases then it increase the chance of revenue of a company.
Also, the study has been concluded that excel as a data analytical tool used which in turn
causes positive impact over the results and this causes better outcome.
Document Page
REFERENCES
Guerrero, H., 2018. Excel Data Analysis: Modeling and Simulation. Springer.
Hunter, G.W. and et.al., 2021. The EXCEL Trial: The Interventionalists'
Perspective. European Cardiology Review. 16.
Ma, S. and Fildes, R., 2021. Retail sales forecasting with meta-learning. European Journal
of Operational Research. 288(1). pp.111-128.
Mayes, T. R., 2020. Financial analysis with microsoft excel. Cengage Learning.
Pan, H. and Zhou, H., 2020. Study on convolutional neural network and its application in
data mining and sales forecasting for E-commerce. Electronic Commerce Research. 20(2).
pp.297-320.
Document Page
chevron_up_icon
1 out of 10
circle_padding
hide_on_mobile
zoom_out_icon
[object Object]