Report on Facebook User Statistics Analysis Using MS Excel (2011-2021)
VerifiedAdded on 2023/06/11
|13
|1817
|79
Report
AI Summary
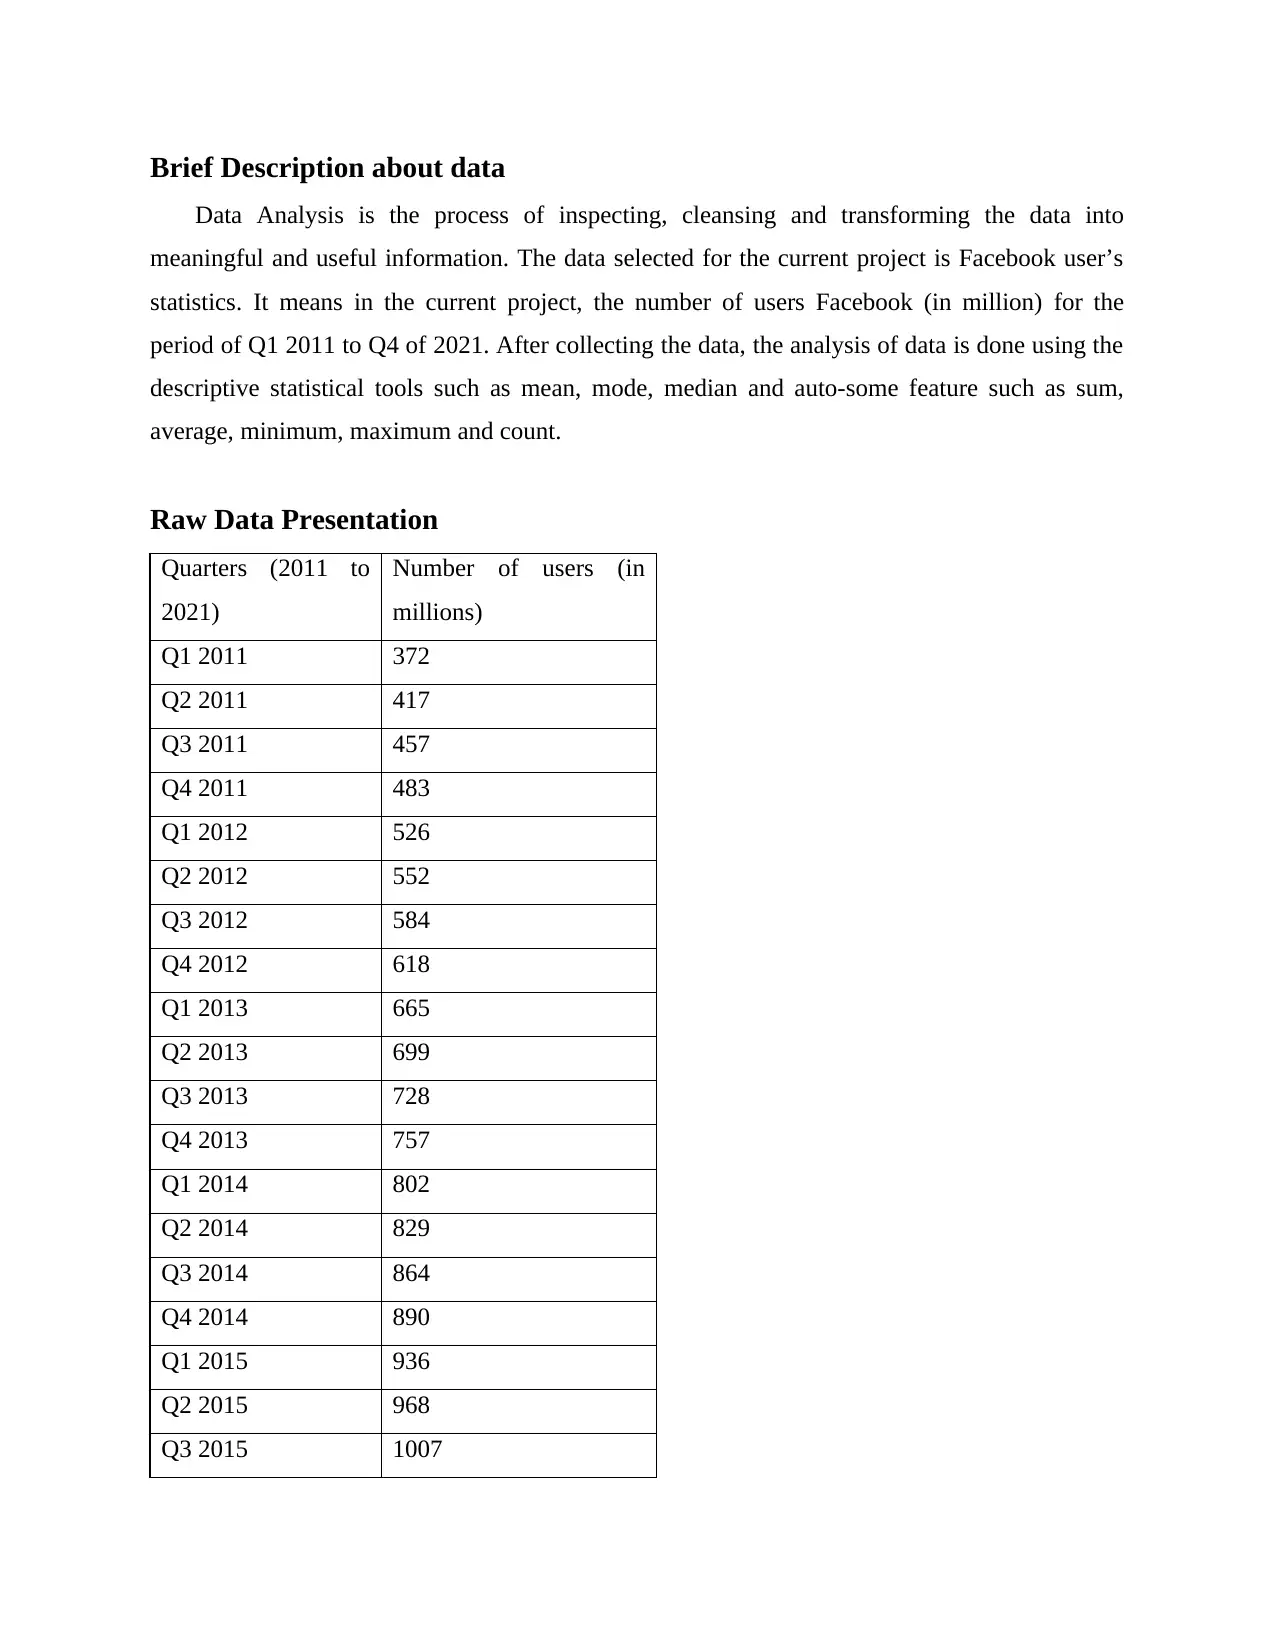
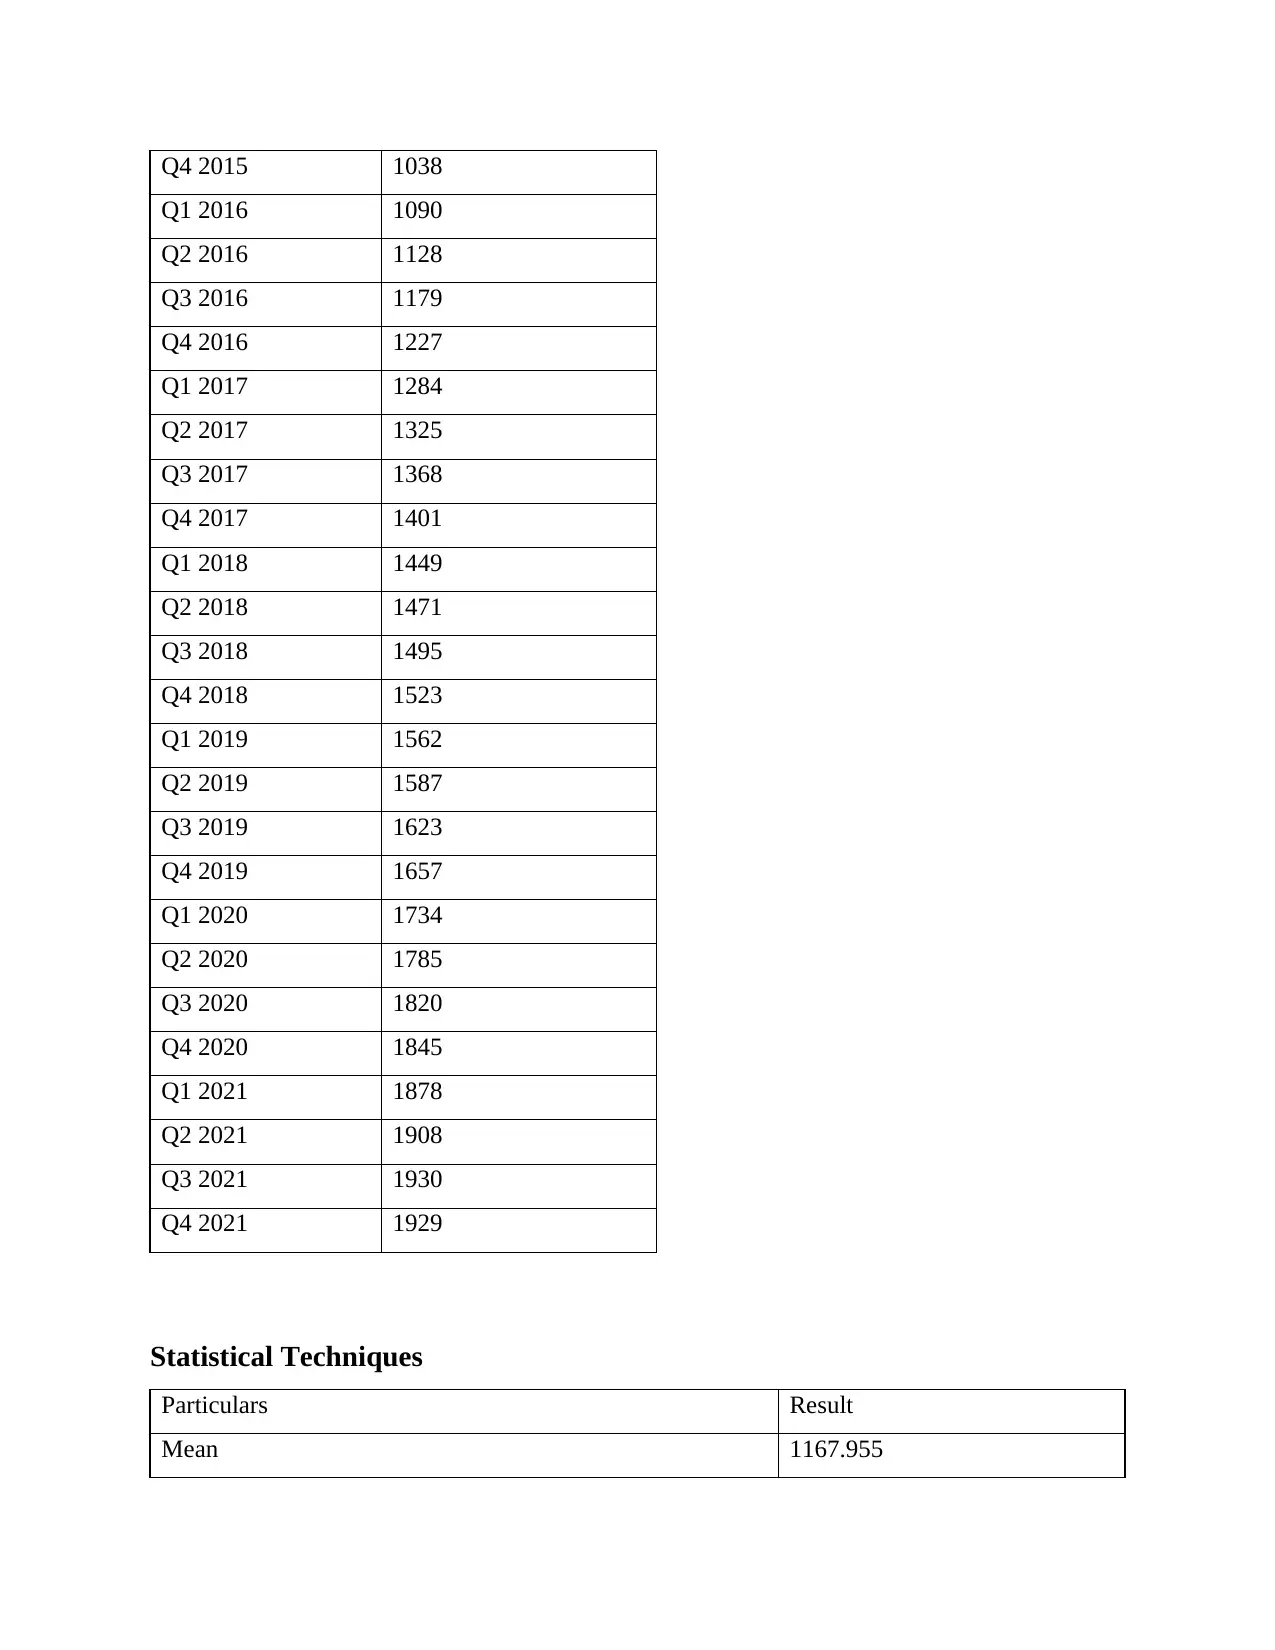
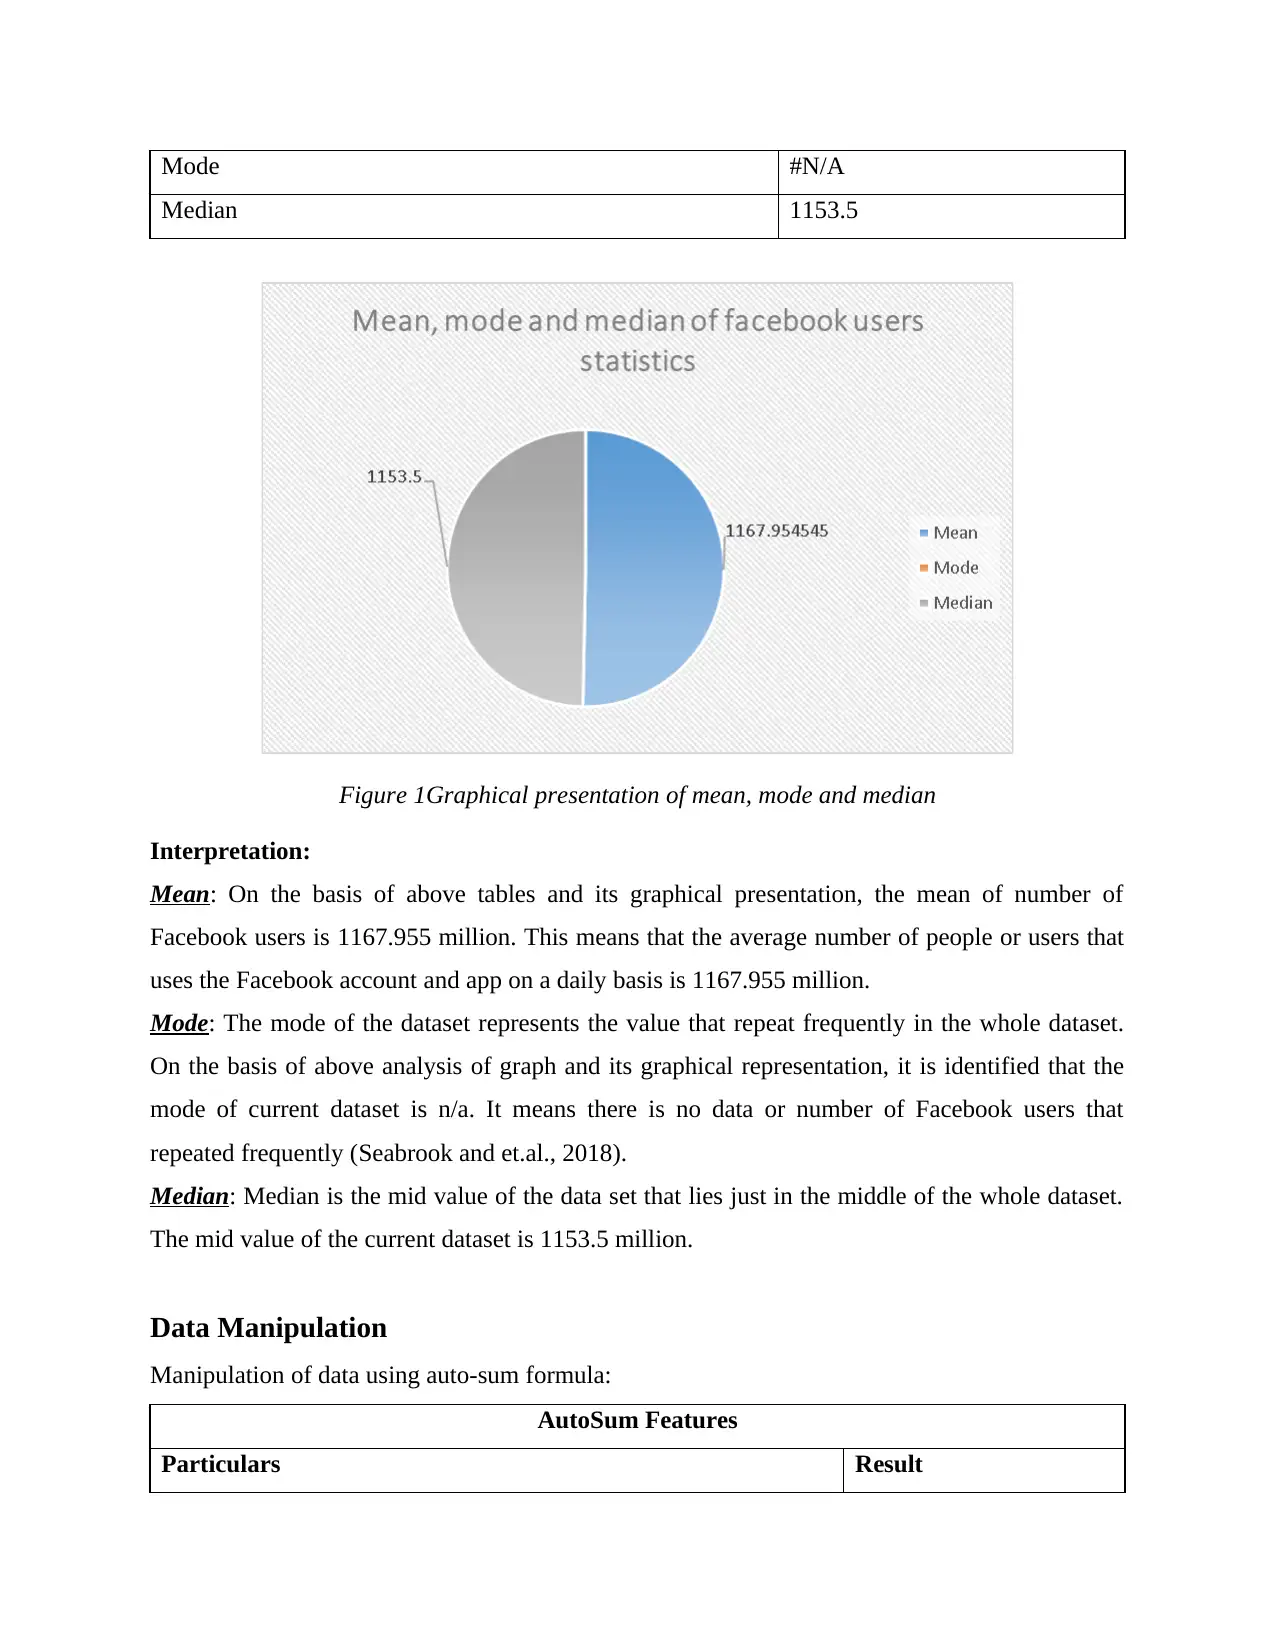
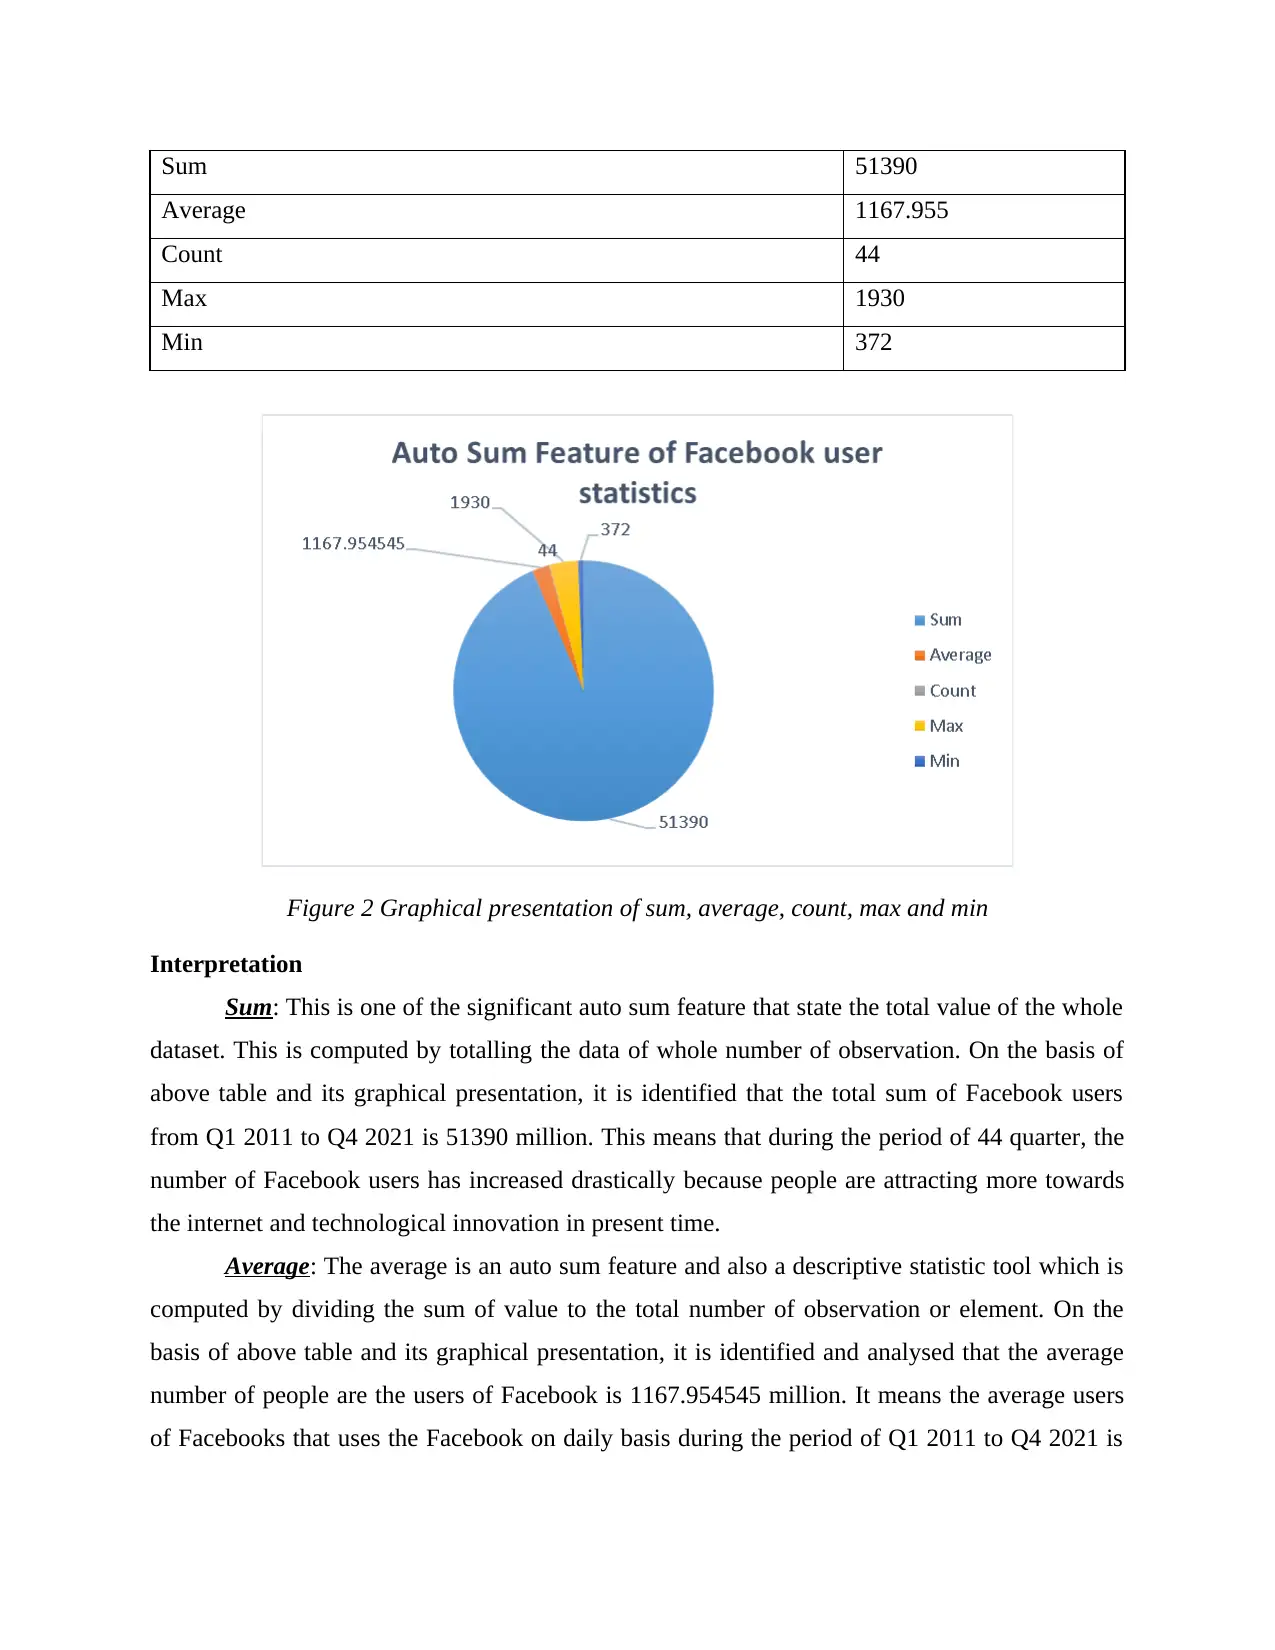
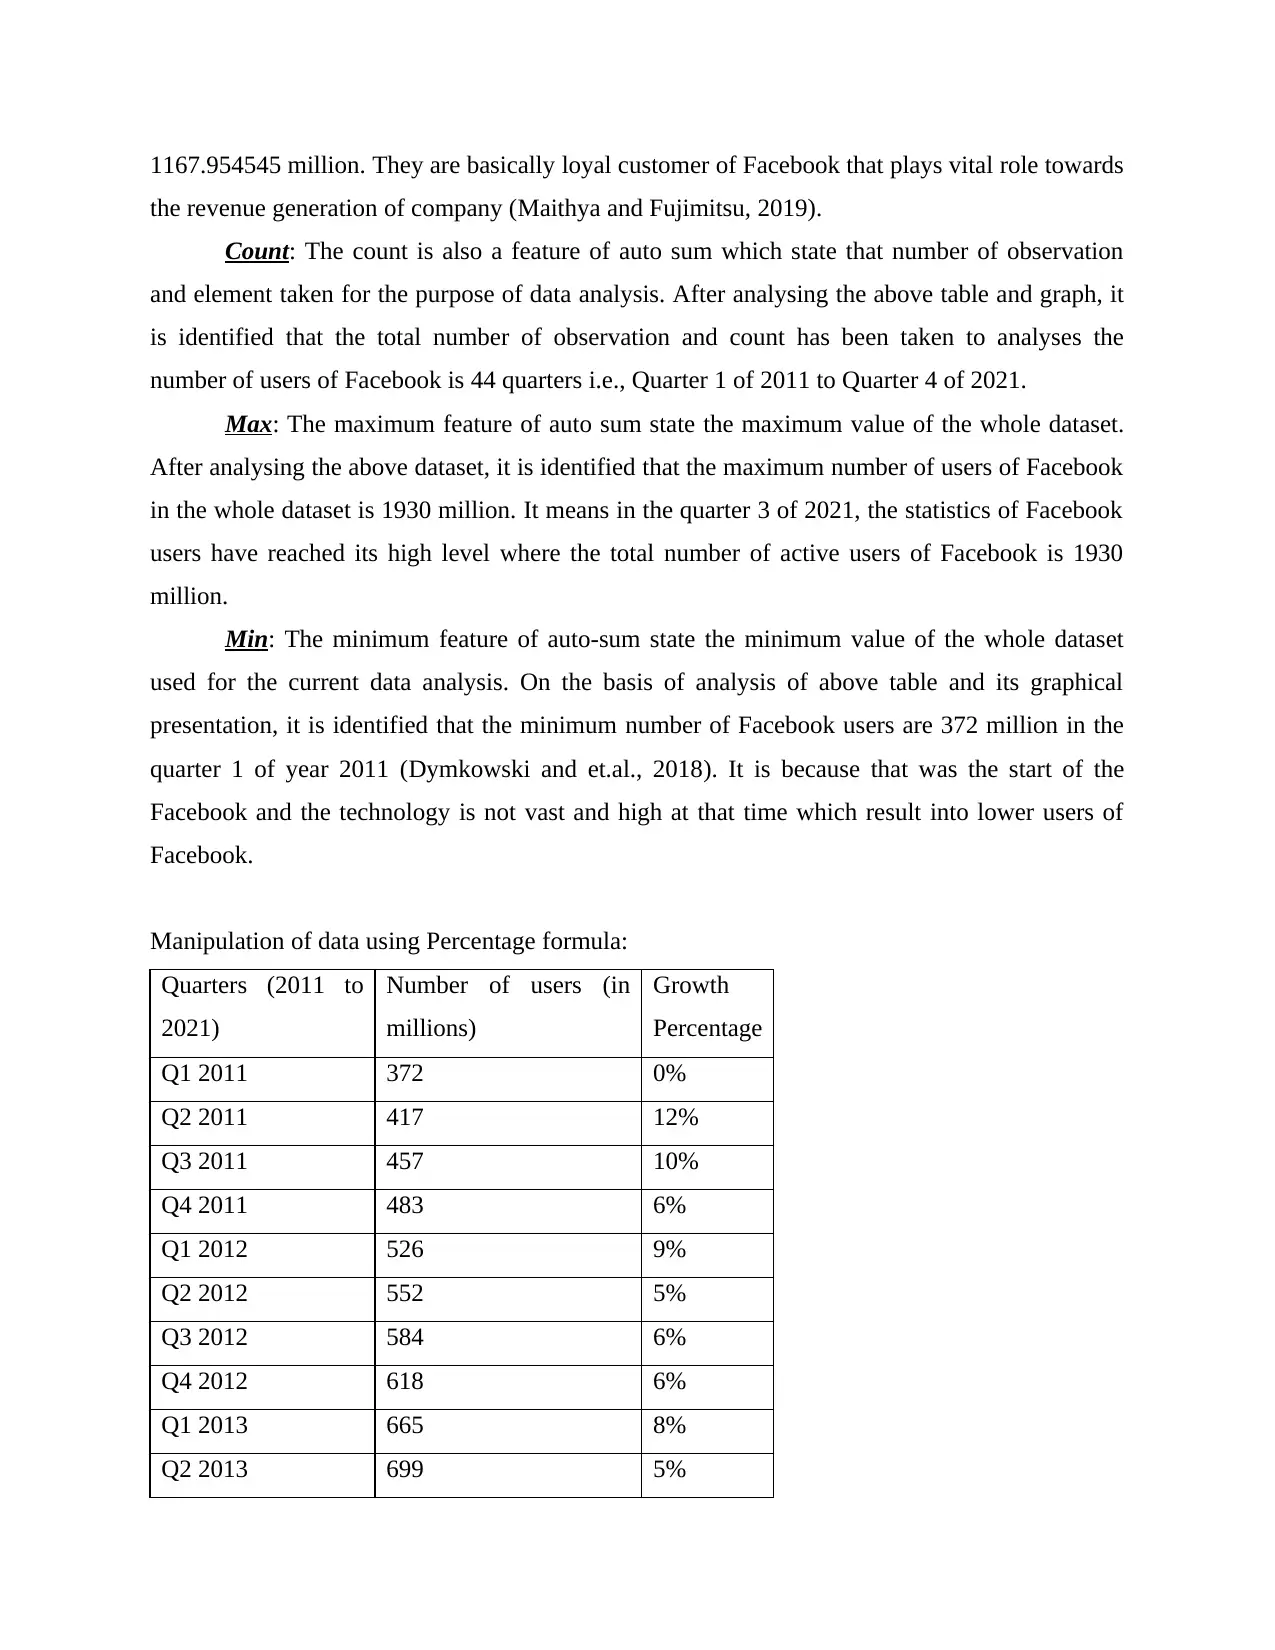
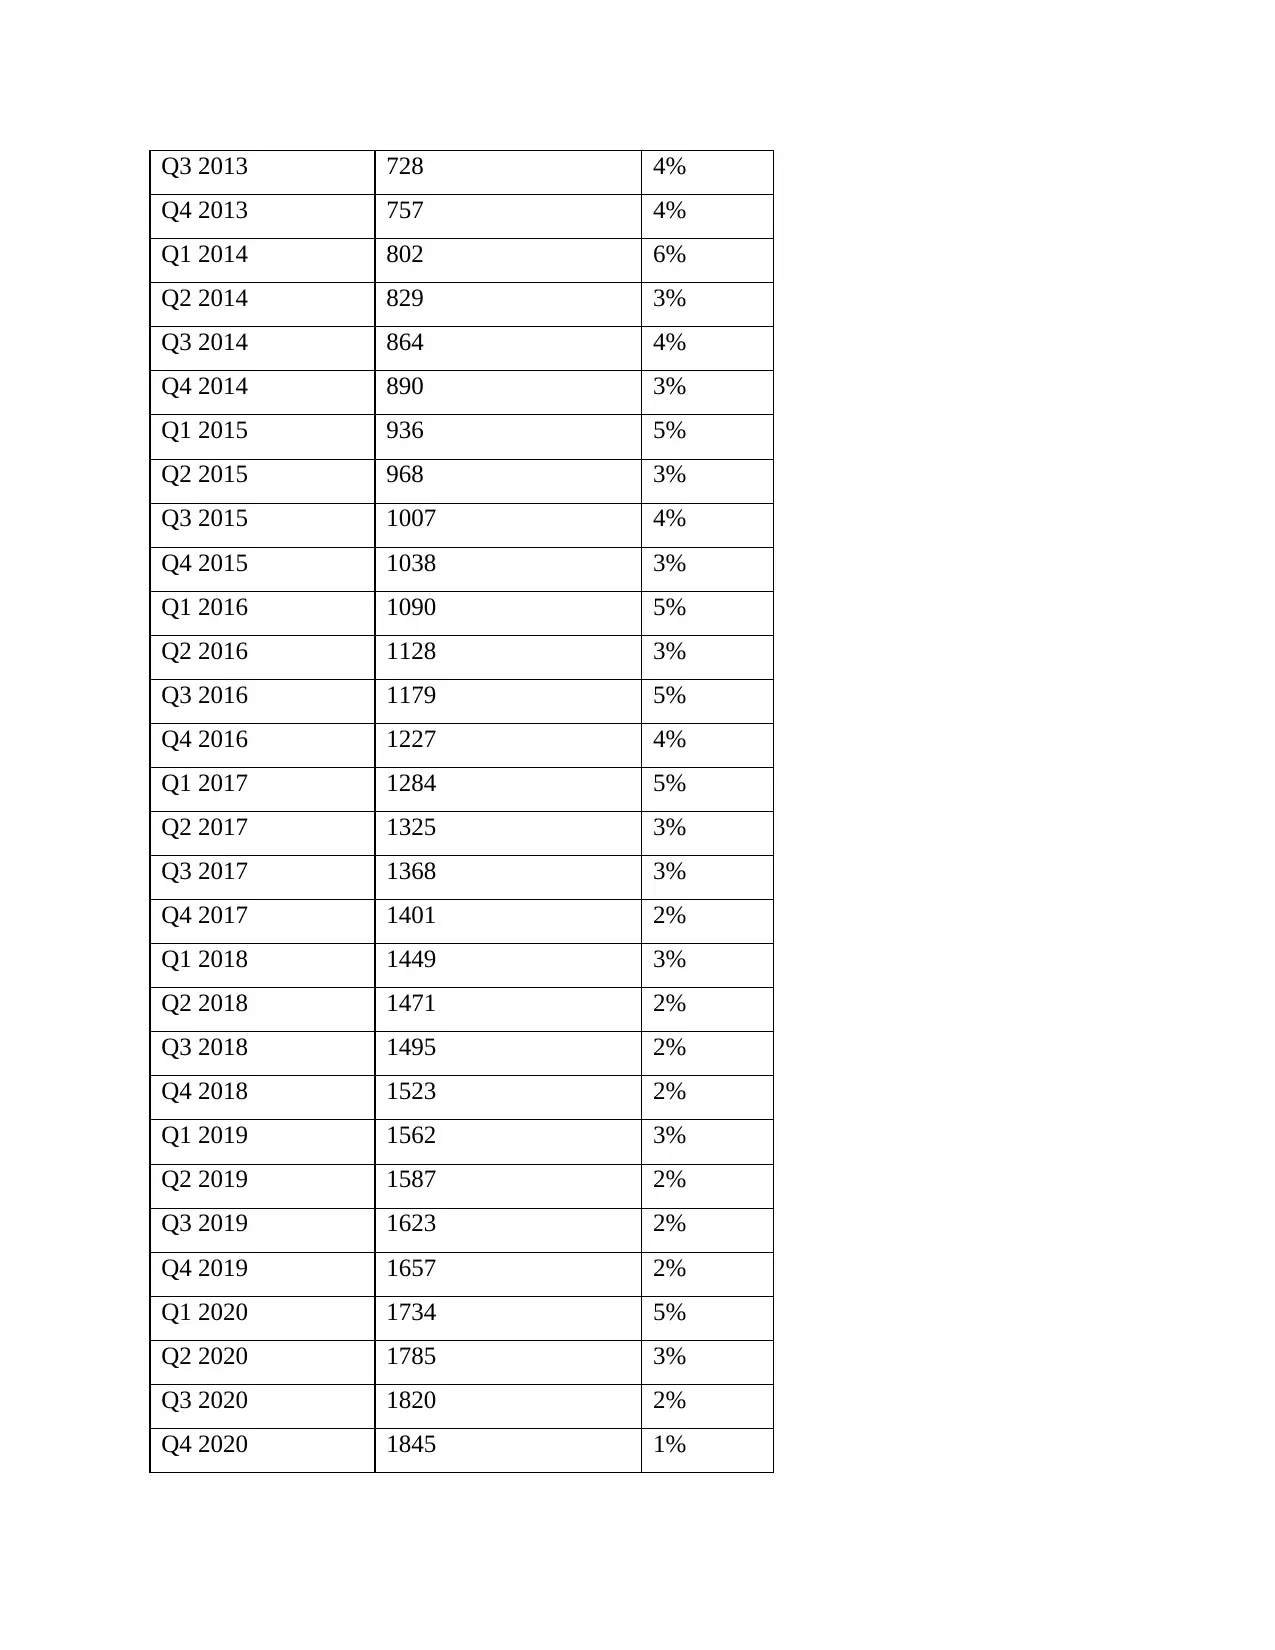
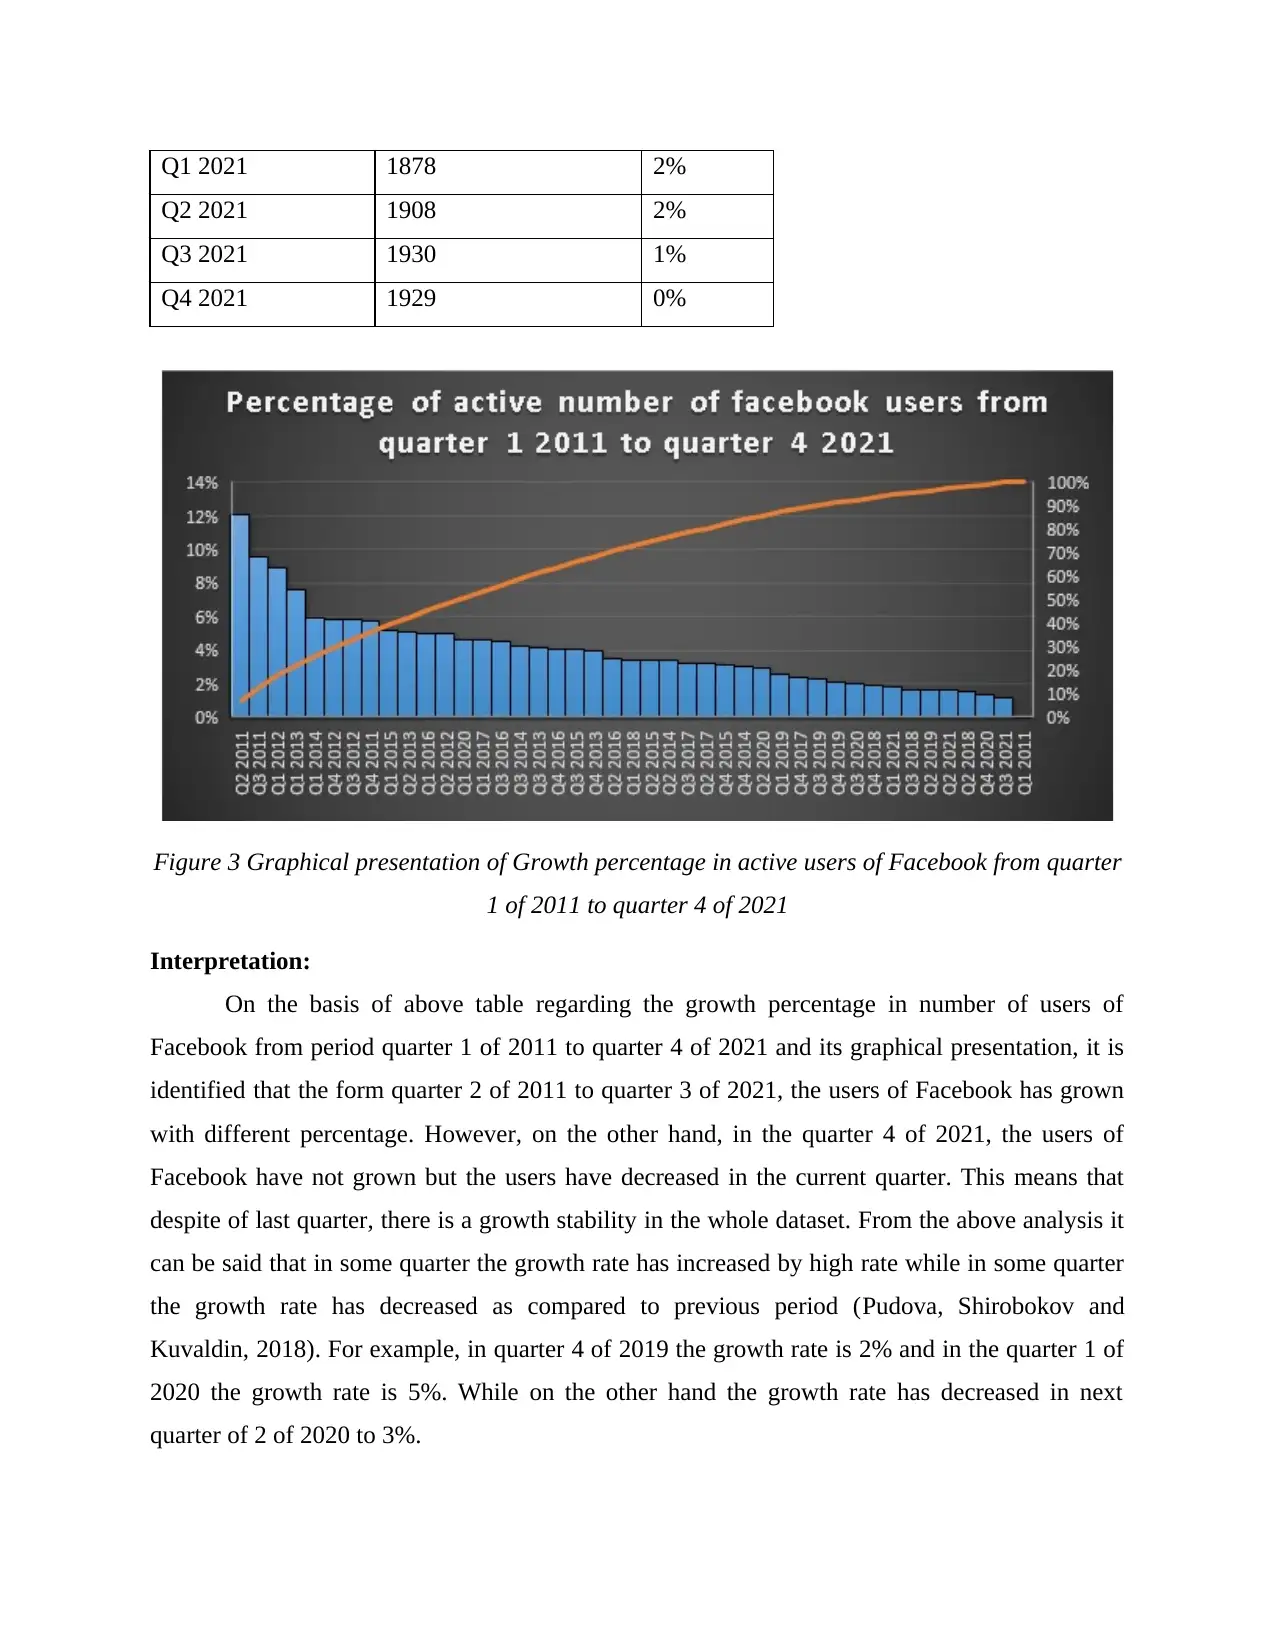
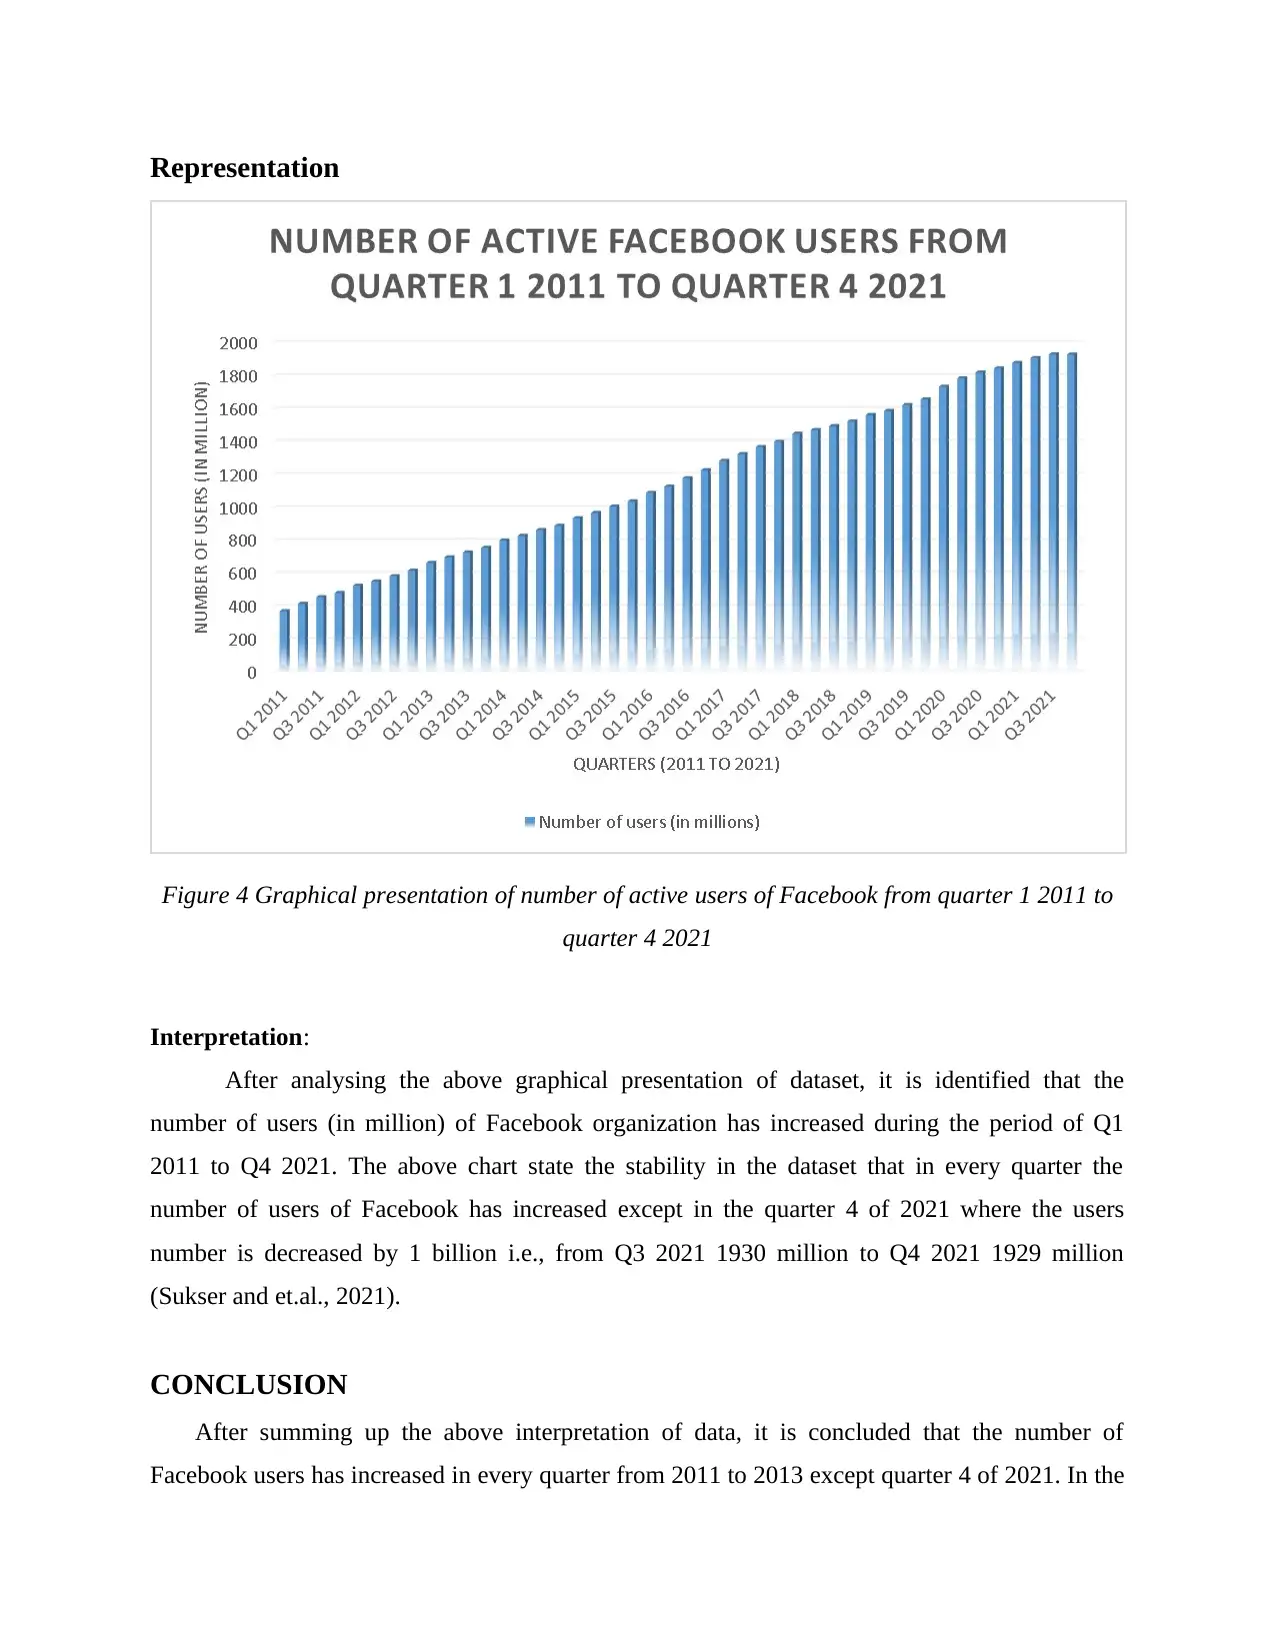
This report provides a detailed analysis of Facebook user statistics from Q1 2011 to Q4 2021 using MS Excel. The analysis includes descriptive statistical techniques such as mean, mode, and median, along with auto-sum features like sum, average, count, minimum, and maximum. Data manipulation is performed to calculate growth percentages, and the results are presented in tables and charts. The report interprets the findings, highlighting trends in user growth, including a decrease in users in Q4 2021. The conclusion summarizes the overall trends and the statistical findings, offering insights into Facebook's user base over the decade.

A1 MS EXCEL TASK
Secure Best Marks with AI Grader
Need help grading? Try our AI Grader for instant feedback on your assignments.

Table of Contents
Brief Description about data............................................................................................................3
Raw Data Presentation.....................................................................................................................3
Statistical Techniques......................................................................................................................4
Data Manipulation...........................................................................................................................5
Representation...............................................................................................................................10
CONCLUSION..............................................................................................................................10
REFERENCES................................................................................................................................1

Brief Description about data
Data Analysis is the process of inspecting, cleansing and transforming the data into
meaningful and useful information. The data selected for the current project is Facebook user’s
statistics. It means in the current project, the number of users Facebook (in million) for the
period of Q1 2011 to Q4 of 2021. After collecting the data, the analysis of data is done using the
descriptive statistical tools such as mean, mode, median and auto-some feature such as sum,
average, minimum, maximum and count.
Raw Data Presentation
Quarters (2011 to
2021)
Number of users (in
millions)
Q1 2011 372
Q2 2011 417
Q3 2011 457
Q4 2011 483
Q1 2012 526
Q2 2012 552
Q3 2012 584
Q4 2012 618
Q1 2013 665
Q2 2013 699
Q3 2013 728
Q4 2013 757
Q1 2014 802
Q2 2014 829
Q3 2014 864
Q4 2014 890
Q1 2015 936
Q2 2015 968
Q3 2015 1007

Q4 2015 1038
Q1 2016 1090
Q2 2016 1128
Q3 2016 1179
Q4 2016 1227
Q1 2017 1284
Q2 2017 1325
Q3 2017 1368
Q4 2017 1401
Q1 2018 1449
Q2 2018 1471
Q3 2018 1495
Q4 2018 1523
Q1 2019 1562
Q2 2019 1587
Q3 2019 1623
Q4 2019 1657
Q1 2020 1734
Q2 2020 1785
Q3 2020 1820
Q4 2020 1845
Q1 2021 1878
Q2 2021 1908
Q3 2021 1930
Q4 2021 1929
Statistical Techniques
Particulars Result
Mean 1167.955
Secure Best Marks with AI Grader
Need help grading? Try our AI Grader for instant feedback on your assignments.

Mode #N/A
Median 1153.5
Figure 1Graphical presentation of mean, mode and median
Interpretation:
Mean: On the basis of above tables and its graphical presentation, the mean of number of
Facebook users is 1167.955 million. This means that the average number of people or users that
uses the Facebook account and app on a daily basis is 1167.955 million.
Mode: The mode of the dataset represents the value that repeat frequently in the whole dataset.
On the basis of above analysis of graph and its graphical representation, it is identified that the
mode of current dataset is n/a. It means there is no data or number of Facebook users that
repeated frequently (Seabrook and et.al., 2018).
Median: Median is the mid value of the data set that lies just in the middle of the whole dataset.
The mid value of the current dataset is 1153.5 million.
Data Manipulation
Manipulation of data using auto-sum formula:
AutoSum Features
Particulars Result

Sum 51390
Average 1167.955
Count 44
Max 1930
Min 372
Figure 2 Graphical presentation of sum, average, count, max and min
Interpretation
Sum: This is one of the significant auto sum feature that state the total value of the whole
dataset. This is computed by totalling the data of whole number of observation. On the basis of
above table and its graphical presentation, it is identified that the total sum of Facebook users
from Q1 2011 to Q4 2021 is 51390 million. This means that during the period of 44 quarter, the
number of Facebook users has increased drastically because people are attracting more towards
the internet and technological innovation in present time.
Average: The average is an auto sum feature and also a descriptive statistic tool which is
computed by dividing the sum of value to the total number of observation or element. On the
basis of above table and its graphical presentation, it is identified and analysed that the average
number of people are the users of Facebook is 1167.954545 million. It means the average users
of Facebooks that uses the Facebook on daily basis during the period of Q1 2011 to Q4 2021 is

1167.954545 million. They are basically loyal customer of Facebook that plays vital role towards
the revenue generation of company (Maithya and Fujimitsu, 2019).
Count: The count is also a feature of auto sum which state that number of observation
and element taken for the purpose of data analysis. After analysing the above table and graph, it
is identified that the total number of observation and count has been taken to analyses the
number of users of Facebook is 44 quarters i.e., Quarter 1 of 2011 to Quarter 4 of 2021.
Max: The maximum feature of auto sum state the maximum value of the whole dataset.
After analysing the above dataset, it is identified that the maximum number of users of Facebook
in the whole dataset is 1930 million. It means in the quarter 3 of 2021, the statistics of Facebook
users have reached its high level where the total number of active users of Facebook is 1930
million.
Min: The minimum feature of auto-sum state the minimum value of the whole dataset
used for the current data analysis. On the basis of analysis of above table and its graphical
presentation, it is identified that the minimum number of Facebook users are 372 million in the
quarter 1 of year 2011 (Dymkowski and et.al., 2018). It is because that was the start of the
Facebook and the technology is not vast and high at that time which result into lower users of
Facebook.
Manipulation of data using Percentage formula:
Quarters (2011 to
2021)
Number of users (in
millions)
Growth
Percentage
Q1 2011 372 0%
Q2 2011 417 12%
Q3 2011 457 10%
Q4 2011 483 6%
Q1 2012 526 9%
Q2 2012 552 5%
Q3 2012 584 6%
Q4 2012 618 6%
Q1 2013 665 8%
Q2 2013 699 5%
Paraphrase This Document
Need a fresh take? Get an instant paraphrase of this document with our AI Paraphraser

Q3 2013 728 4%
Q4 2013 757 4%
Q1 2014 802 6%
Q2 2014 829 3%
Q3 2014 864 4%
Q4 2014 890 3%
Q1 2015 936 5%
Q2 2015 968 3%
Q3 2015 1007 4%
Q4 2015 1038 3%
Q1 2016 1090 5%
Q2 2016 1128 3%
Q3 2016 1179 5%
Q4 2016 1227 4%
Q1 2017 1284 5%
Q2 2017 1325 3%
Q3 2017 1368 3%
Q4 2017 1401 2%
Q1 2018 1449 3%
Q2 2018 1471 2%
Q3 2018 1495 2%
Q4 2018 1523 2%
Q1 2019 1562 3%
Q2 2019 1587 2%
Q3 2019 1623 2%
Q4 2019 1657 2%
Q1 2020 1734 5%
Q2 2020 1785 3%
Q3 2020 1820 2%
Q4 2020 1845 1%

Q1 2021 1878 2%
Q2 2021 1908 2%
Q3 2021 1930 1%
Q4 2021 1929 0%
Figure 3 Graphical presentation of Growth percentage in active users of Facebook from quarter
1 of 2011 to quarter 4 of 2021
Interpretation:
On the basis of above table regarding the growth percentage in number of users of
Facebook from period quarter 1 of 2011 to quarter 4 of 2021 and its graphical presentation, it is
identified that the form quarter 2 of 2011 to quarter 3 of 2021, the users of Facebook has grown
with different percentage. However, on the other hand, in the quarter 4 of 2021, the users of
Facebook have not grown but the users have decreased in the current quarter. This means that
despite of last quarter, there is a growth stability in the whole dataset. From the above analysis it
can be said that in some quarter the growth rate has increased by high rate while in some quarter
the growth rate has decreased as compared to previous period (Pudova, Shirobokov and
Kuvaldin, 2018). For example, in quarter 4 of 2019 the growth rate is 2% and in the quarter 1 of
2020 the growth rate is 5%. While on the other hand the growth rate has decreased in next
quarter of 2 of 2020 to 3%.

Representation
Figure 4 Graphical presentation of number of active users of Facebook from quarter 1 2011 to
quarter 4 2021
Interpretation:
After analysing the above graphical presentation of dataset, it is identified that the
number of users (in million) of Facebook organization has increased during the period of Q1
2011 to Q4 2021. The above chart state the stability in the dataset that in every quarter the
number of users of Facebook has increased except in the quarter 4 of 2021 where the users
number is decreased by 1 billion i.e., from Q3 2021 1930 million to Q4 2021 1929 million
(Sukser and et.al., 2021).
CONCLUSION
After summing up the above interpretation of data, it is concluded that the number of
Facebook users has increased in every quarter from 2011 to 2013 except quarter 4 of 2021. In the
Secure Best Marks with AI Grader
Need help grading? Try our AI Grader for instant feedback on your assignments.

last quarter, the number of users of Facebook has decreased by 1 million. The report has also
concluded the interpretation of mean, mode and median on the basis of calculation done on MS
Excel. Further, the report has also interpreted the result of auto-sum features computed on MS
Excel such as sum, average, count, minimum and maximum.
concluded the interpretation of mean, mode and median on the basis of calculation done on MS
Excel. Further, the report has also interpreted the result of auto-sum features computed on MS
Excel such as sum, average, count, minimum and maximum.

REFERENCES
Books and journals
Maithya, J. and Fujimitsu, Y., 2019. Analysis and interpretation of magnetotelluric data in
characterization of geothermal resource in Eburru geothermal field,
Kenya. Geothermics. 81. pp.12-31.
Dymkowski, K. and et.al., 2018. AbINS: The modern software for INS interpretation. Physica B:
Condensed Matter. 551. pp.443-448.
Pudova, N., Shirobokov, M. and Kuvaldin, A., 2018, June. Application of the attribute analysis
for interpretation of GPR survey data. In 2018 17th International Conference on Ground
Penetrating Radar (GPR) (pp. 1-4). IEEE.
Sukser, V. and et.al., 2021. Assessment of Illumina® Human mtDNA Genome assay: workflow
evaluation with development of analysis and interpretation guidelines. International
Journal of Legal Medicine. 135(4). pp.1161-1178.
Seabrook, E. M. and et.al., 2018. Predicting depression from language-based emotion dynamics:
longitudinal analysis of Facebook and Twitter status updates. Journal of medical Internet
research. 20(5). p.e9267.
1

2
1 out of 13
Related Documents

Your All-in-One AI-Powered Toolkit for Academic Success.
+13062052269
info@desklib.com
Available 24*7 on WhatsApp / Email
Unlock your academic potential
© 2024 | Zucol Services PVT LTD | All rights reserved.