Descriptive Analysis: Growth of Facebook Active Users (2008-2021)
VerifiedAdded on 2023/06/11
|9
|1554
|143
Report
AI Summary
This report provides an analysis of Facebook's active user data from 2008 to 2021 using descriptive statistics. The analysis includes calculations of percentages, mean, mode, median, sum, average, count, maximum, and minimum values to understand the growth patterns of Facebook users over the years. The report highlights the increase in active users from 100 million in 2008 to 2.91 billion in 2021, indicating Facebook's popularity. However, it also notes a continuous decline in the growth rate of active users. Charts and graphs are used to visually represent the data and findings, providing insights into the trends and patterns of Facebook's user base over the 13-year period. The conclusion summarizes the key findings, emphasizing the significant growth in active users and the decreasing growth rate.
1- MS EXCEL TASK
Paraphrase This Document
Need a fresh take? Get an instant paraphrase of this document with our AI Paraphraser
Table of Contents
INTRODUCTION...........................................................................................................................3
MAIN BODY..................................................................................................................................3
Presentation of raw data obtained through sampling for further analysis...................................3
Manipulation of raw data through statistical techniques (Descriptive statistics)........................3
Finding and analysis....................................................................................................................7
CONCLUSION................................................................................................................................8
REFERENCES................................................................................................................................9
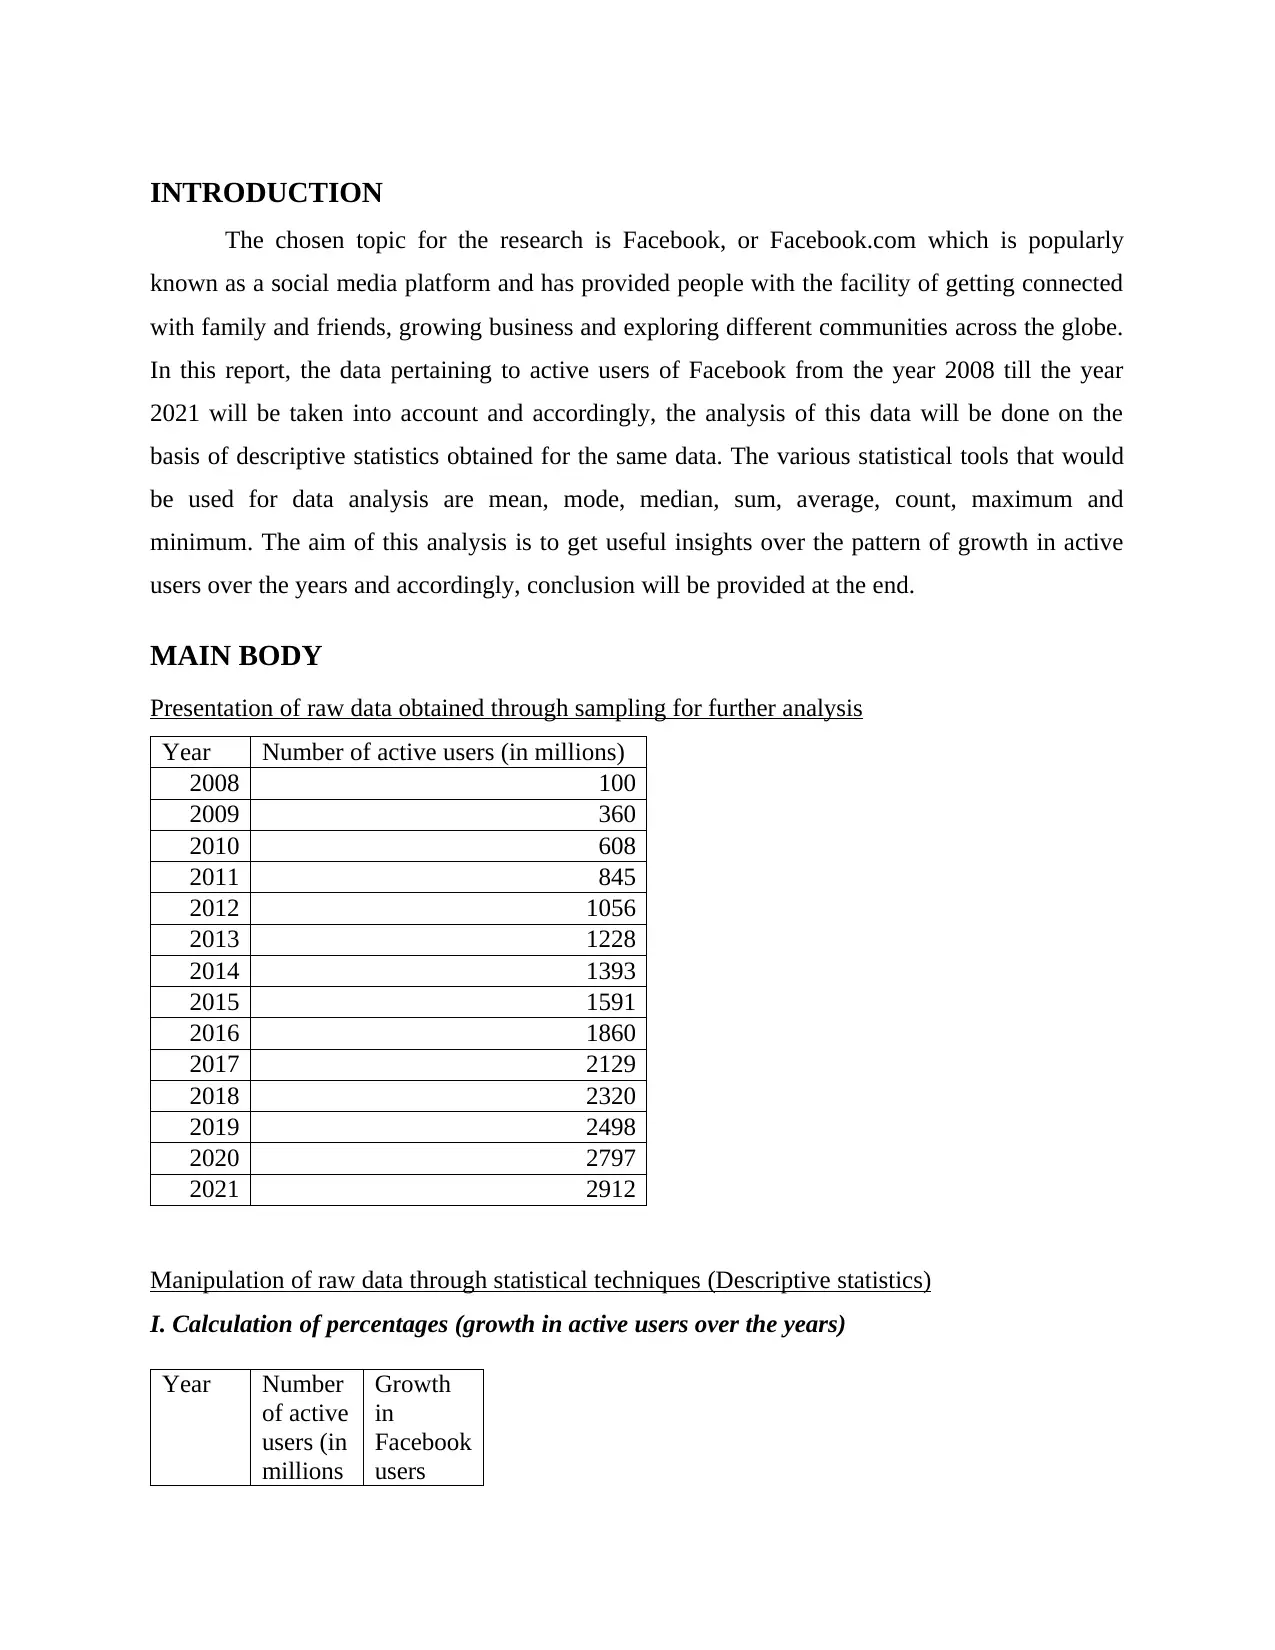
INTRODUCTION
The chosen topic for the research is Facebook, or Facebook.com which is popularly
known as a social media platform and has provided people with the facility of getting connected
with family and friends, growing business and exploring different communities across the globe.
In this report, the data pertaining to active users of Facebook from the year 2008 till the year
2021 will be taken into account and accordingly, the analysis of this data will be done on the
basis of descriptive statistics obtained for the same data. The various statistical tools that would
be used for data analysis are mean, mode, median, sum, average, count, maximum and
minimum. The aim of this analysis is to get useful insights over the pattern of growth in active
users over the years and accordingly, conclusion will be provided at the end.
MAIN BODY
Presentation of raw data obtained through sampling for further analysis
Year Number of active users (in millions)
2008 100
2009 360
2010 608
2011 845
2012 1056
2013 1228
2014 1393
2015 1591
2016 1860
2017 2129
2018 2320
2019 2498
2020 2797
2021 2912
Manipulation of raw data through statistical techniques (Descriptive statistics)
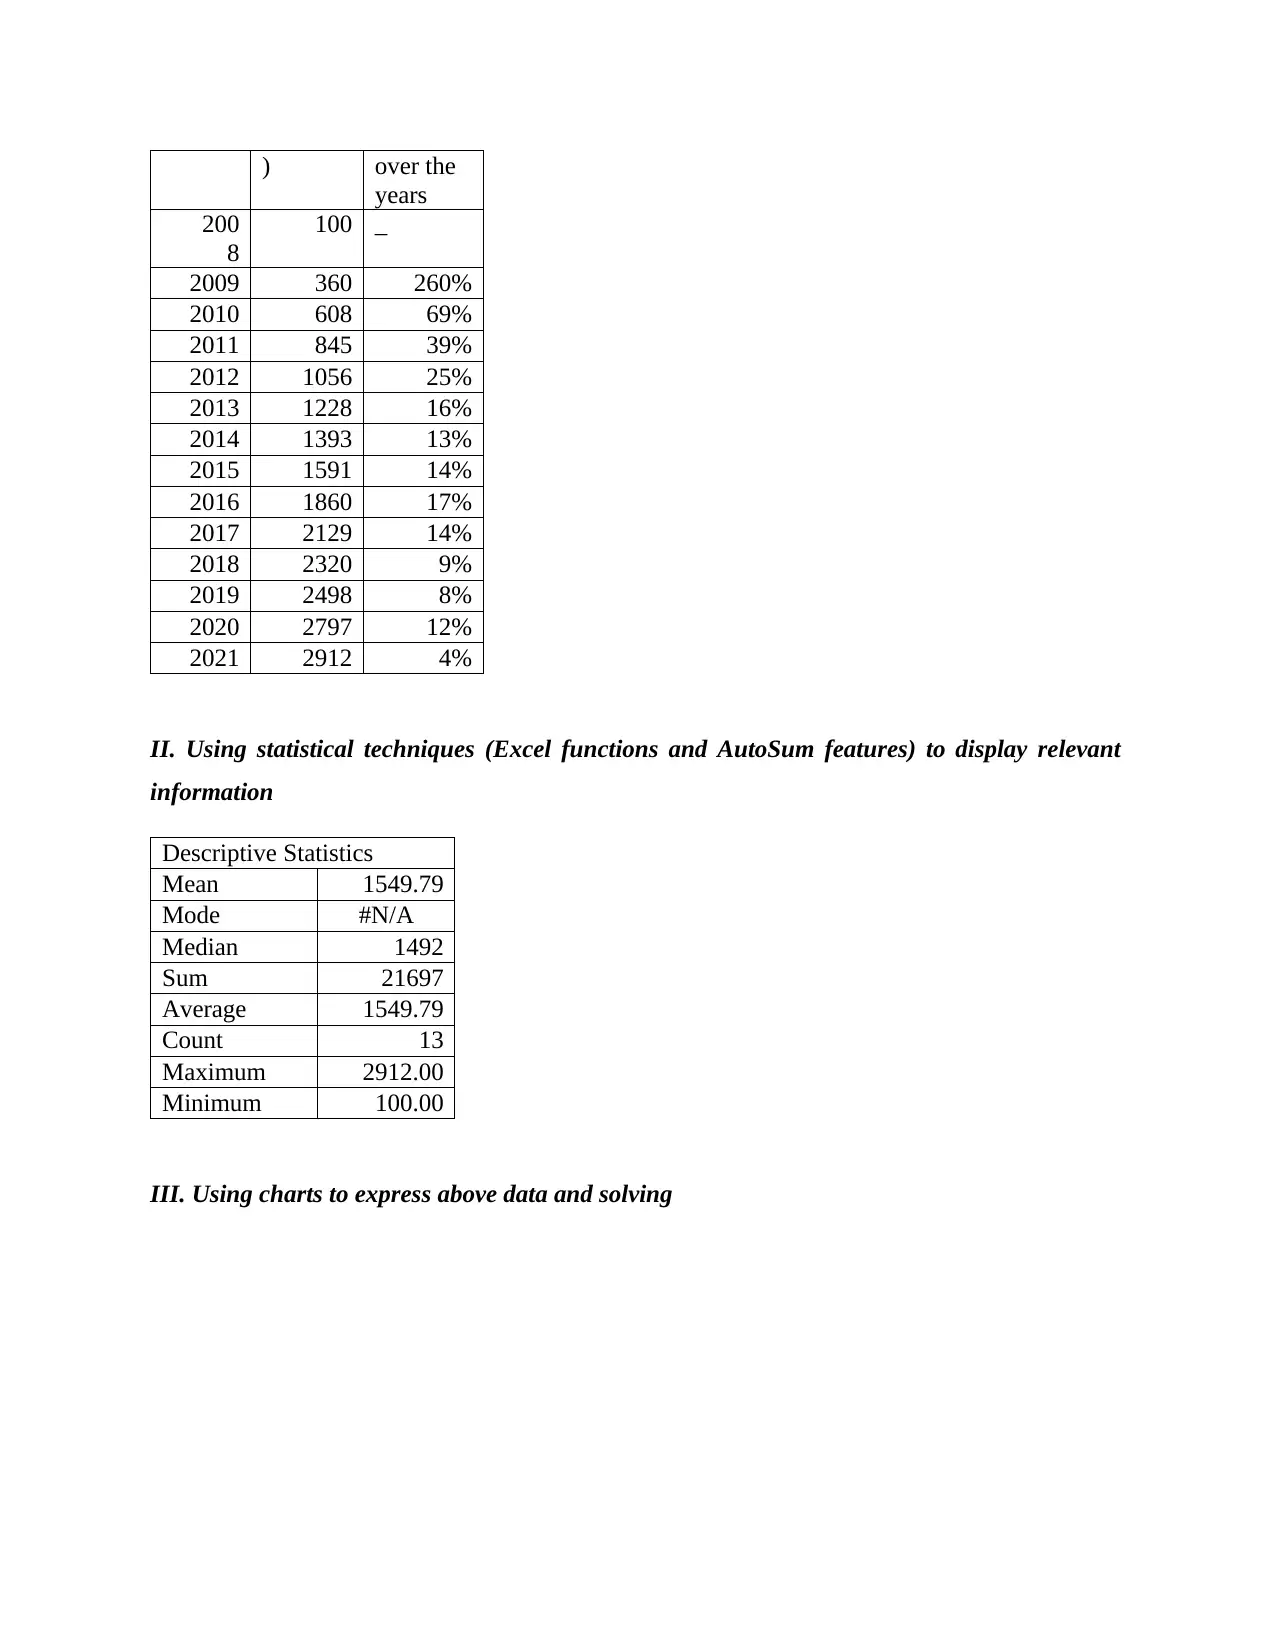
I. Calculation of percentages (growth in active users over the years)
Year Number
of active
users (in
millions
Growth
in
Facebook
users
The chosen topic for the research is Facebook, or Facebook.com which is popularly
known as a social media platform and has provided people with the facility of getting connected
with family and friends, growing business and exploring different communities across the globe.
In this report, the data pertaining to active users of Facebook from the year 2008 till the year
2021 will be taken into account and accordingly, the analysis of this data will be done on the
basis of descriptive statistics obtained for the same data. The various statistical tools that would
be used for data analysis are mean, mode, median, sum, average, count, maximum and
minimum. The aim of this analysis is to get useful insights over the pattern of growth in active
users over the years and accordingly, conclusion will be provided at the end.
MAIN BODY
Presentation of raw data obtained through sampling for further analysis
Year Number of active users (in millions)
2008 100
2009 360
2010 608
2011 845
2012 1056
2013 1228
2014 1393
2015 1591
2016 1860
2017 2129
2018 2320
2019 2498
2020 2797
2021 2912
Manipulation of raw data through statistical techniques (Descriptive statistics)
I. Calculation of percentages (growth in active users over the years)
Year Number
of active
users (in
millions
Growth
in
users
⊘ This is a preview!⊘
Do you want full access?
Subscribe today to unlock all pages.
Trusted by 1+ million students worldwide
) over the
years
200
8
100 _
2009 360 260%
2010 608 69%
2011 845 39%
2012 1056 25%
2013 1228 16%
2014 1393 13%
2015 1591 14%
2016 1860 17%
2017 2129 14%
2018 2320 9%
2019 2498 8%
2020 2797 12%
2021 2912 4%
II. Using statistical techniques (Excel functions and AutoSum features) to display relevant
information
Descriptive Statistics
Mean 1549.79
Mode #N/A
Median 1492
Sum 21697
Average 1549.79
Count 13
Maximum 2912.00
Minimum 100.00
III. Using charts to express above data and solving
Paraphrase This Document
Need a fresh take? Get an instant paraphrase of this document with our AI Paraphraser
Me a n
Mo d e
Me d ia n
0.0
200.0
400.0
600.0
800.0
1000.0
1200.0
1400.0
1600.0
1800.0
1549.785
71428571
0
1492
Descriptive statistics
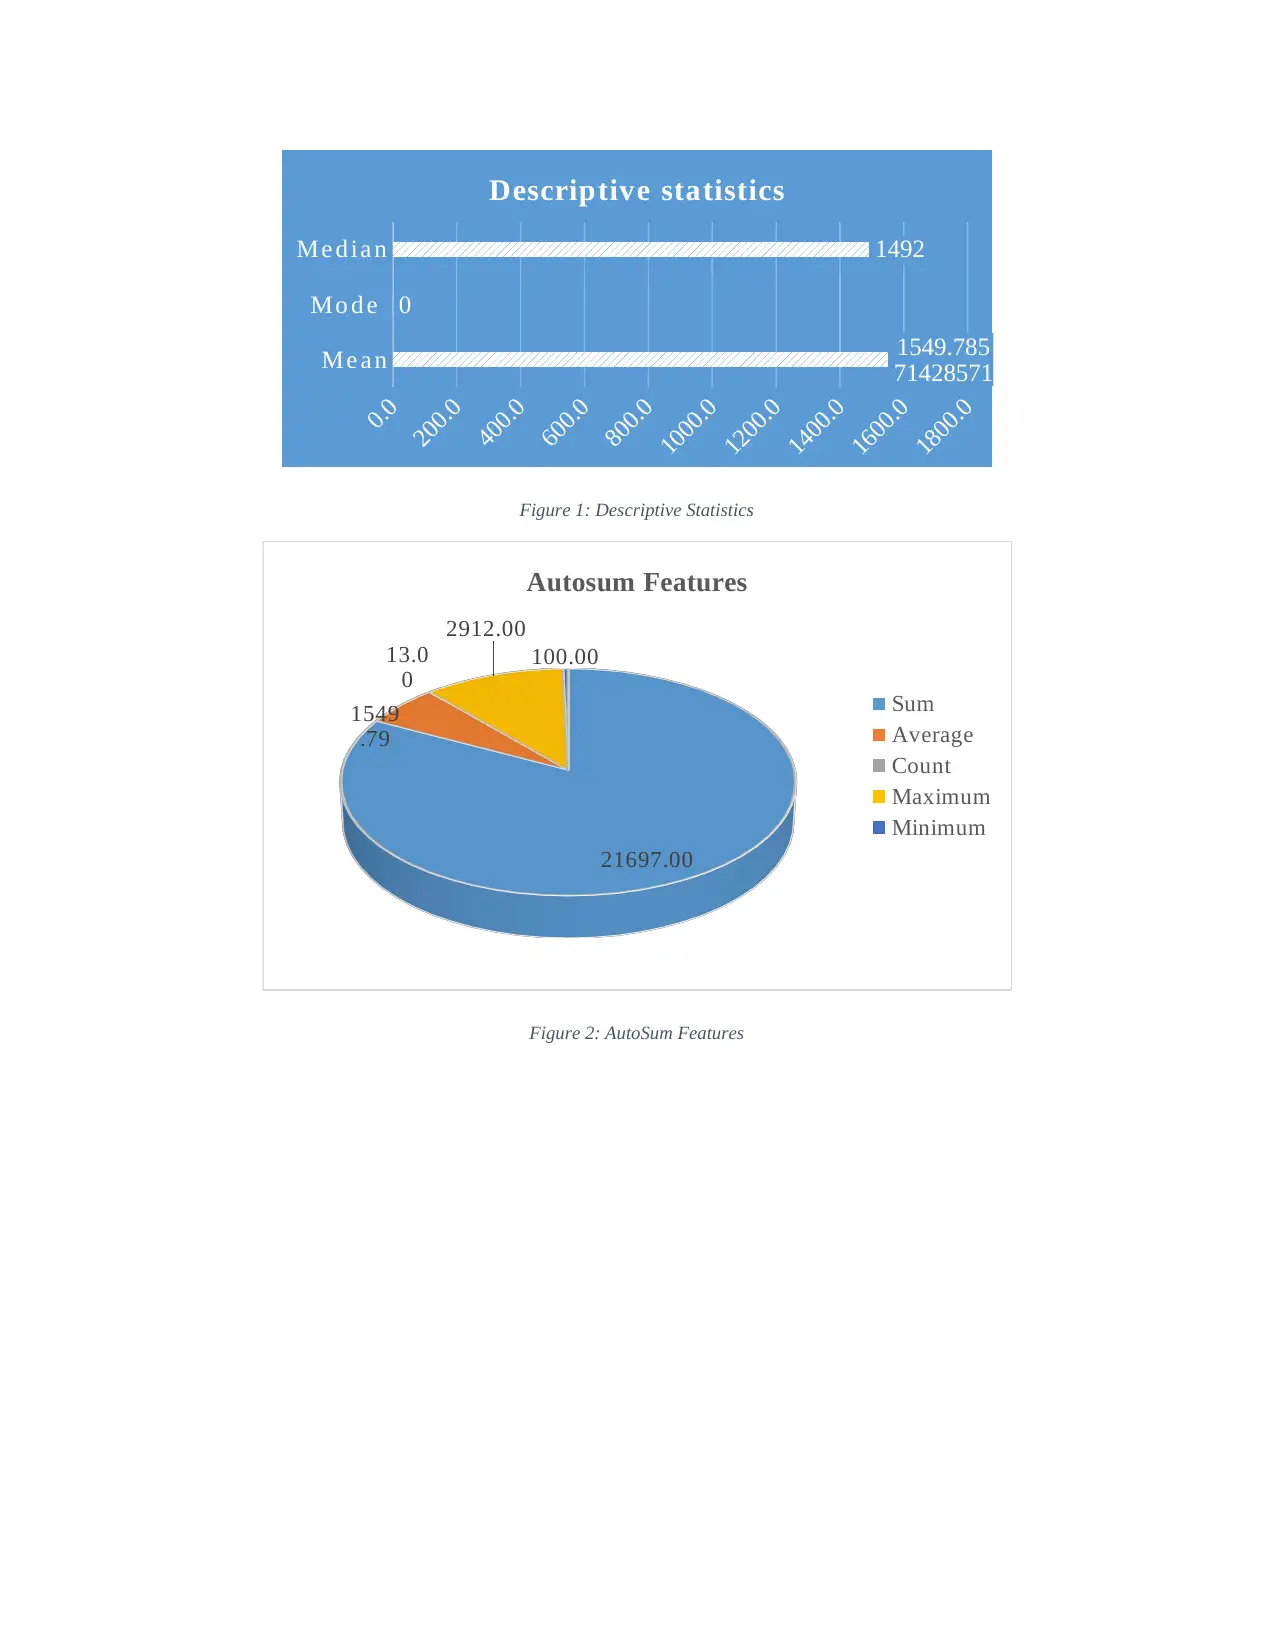
Figure 1: Descriptive Statistics
21697.00
1549
.79
13.0
0
2912.00
100.00
Autosum Features
Sum
Average
Count
Maximum
Minimum
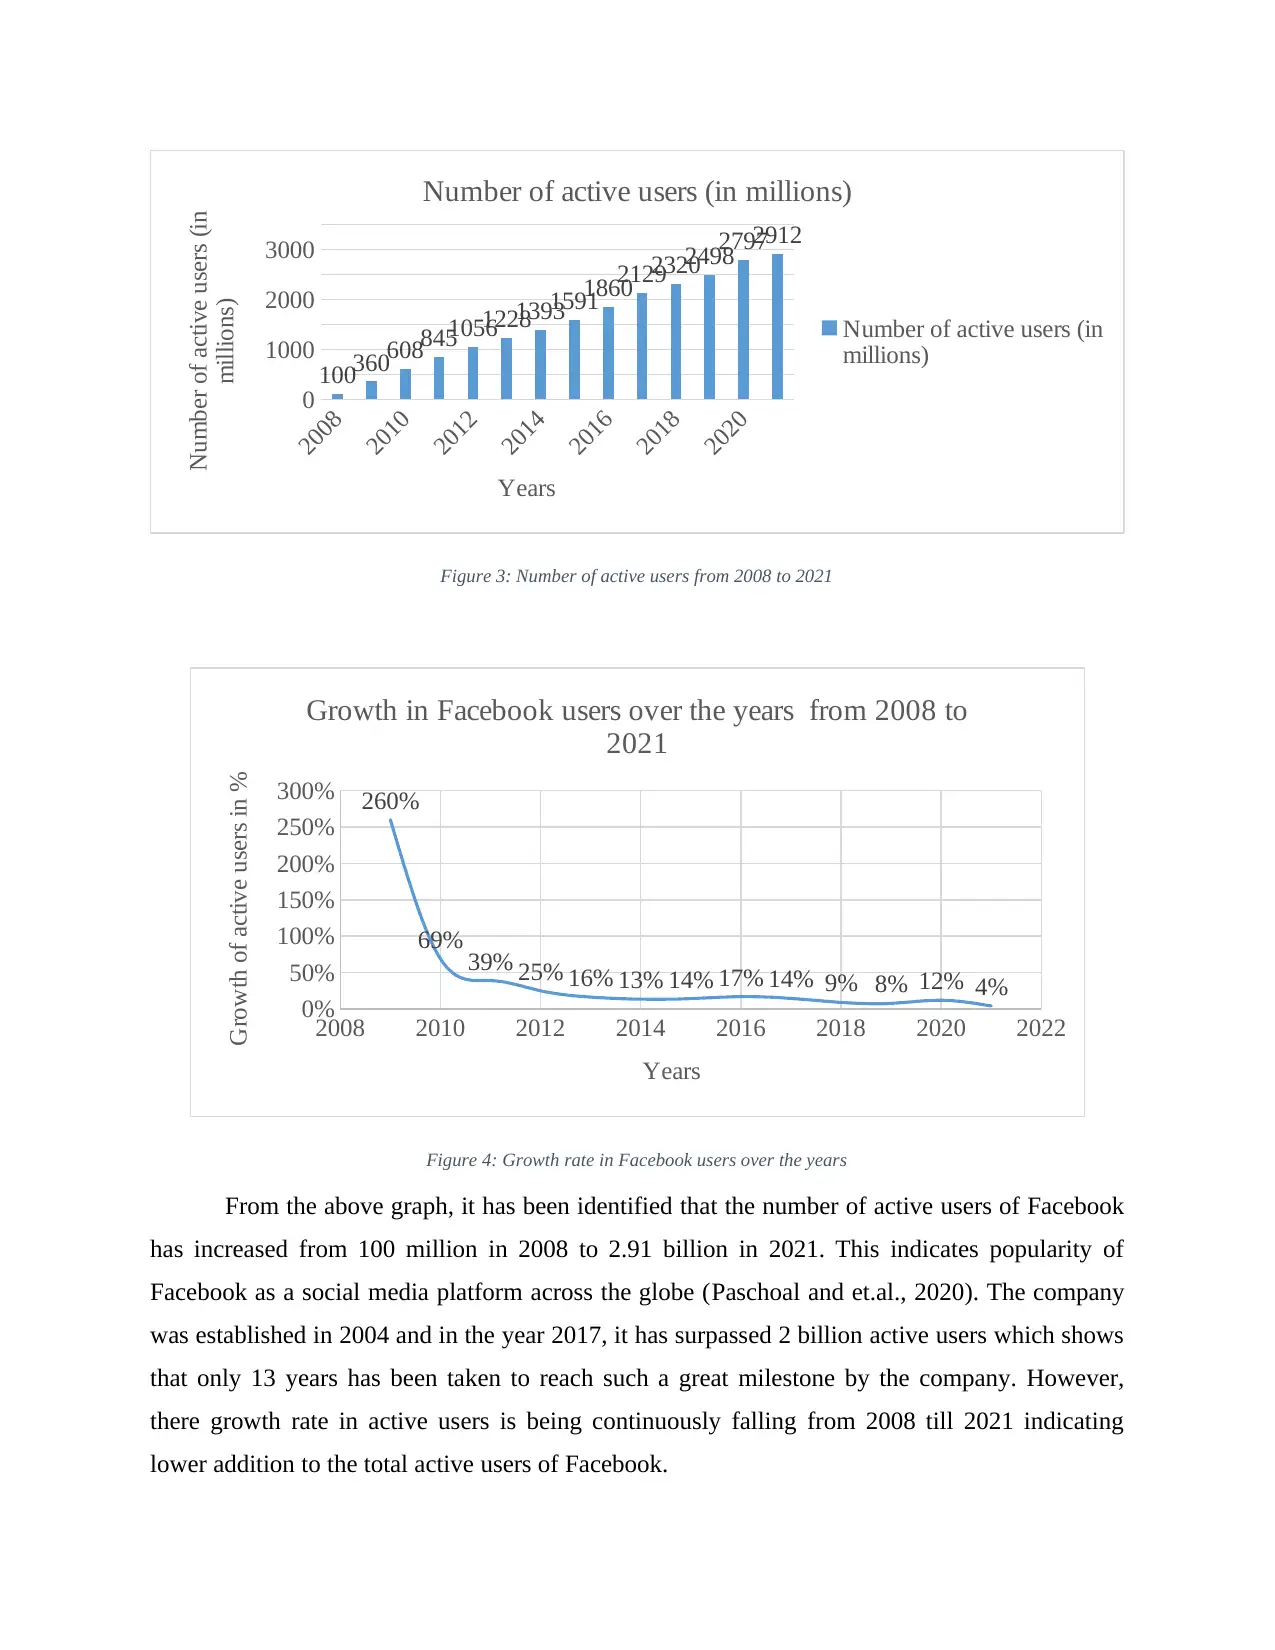
Figure 2: AutoSum Features
Mo d e
Me d ia n
0.0
200.0
400.0
600.0
800.0
1000.0
1200.0
1400.0
1600.0
1800.0
1549.785
71428571
0
1492
Descriptive statistics
Figure 1: Descriptive Statistics
21697.00
1549
.79
13.0
0
2912.00
100.00
Autosum Features
Sum
Average
Count
Maximum
Minimum
Figure 2: AutoSum Features
2008
2010
2012
2014
2016
2018
2020
0
1000
2000
3000
1003606088451056122813931591
1860
212923202498
27972912
Number of active users (in millions)
Number of active users (in
millions)
Years
Number of active users (in
millions)
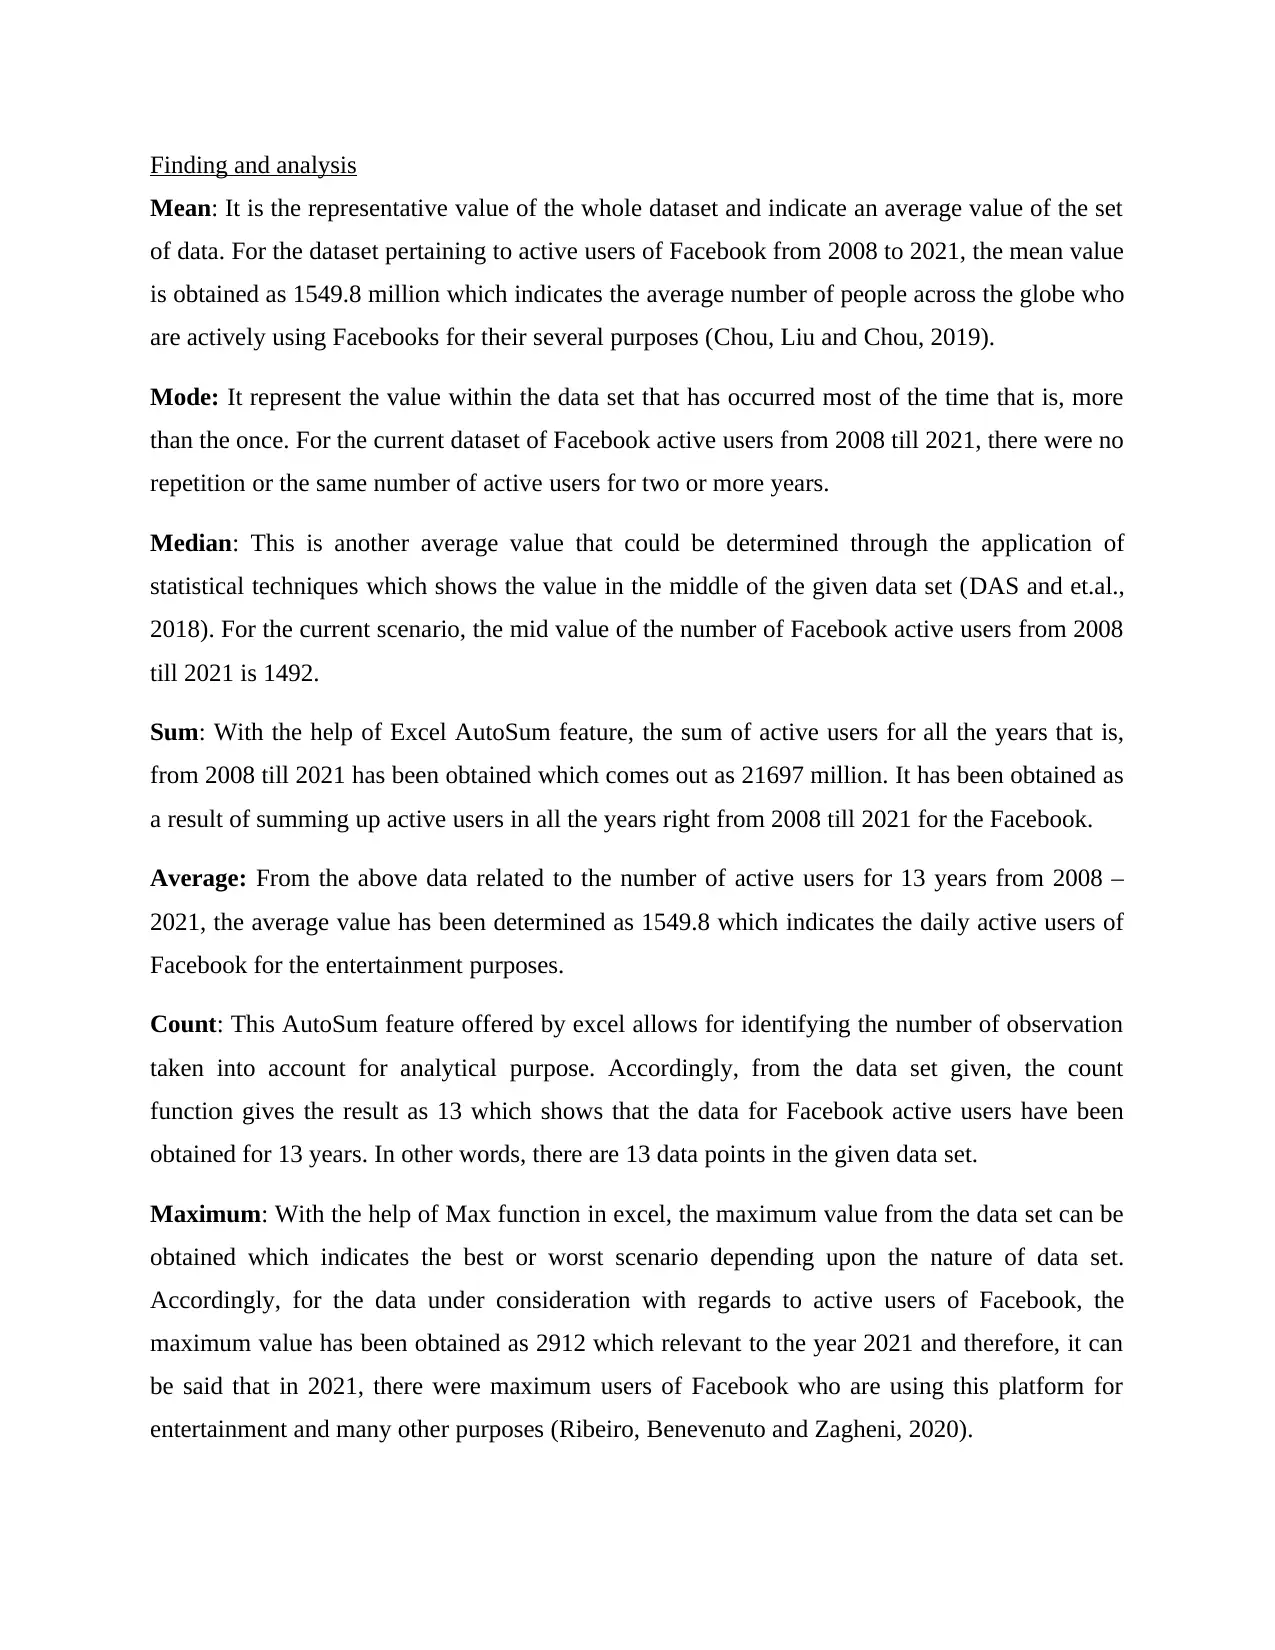
Figure 3: Number of active users from 2008 to 2021
2008 2010 2012 2014 2016 2018 2020 2022
0%
50%
100%
150%
200%
250%
300% 260%
69% 39% 25% 16% 13% 14% 17% 14% 9% 8% 12% 4%
Growth in Facebook users over the years from 2008 to
2021
Years
Growth of active users in %
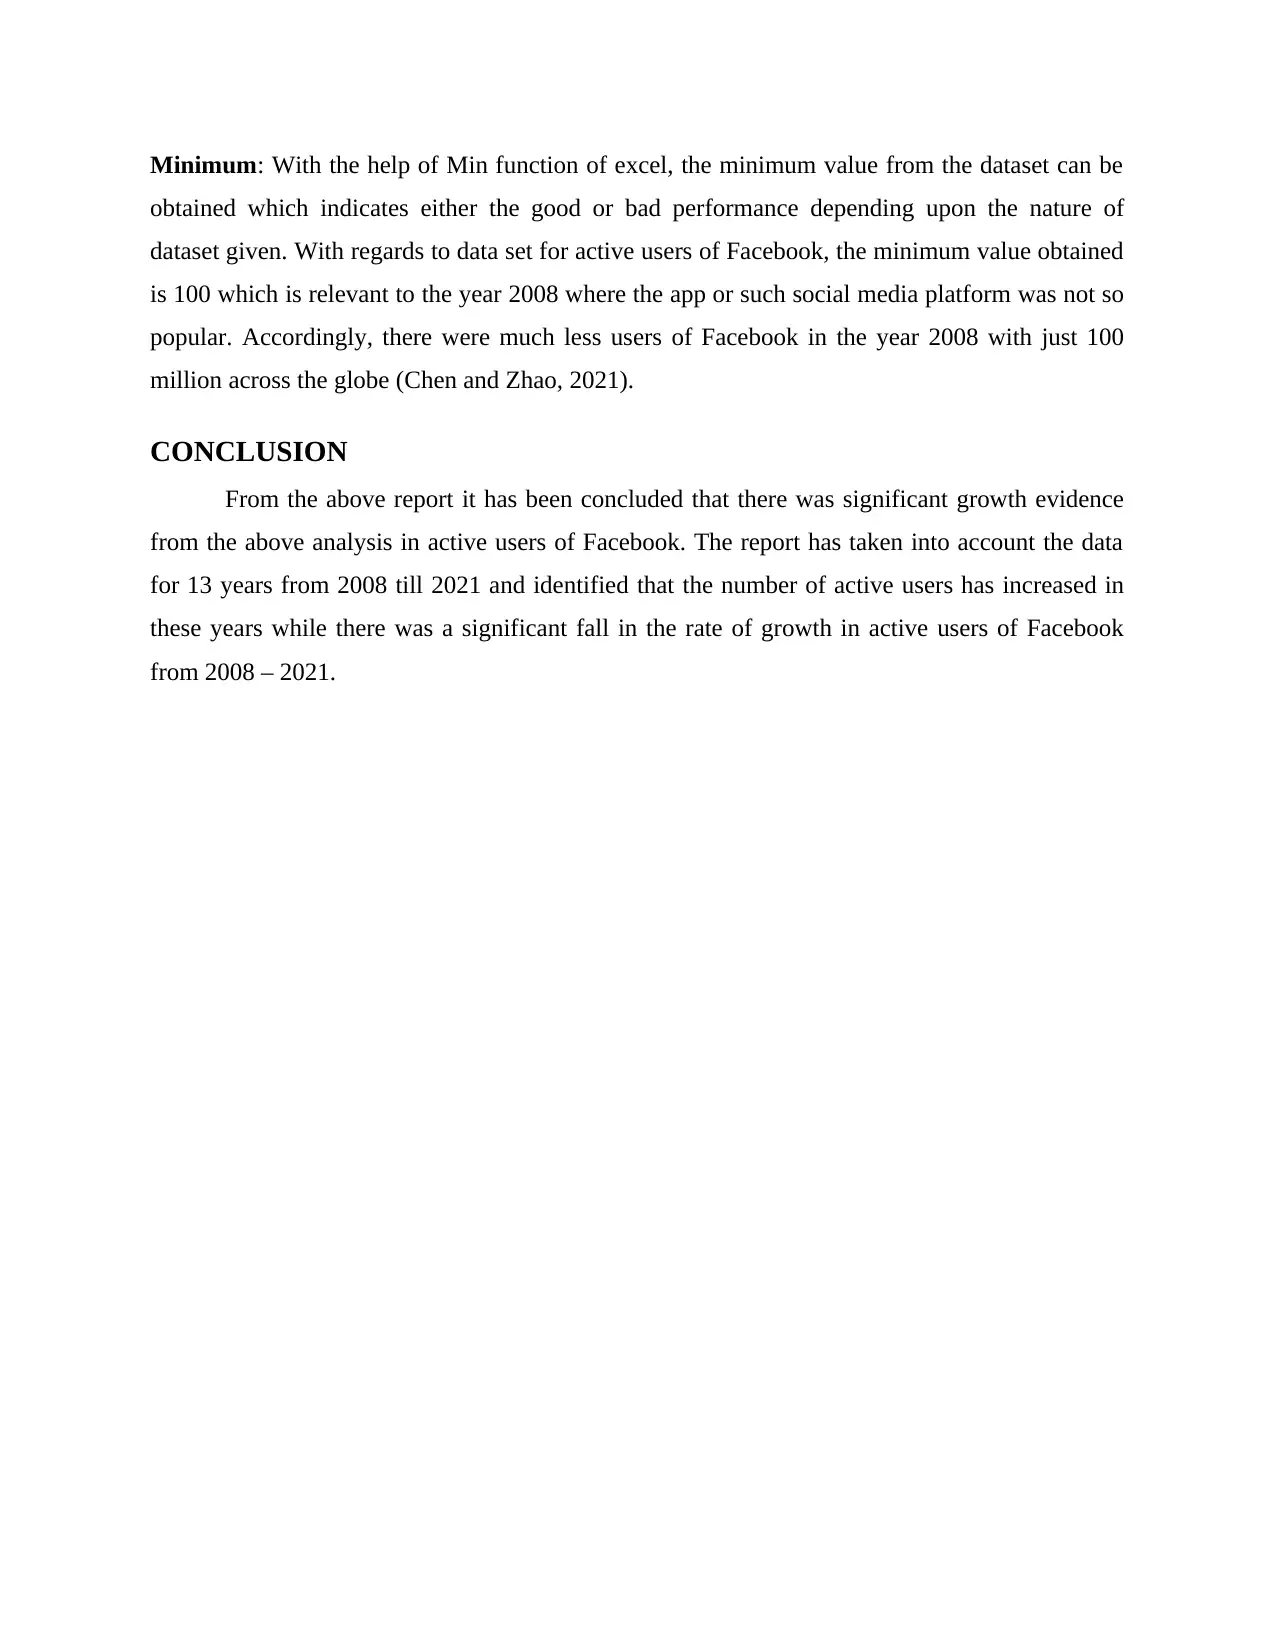
Figure 4: Growth rate in Facebook users over the years
From the above graph, it has been identified that the number of active users of Facebook
has increased from 100 million in 2008 to 2.91 billion in 2021. This indicates popularity of
Facebook as a social media platform across the globe (Paschoal and et.al., 2020). The company
was established in 2004 and in the year 2017, it has surpassed 2 billion active users which shows
that only 13 years has been taken to reach such a great milestone by the company. However,
there growth rate in active users is being continuously falling from 2008 till 2021 indicating
lower addition to the total active users of Facebook.
2010
2012
2014
2016
2018
2020
0
1000
2000
3000
1003606088451056122813931591
1860
212923202498
27972912
Number of active users (in millions)
Number of active users (in
millions)
Years
Number of active users (in
millions)
Figure 3: Number of active users from 2008 to 2021
2008 2010 2012 2014 2016 2018 2020 2022
0%
50%
100%
150%
200%
250%
300% 260%
69% 39% 25% 16% 13% 14% 17% 14% 9% 8% 12% 4%
Growth in Facebook users over the years from 2008 to
2021
Years
Growth of active users in %
Figure 4: Growth rate in Facebook users over the years
From the above graph, it has been identified that the number of active users of Facebook
has increased from 100 million in 2008 to 2.91 billion in 2021. This indicates popularity of
Facebook as a social media platform across the globe (Paschoal and et.al., 2020). The company
was established in 2004 and in the year 2017, it has surpassed 2 billion active users which shows
that only 13 years has been taken to reach such a great milestone by the company. However,
there growth rate in active users is being continuously falling from 2008 till 2021 indicating
lower addition to the total active users of Facebook.
⊘ This is a preview!⊘
Do you want full access?
Subscribe today to unlock all pages.
Trusted by 1+ million students worldwide
Finding and analysis
Mean: It is the representative value of the whole dataset and indicate an average value of the set
of data. For the dataset pertaining to active users of Facebook from 2008 to 2021, the mean value
is obtained as 1549.8 million which indicates the average number of people across the globe who
are actively using Facebooks for their several purposes (Chou, Liu and Chou, 2019).
Mode: It represent the value within the data set that has occurred most of the time that is, more
than the once. For the current dataset of Facebook active users from 2008 till 2021, there were no
repetition or the same number of active users for two or more years.
Median: This is another average value that could be determined through the application of
statistical techniques which shows the value in the middle of the given data set (DAS and et.al.,
2018). For the current scenario, the mid value of the number of Facebook active users from 2008
till 2021 is 1492.
Sum: With the help of Excel AutoSum feature, the sum of active users for all the years that is,
from 2008 till 2021 has been obtained which comes out as 21697 million. It has been obtained as
a result of summing up active users in all the years right from 2008 till 2021 for the Facebook.
Average: From the above data related to the number of active users for 13 years from 2008 –
2021, the average value has been determined as 1549.8 which indicates the daily active users of
Facebook for the entertainment purposes.
Count: This AutoSum feature offered by excel allows for identifying the number of observation
taken into account for analytical purpose. Accordingly, from the data set given, the count
function gives the result as 13 which shows that the data for Facebook active users have been
obtained for 13 years. In other words, there are 13 data points in the given data set.
Maximum: With the help of Max function in excel, the maximum value from the data set can be
obtained which indicates the best or worst scenario depending upon the nature of data set.
Accordingly, for the data under consideration with regards to active users of Facebook, the
maximum value has been obtained as 2912 which relevant to the year 2021 and therefore, it can
be said that in 2021, there were maximum users of Facebook who are using this platform for
entertainment and many other purposes (Ribeiro, Benevenuto and Zagheni, 2020).
Paraphrase This Document
Need a fresh take? Get an instant paraphrase of this document with our AI Paraphraser
Minimum: With the help of Min function of excel, the minimum value from the dataset can be
obtained which indicates either the good or bad performance depending upon the nature of
dataset given. With regards to data set for active users of Facebook, the minimum value obtained
is 100 which is relevant to the year 2008 where the app or such social media platform was not so
popular. Accordingly, there were much less users of Facebook in the year 2008 with just 100
million across the globe (Chen and Zhao, 2021).
CONCLUSION
From the above report it has been concluded that there was significant growth evidence
from the above analysis in active users of Facebook. The report has taken into account the data
for 13 years from 2008 till 2021 and identified that the number of active users has increased in
these years while there was a significant fall in the rate of growth in active users of Facebook
from 2008 – 2021.
REFERENCES
Chen, Y. R. R. and Zhao, X., 2021. Digital dialogue in online brand communities: Examining the
social network outcomes of brands’ dialogue with facebook users. Telematics and
Informatics, 57, p.101507.
Chou, H. L., Liu, Y. L. and Chou, C., 2019. Privacy behavior profiles of underage Facebook
users. Computers & Education, 128, pp.473-485.
DAS, S., and et.al., 2018. Study on impact of socioeconomic makeup of Facebook users on
purchasing behavior. Revista Espacios, 39(33).
Paschoal, F., and et.al., 2020. Physical activity level of facebook users. Revista Brasileira de
Medicina do Esporte, 26, pp.517-522.
Ribeiro, F. N., Benevenuto, F. and Zagheni, E., 2020, July. How biased is the population of
Facebook users? Comparing the demographics of Facebook users with census data to
generate correction factors. In 12th ACM Conference on Web Science (pp. 325-334).
⊘ This is a preview!⊘
Do you want full access?
Subscribe today to unlock all pages.
Trusted by 1+ million students worldwide
1 out of 9
Your All-in-One AI-Powered Toolkit for Academic Success.
+13062052269
info@desklib.com
Available 24*7 on WhatsApp / Email
![[object Object]](/_next/static/media/star-bottom.7253800d.svg)
Unlock your academic potential
Copyright © 2020–2026 A2Z Services. All Rights Reserved. Developed and managed by ZUCOL.