A Finance Case Study on Facebook's Valuation and Zynga's Influence

Verified

Added on  2022/11/18

|11
|1403
|265
Case Study
AI Summary
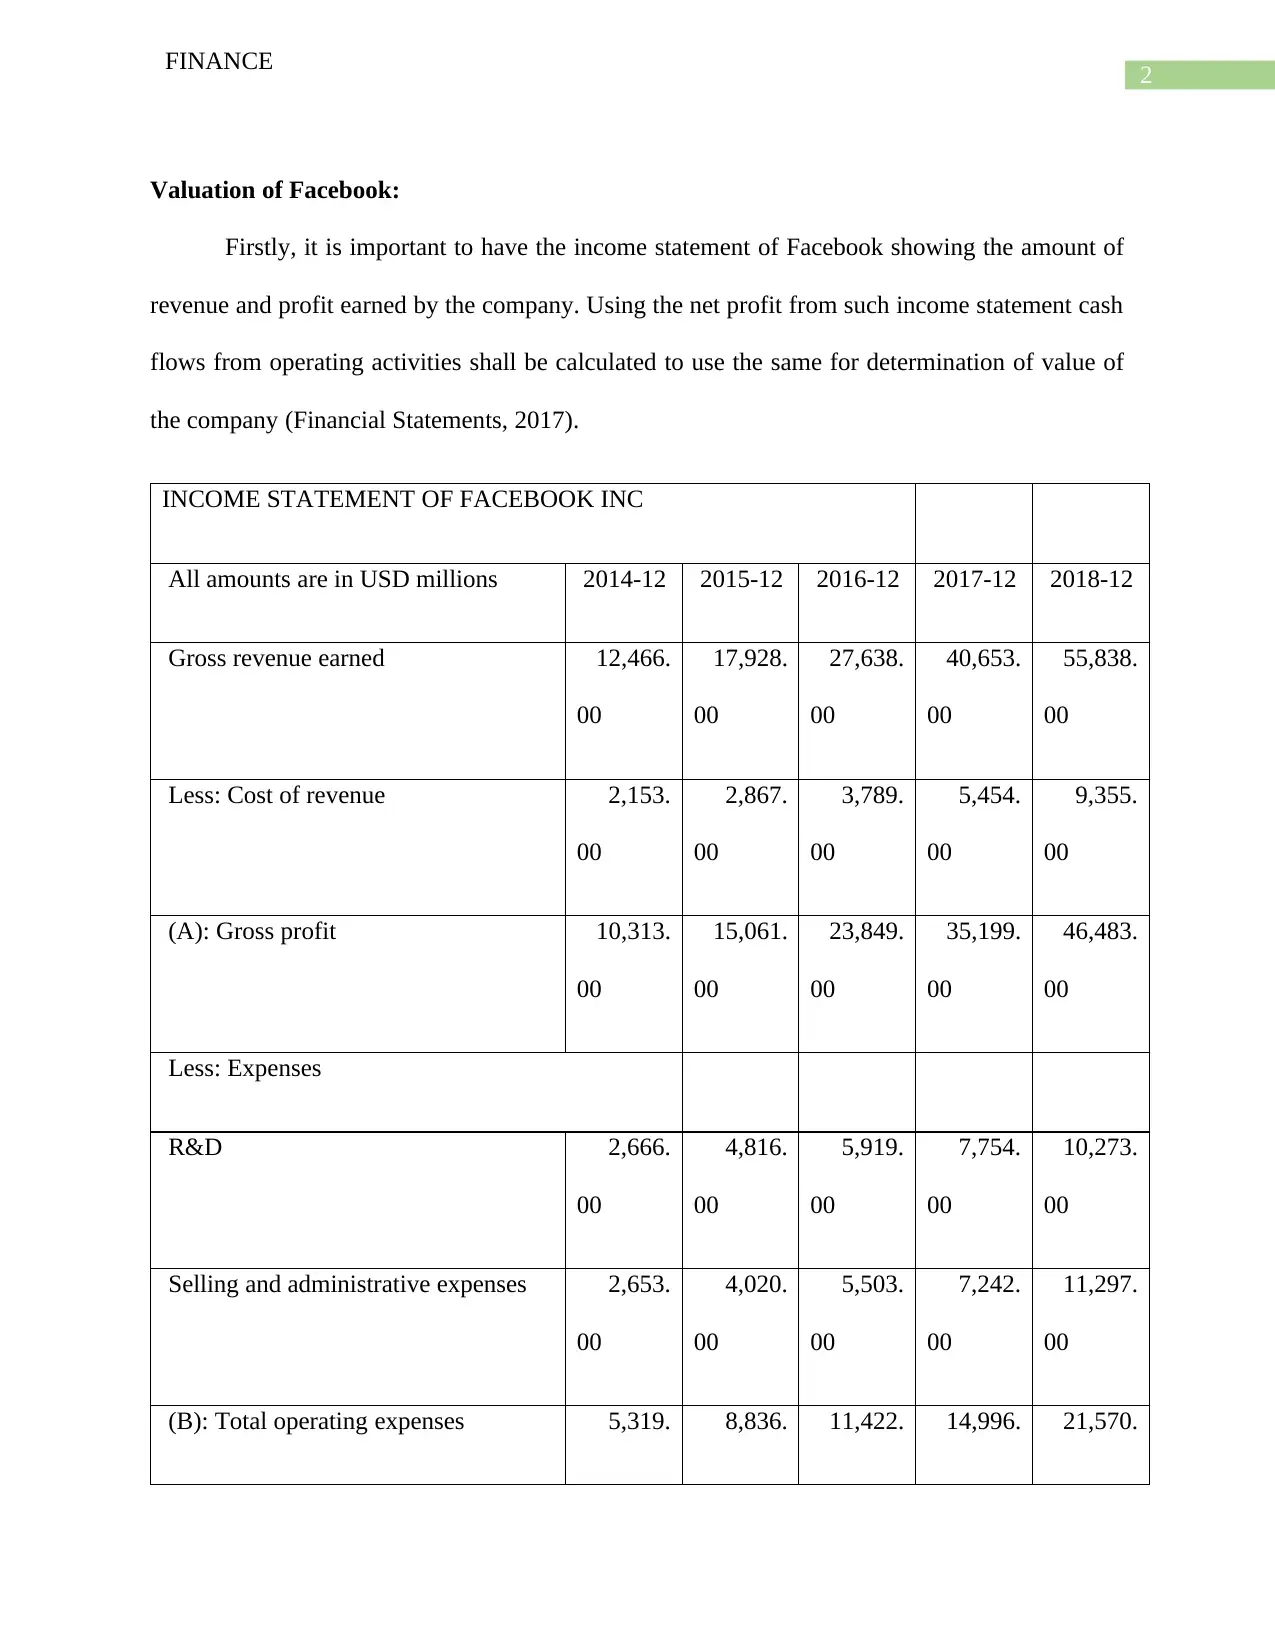
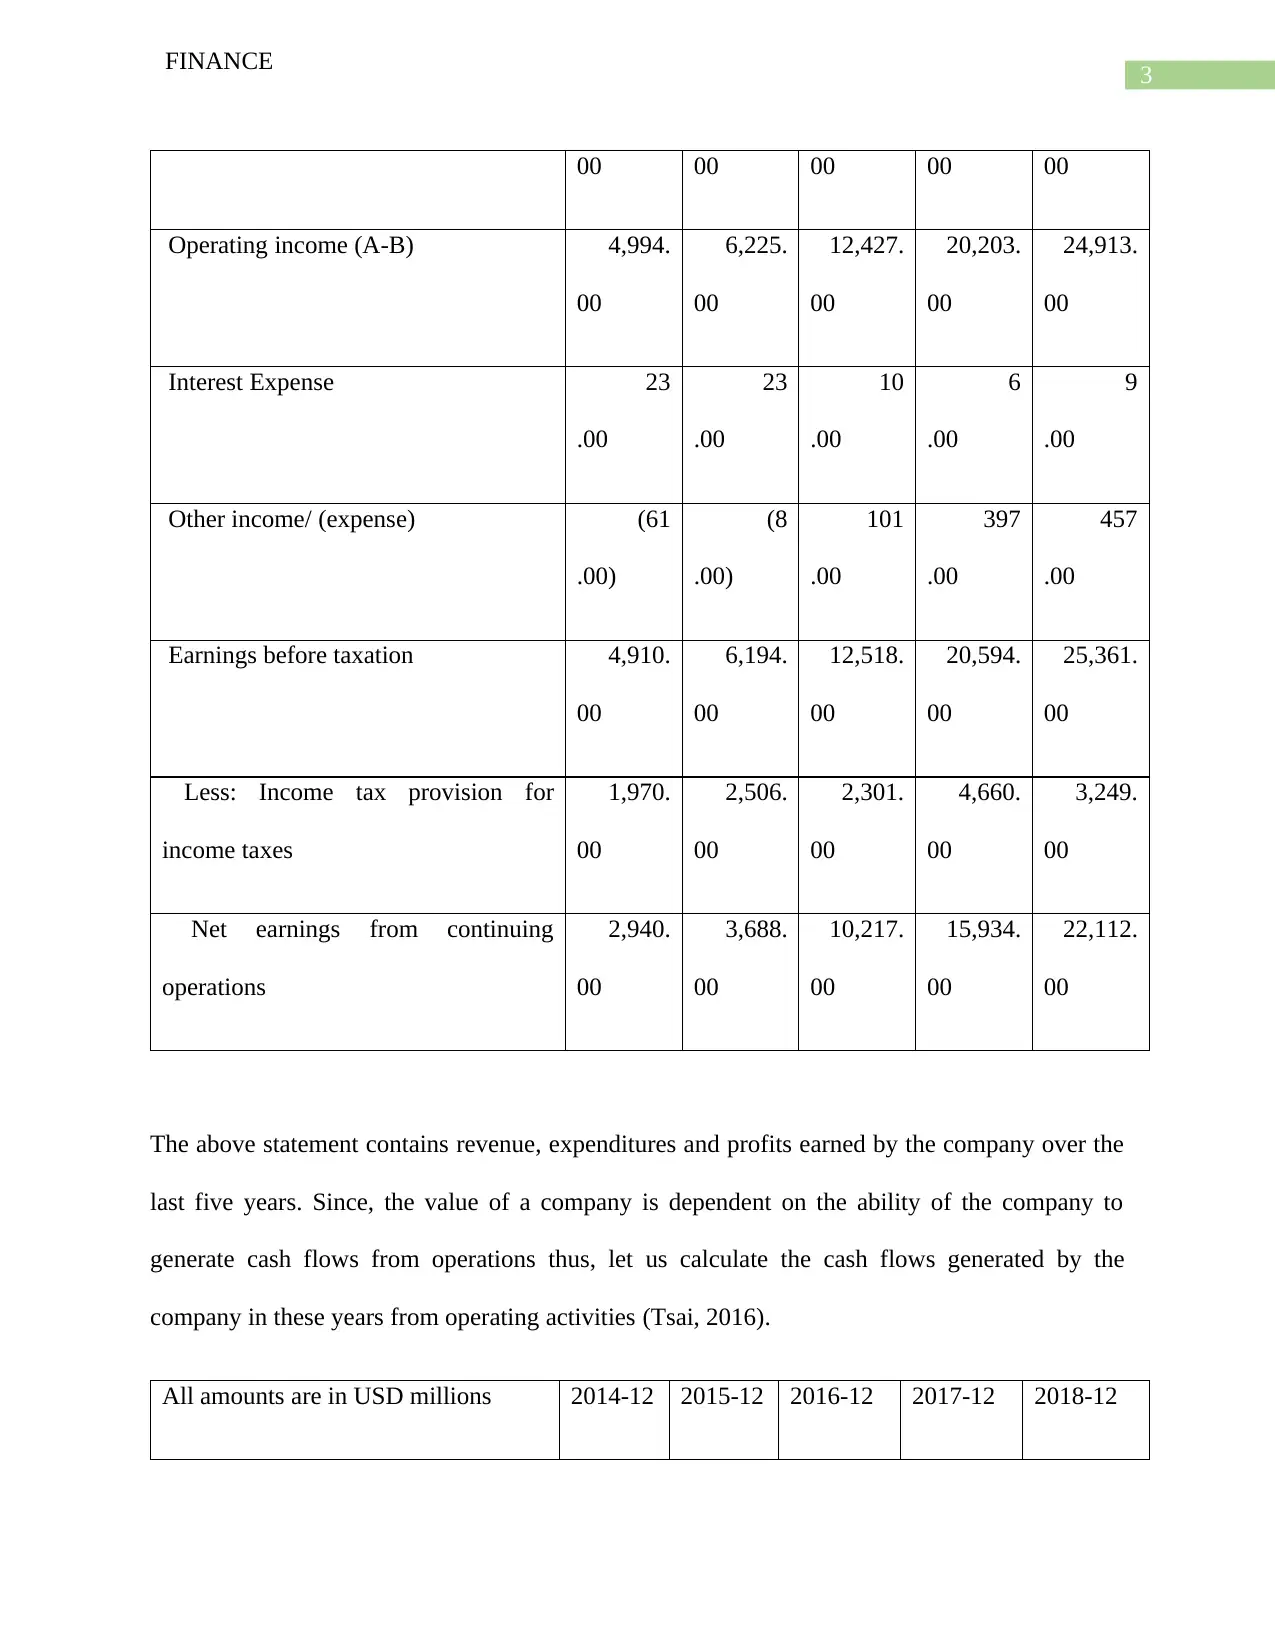
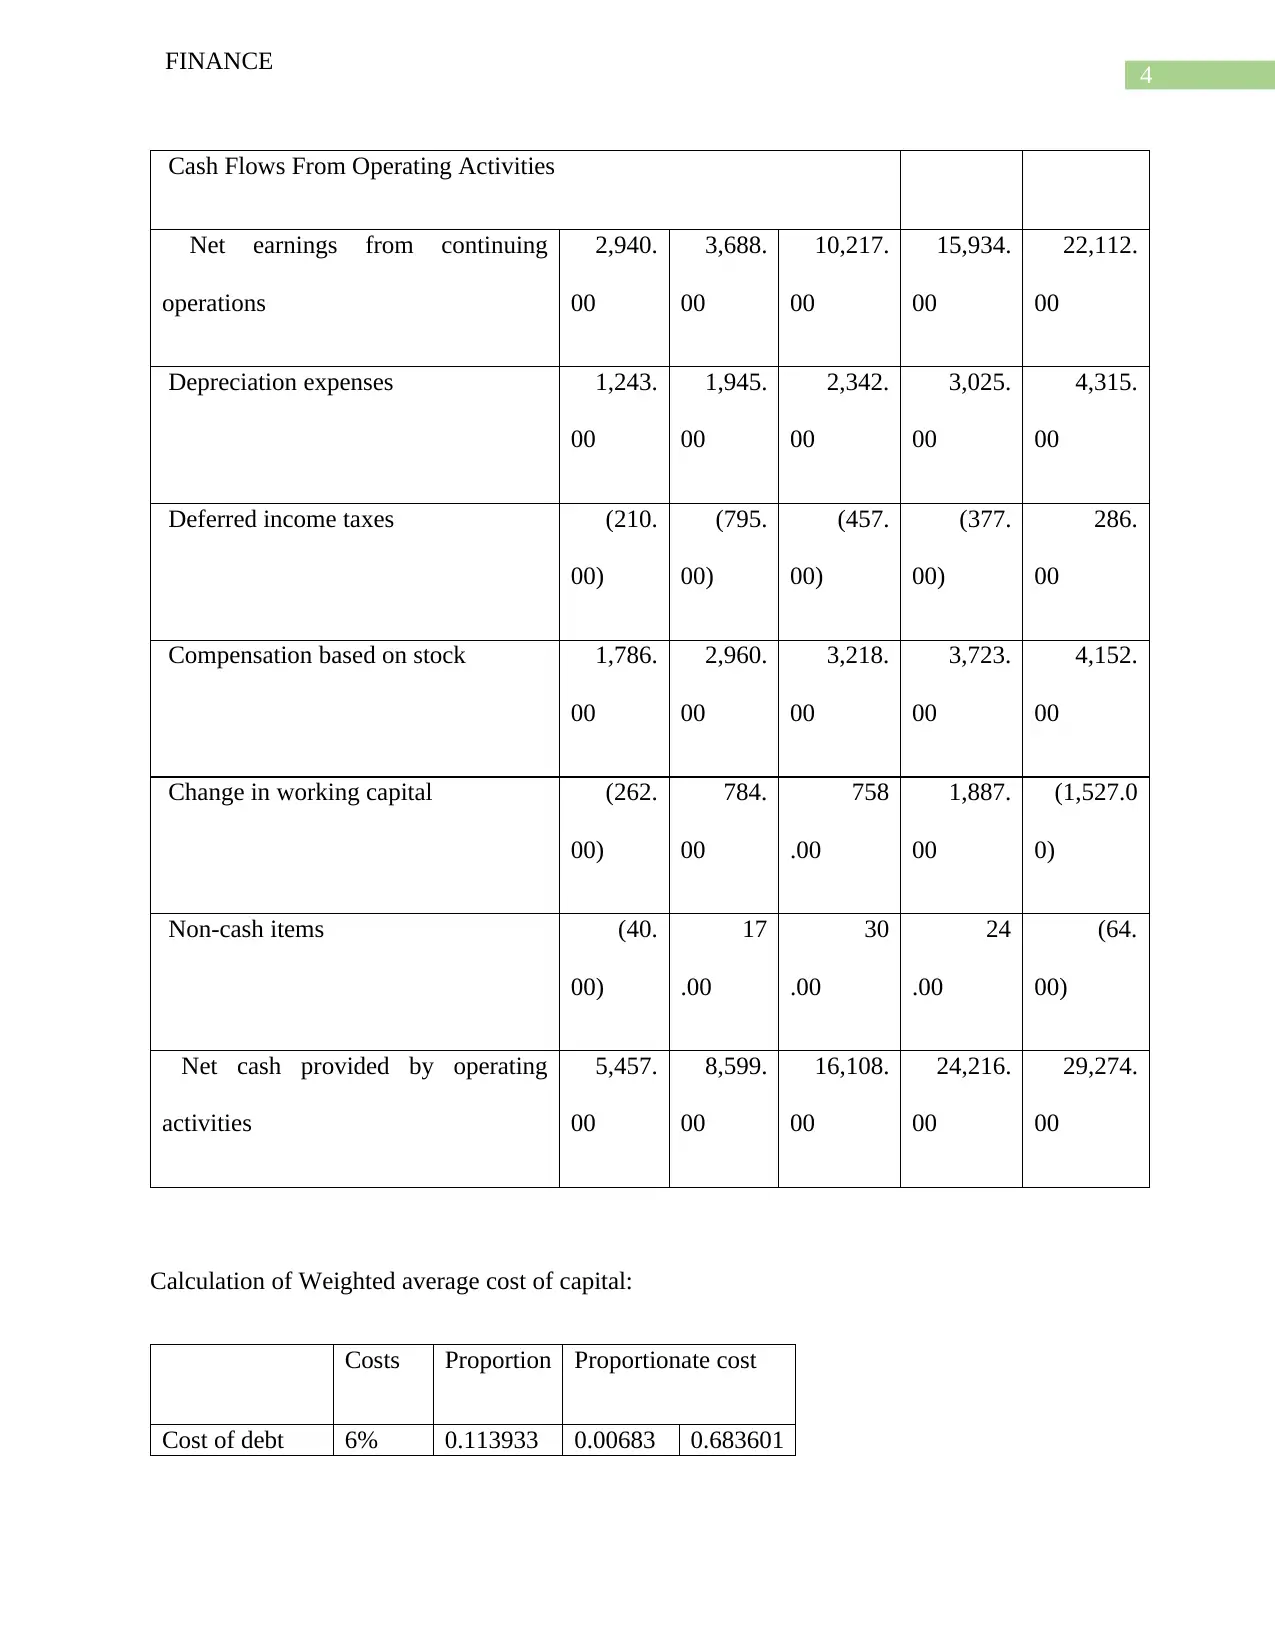
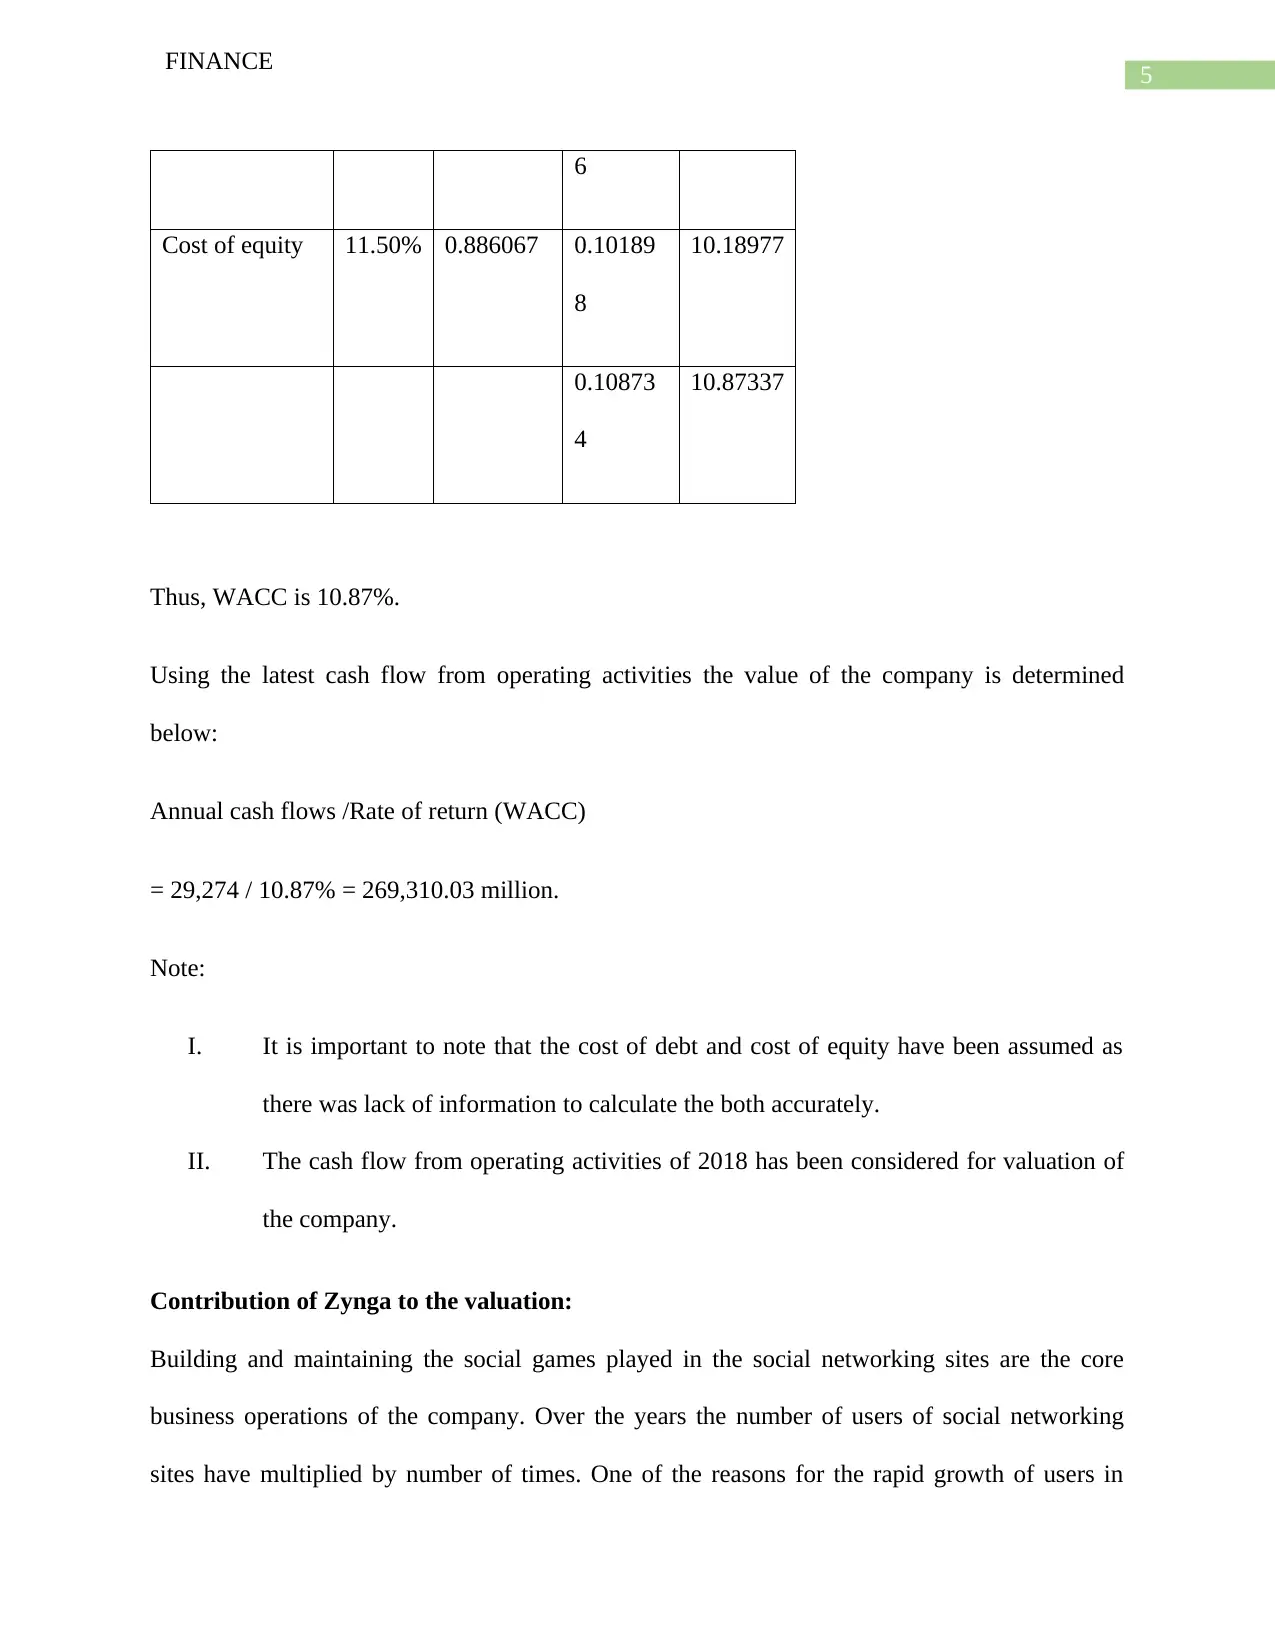
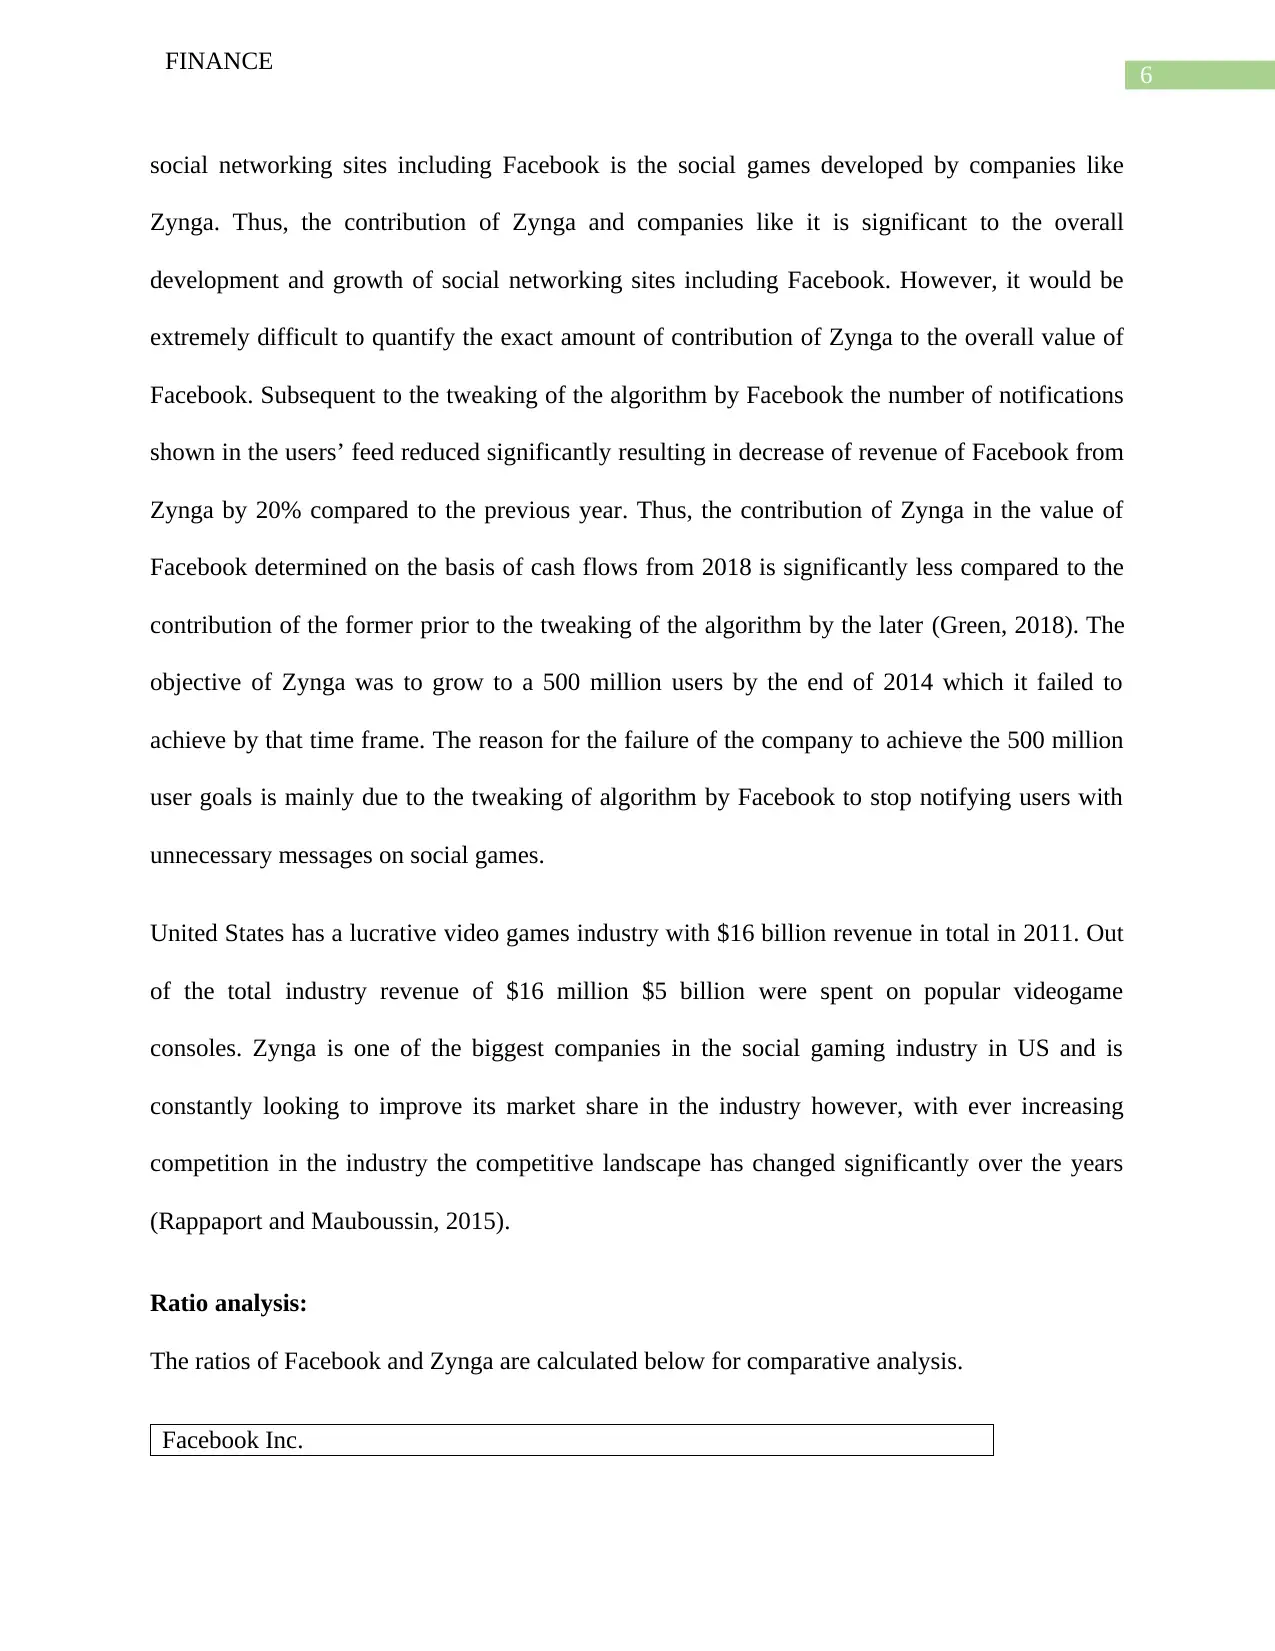
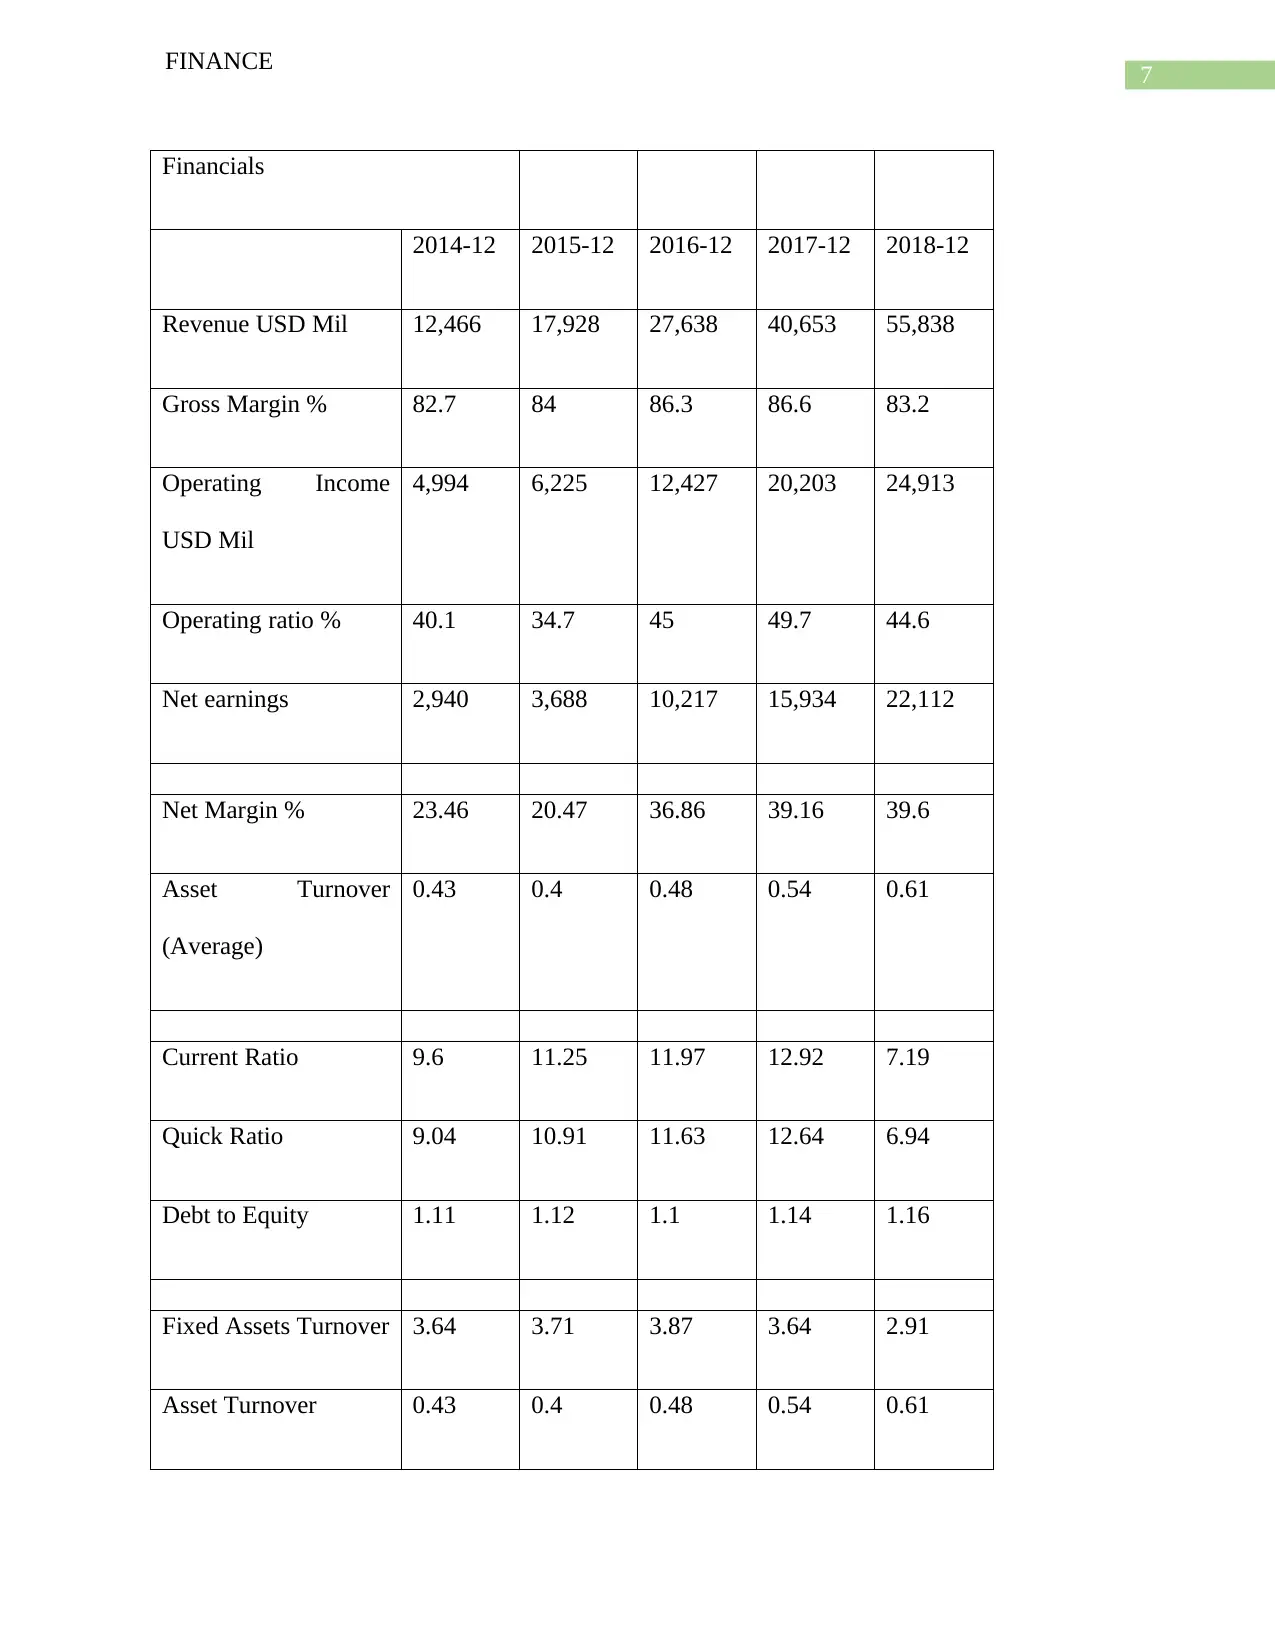
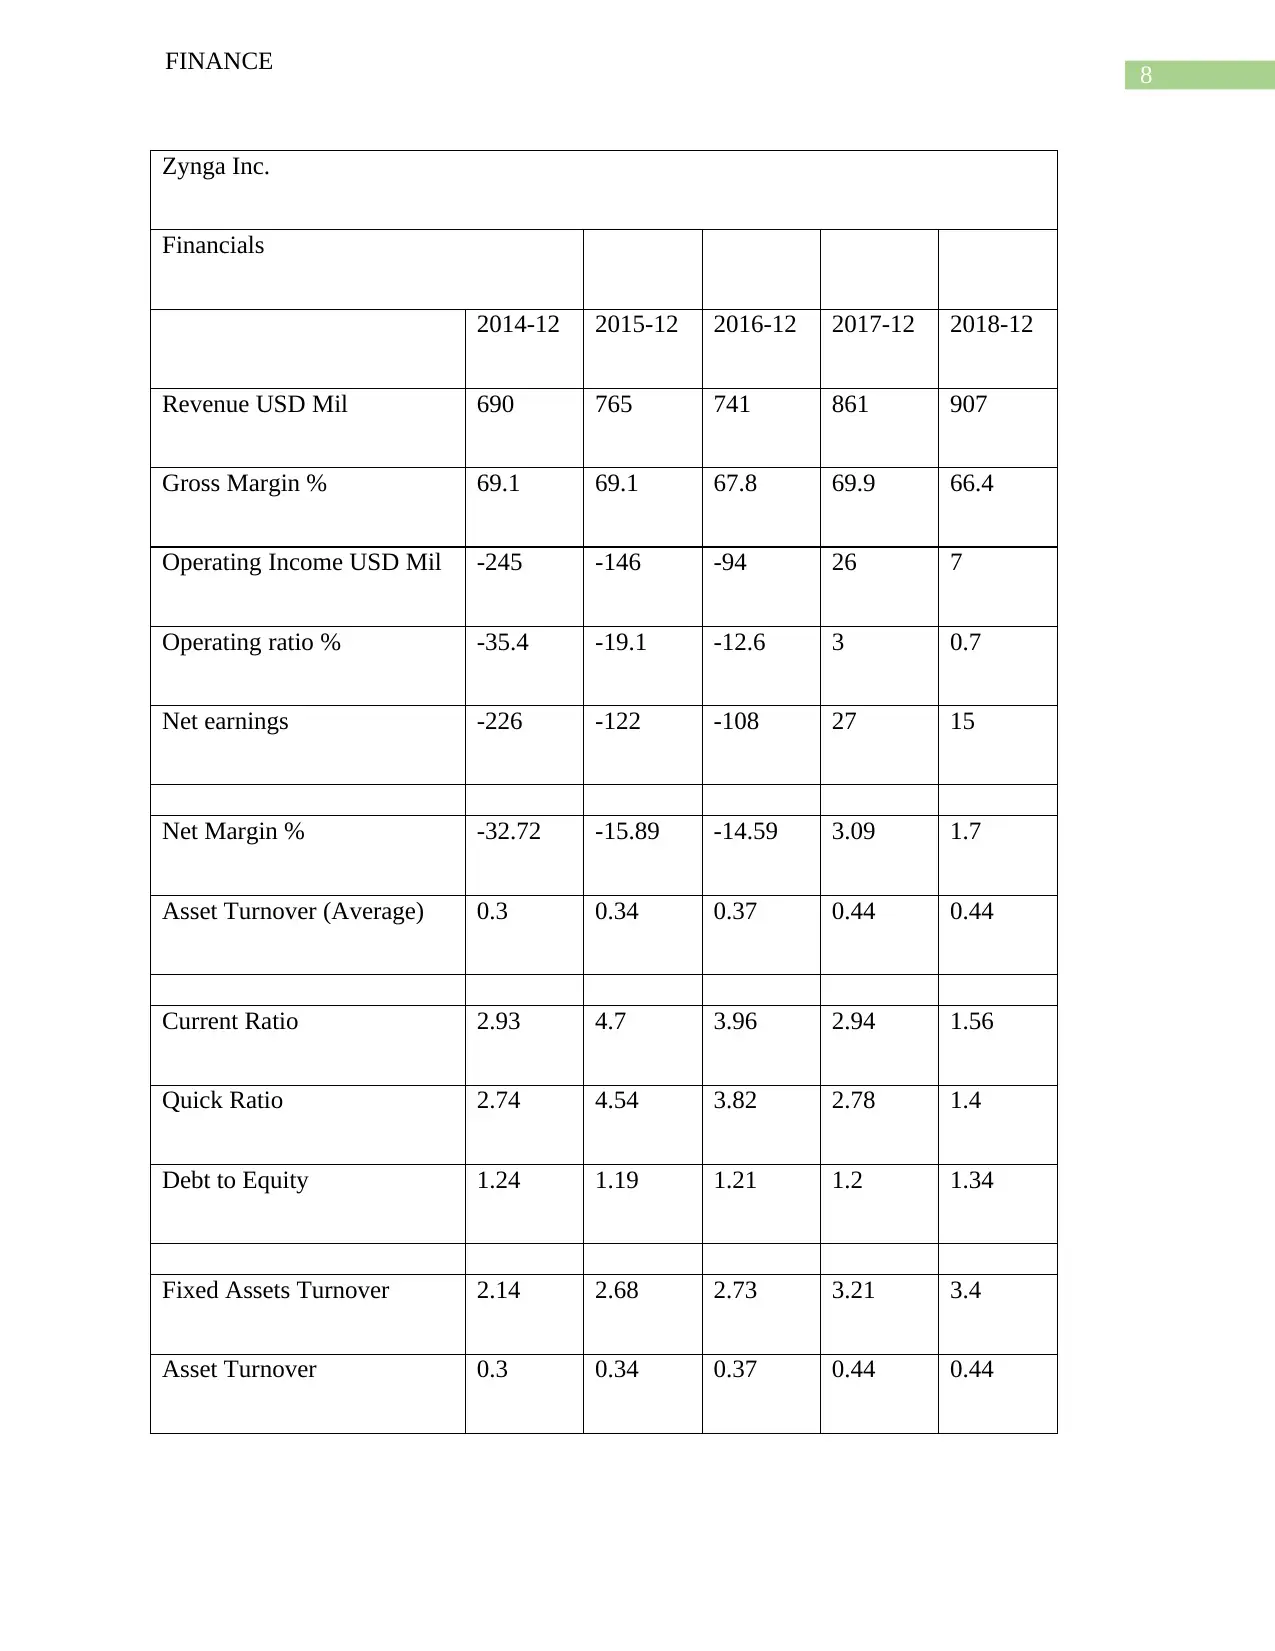
This case study provides a detailed financial analysis of Facebook, focusing on its valuation and the impact of Zynga's contribution to its growth. The analysis includes a review of Facebook's income statement, calculation of cash flows from operating activities, and determination of the company's value using the Weighted Average Cost of Capital (WACC). It also examines Zynga's role in Facebook's development, noting the decline in Zynga's contribution following algorithm changes. The case study further presents a comparative ratio analysis of Facebook and Zynga, highlighting Facebook's superior profitability and efficiency ratios. The document provides a comprehensive overview of Facebook's financial performance and the factors influencing its valuation, offering valuable insights for finance students. Desklib provides a platform to access similar solved assignments and past papers.
Document Page
Running head: FINANCE
Finance
Name of the Student:
Name of the University:
Authors Note:
tabler-icon-diamond-filled.svg

Secure Best Marks with AI Grader

Need help grading? Try our AI Grader for instant feedback on your assignments.
Document Page
1
FINANCE
Contents
Valuation of Facebook:....................................................................................................................2
Contribution of Zynga to the valuation:..........................................................................................5
Ratio analysis:..................................................................................................................................6
References:....................................................................................................................................10
Document Page
2
FINANCE
Valuation of Facebook:
Firstly, it is important to have the income statement of Facebook showing the amount of
revenue and profit earned by the company. Using the net profit from such income statement cash
flows from operating activities shall be calculated to use the same for determination of value of
the company (Financial Statements, 2017).
INCOME STATEMENT OF FACEBOOK INC
All amounts are in USD millions 2014-12 2015-12 2016-12 2017-12 2018-12
Gross revenue earned 12,466.
00
17,928.
00
27,638.
00
40,653.
00
55,838.
00
Less: Cost of revenue 2,153.
00
2,867.
00
3,789.
00
5,454.
00
9,355.
00
(A): Gross profit 10,313.
00
15,061.
00
23,849.
00
35,199.
00
46,483.
00
Less: Expenses
R&D 2,666.
00
4,816.
00
5,919.
00
7,754.
00
10,273.
00
Selling and administrative expenses 2,653.
00
4,020.
00
5,503.
00
7,242.
00
11,297.
00
(B): Total operating expenses 5,319. 8,836. 11,422. 14,996. 21,570.
Document Page
3
FINANCE
00 00 00 00 00
Operating income (A-B) 4,994.
00
6,225.
00
12,427.
00
20,203.
00
24,913.
00
Interest Expense 23
.00
23
.00
10
.00
6
.00
9
.00
Other income/ (expense) (61
.00)
(8
.00)
101
.00
397
.00
457
.00
Earnings before taxation 4,910.
00
6,194.
00
12,518.
00
20,594.
00
25,361.
00
Less: Income tax provision for
income taxes
1,970.
00
2,506.
00
2,301.
00
4,660.
00
3,249.
00
Net earnings from continuing
operations
2,940.
00
3,688.
00
10,217.
00
15,934.
00
22,112.
00
The above statement contains revenue, expenditures and profits earned by the company over the
last five years. Since, the value of a company is dependent on the ability of the company to
generate cash flows from operations thus, let us calculate the cash flows generated by the
company in these years from operating activities (Tsai, 2016).
All amounts are in USD millions 2014-12 2015-12 2016-12 2017-12 2018-12
tabler-icon-diamond-filled.svg

Secure Best Marks with AI Grader

Need help grading? Try our AI Grader for instant feedback on your assignments.
Document Page
4
FINANCE
Cash Flows From Operating Activities
Net earnings from continuing
operations
2,940.
00
3,688.
00
10,217.
00
15,934.
00
22,112.
00
Depreciation expenses 1,243.
00
1,945.
00
2,342.
00
3,025.
00
4,315.
00
Deferred income taxes (210.
00)
(795.
00)
(457.
00)
(377.
00)
286.
00
Compensation based on stock 1,786.
00
2,960.
00
3,218.
00
3,723.
00
4,152.
00
Change in working capital (262.
00)
784.
00
758
.00
1,887.
00
(1,527.0
0)
Non-cash items (40.
00)
17
.00
30
.00
24
.00
(64.
00)
Net cash provided by operating
activities
5,457.
00
8,599.
00
16,108.
00
24,216.
00
29,274.
00
Calculation of Weighted average cost of capital:
Costs Proportion Proportionate cost
Cost of debt 6% 0.113933 0.00683 0.683601
Document Page
5
FINANCE
6
Cost of equity 11.50% 0.886067 0.10189
8
10.18977
0.10873
4
10.87337
Thus, WACC is 10.87%.
Using the latest cash flow from operating activities the value of the company is determined
below:
Annual cash flows /Rate of return (WACC)
= 29,274 / 10.87% = 269,310.03 million.
Note:
I. It is important to note that the cost of debt and cost of equity have been assumed as
there was lack of information to calculate the both accurately.
II. The cash flow from operating activities of 2018 has been considered for valuation of
the company.
Contribution of Zynga to the valuation:
Building and maintaining the social games played in the social networking sites are the core
business operations of the company. Over the years the number of users of social networking
sites have multiplied by number of times. One of the reasons for the rapid growth of users in
Document Page
6
FINANCE
social networking sites including Facebook is the social games developed by companies like
Zynga. Thus, the contribution of Zynga and companies like it is significant to the overall
development and growth of social networking sites including Facebook. However, it would be
extremely difficult to quantify the exact amount of contribution of Zynga to the overall value of
Facebook. Subsequent to the tweaking of the algorithm by Facebook the number of notifications
shown in the users’ feed reduced significantly resulting in decrease of revenue of Facebook from
Zynga by 20% compared to the previous year. Thus, the contribution of Zynga in the value of
Facebook determined on the basis of cash flows from 2018 is significantly less compared to the
contribution of the former prior to the tweaking of the algorithm by the later (Green, 2018). The
objective of Zynga was to grow to a 500 million users by the end of 2014 which it failed to
achieve by that time frame. The reason for the failure of the company to achieve the 500 million
user goals is mainly due to the tweaking of algorithm by Facebook to stop notifying users with
unnecessary messages on social games.
United States has a lucrative video games industry with $16 billion revenue in total in 2011. Out
of the total industry revenue of $16 million $5 billion were spent on popular videogame
consoles. Zynga is one of the biggest companies in the social gaming industry in US and is
constantly looking to improve its market share in the industry however, with ever increasing
competition in the industry the competitive landscape has changed significantly over the years
(Rappaport and Mauboussin, 2015).
Ratio analysis:
The ratios of Facebook and Zynga are calculated below for comparative analysis.
Facebook Inc.
tabler-icon-diamond-filled.svg

Paraphrase This Document

Need a fresh take? Get an instant paraphrase of this document with our AI Paraphraser
Document Page
7
FINANCE
Financials
2014-12 2015-12 2016-12 2017-12 2018-12
Revenue USD Mil 12,466 17,928 27,638 40,653 55,838
Gross Margin % 82.7 84 86.3 86.6 83.2
Operating Income
USD Mil
4,994 6,225 12,427 20,203 24,913
Operating ratio % 40.1 34.7 45 49.7 44.6
Net earnings 2,940 3,688 10,217 15,934 22,112
Net Margin % 23.46 20.47 36.86 39.16 39.6
Asset Turnover
(Average)
0.43 0.4 0.48 0.54 0.61
Current Ratio 9.6 11.25 11.97 12.92 7.19
Quick Ratio 9.04 10.91 11.63 12.64 6.94
Debt to Equity 1.11 1.12 1.1 1.14 1.16
Fixed Assets Turnover 3.64 3.71 3.87 3.64 2.91
Asset Turnover 0.43 0.4 0.48 0.54 0.61
Document Page
8
FINANCE
Zynga Inc.
Financials
2014-12 2015-12 2016-12 2017-12 2018-12
Revenue USD Mil 690 765 741 861 907
Gross Margin % 69.1 69.1 67.8 69.9 66.4
Operating Income USD Mil -245 -146 -94 26 7
Operating ratio % -35.4 -19.1 -12.6 3 0.7
Net earnings -226 -122 -108 27 15
Net Margin % -32.72 -15.89 -14.59 3.09 1.7
Asset Turnover (Average) 0.3 0.34 0.37 0.44 0.44
Current Ratio 2.93 4.7 3.96 2.94 1.56
Quick Ratio 2.74 4.54 3.82 2.78 1.4
Debt to Equity 1.24 1.19 1.21 1.2 1.34
Fixed Assets Turnover 2.14 2.68 2.73 3.21 3.4
Asset Turnover 0.3 0.34 0.37 0.44 0.44
Document Page
9
FINANCE
The gross profit margin of Facebook in all the last five years are significantly higher than the
gross margin of Zynga and the industry average. Similarly the operating ratio of Facebook is also
quite high compared to Zynga in each of the last five years. The net margin of Zynga has been in
negative whereas Facebook has enjoyed a positive net margin in each of the last five years. Thus,
the profitability ratios suggest that Facebook is significantly ahead than its competitors in the
industry. In 2018 the current ratio and quick ratio of the company were 7.19: 1 and 6.94: 1 show
how strong liquidity position the company enjoys. In terms of efficiency also the fixed asset and
asset turnover ratios of the Facebook are also significant better than Zynga and other peers in the
industry (Mittal and Sandhu, 2018).
tabler-icon-diamond-filled.svg

Secure Best Marks with AI Grader

Need help grading? Try our AI Grader for instant feedback on your assignments.
Document Page
10
FINANCE
References:
Financial Statements. (2017). Review of Income and Wealth, 64(7), pp.774-785.
Green, J. (2018). Financial Statement Analysis and Equity Valuation. SSRN Electronic Journal,
2(4), pp.15-214.
Mittal, A. and Sandhu, N. (2018). To Investigate the Relationship between CSR of Companies
and Their Market Valuation (Equity Valuation): Northern India. Journal of Advances and
Scholarly Researches in Allied Education, 15(3), pp.120-127.
Rappaport, A. and Mauboussin, M. (2015). Expectations investing. 7th ed. Boston, Mass.:
Harvard Business School Press, pp.13-287.
Tsai, T. (2016). Equity Valuation of Shipping Companies. SSRN Electronic Journal, 4(5), pp.17-
23.
chevron_up_icon
1 out of 11
circle_padding
hide_on_mobile
zoom_out_icon
[object Object]