Identifying Factors Affecting House Prices in the Real Estate Business
VerifiedAdded on 2021/06/14
|19
|5527
|21
Report
AI Summary
This report investigates the factors influencing house prices within the real estate business, specifically focusing on the Sydney market. The study aims to determine the relationship between selling price and house area, the correlation between house age and price, and the mean difference in selling prices between city and remote area houses. The methodology involves a descriptive survey design, utilizing questionnaires administered to a sample of 20 participants, including real estate professionals and residents. The research employs statistical techniques such as Pearson correlation, paired sample t-tests, and multiple linear regression to analyze the collected data, aiming to generate a model for predicting house prices. The report also includes demographic information on the respondents, such as their gender and education levels. The reliability analysis, however, showed lower internal consistency of the questionnaire, therefore not reliable. The results are presented in tables and graphs to facilitate understanding and interpretation of the findings.

Factors affecting the price of a house in real estate business
Introduction
Marketing is the major point of focus for the success of any business in the current world. Some
business ventures are more lucrative than the others, but with no proper marketing of the
business irrespective of their lucrativeness, it would be on the verge of posting dismal
performance in the long run Malhotra (2015). Due to appreciation in the prices of some
commodities like pieces of land have made investors to diverge from other businesses to the real
estate business (Babin & Zikmund, 2015). It is seen as the long term permanent investment and
in the preference of investors. In the real estate business, its involved commodities have been
experiencing value increase with time. Transactions in this business venture involves buying and
selling of the piece of land, building houses of different types and sizes and either renting them
to the tenants, leasing them or permanently selling the houses to the customers in need
(Schneider & Kearney, 2013). Continuous increase in the value of pieces of land make the value
of the real estate be on the hike and this is preferred by the business people all around the world.
Various factors are supposed to be considered before venturing into any kind of business (Zahra,
Wright & Abdelgawad, 2014). Specifically, for the real estate business, the business operators
are supposed to ensure that they have high negotiation skills. Required negotiation skills are not
limited to this type of business alone but to other business opportunities too Conrad & Newberry,
(2012). These skills are important in running of this business to improve the bargaining power
beyond that of the buyers since if the buyer overpowers the seller in the price negotiation
process, the property is most likely to be sold at the lowest price possible in the favor of the
buyer (Siewiorek, Saarinen, Lainema, & Lehtinen, 2012); Schneider (2012). Another major
factor that would be important in the real estate business is the prior knowledge of the existing
Paraphrase This Document
Need a fresh take? Get an instant paraphrase of this document with our AI Paraphraser

price in the market. This would help to set the quoting price of either the piece of land and house
that you plan to rent out, lease, sell or even buy. Houses being one of the basic necessities in life
of human beings, their prices have been appreciating year in year out depending on some of the
factors such as the security of the place where the house is constructed, the area coverage of the
house, the age of the house and many other factors that can be brought on the negotiation table
Du & Zhang (2015); Hammond, Keeney, & Raiffa, (2015). This report is therefore aimed at
identifying some of the factors that could be playing part in the price determination of the houses
in Sydney city. Houses constructed in the remote areas and at distant places from the city centers
tend to have relatively lower prices compared to those at the nearby or at the heart of the cities.
Research objectives
The key goal for conducting this research was to determine the factors contributing to the price
changes of a house in real estate business. In order to the meet that general objective, specific
objectives were as stated below;
1. To determine the relationship between selling price of a house and the area coverage of a
house.
2. To determine the correlation between age of a house and the price for the house
3. To assess if there is a mean difference between selling price for houses in the city and
those in remote areas
4. To generate the multiple linear regression model that would be used in determining the
selling price of houses in Sydney city.
Research questions
1. Is there any relationship between selling price and the area coverage of a house?
2. Is there any correlation between the age of a house and the selling price of a house?
3. Is there significant mean difference between selling price for houses in the city and those
in the remote areas?
4. What is the multiple linear regression generated to predict the selling price of houses in
the city?
Methodology
In this section of the project, we shall cover subsections such as the research design, data
collection procedures, targeted and sampled population, reliability and validity of project
instruments and finally, the data analysis that will specify the used statistical techniques in the
manipulation of the collected data.
Research design
This is the procedure followed in correlating the research questions, data collection, data analysis
and interpretations (Myers, Well, & Lorch, 2013); Ritchie, Lewis, Nicholls, & Ormston, (Eds.).
(2013). In this project, researcher adopted the case study of the rising prices of the houses in the
cities siting an example of Sydney city. Taking this into consideration, the researcher was
capable of using the phenomenon and collect data for examination. The collected data were both
qualitative and quantitative. Qualitative data are the information obtained which are non-numeric
Lewis (2015); Taylor, Bogdan & DeVault, (2015). Such information are particularly obtained
through the interviews and can be in the form of audio recordings, texts etc. for instance, in this
project, data that were collected resulting to the variables of sex of the participants and their
⊘ This is a preview!⊘
Do you want full access?
Subscribe today to unlock all pages.
Trusted by 1+ million students worldwide
levels of education were the categorical variables that held the qualitative data. On the other
hand, quantitative data are the numerical data obtained from the participants in the data
collection process and the resulted variables contain numerical cases (Bryman, & Cramer, 2012;
Criddle, & Stanley, 2012; Cox, & Mann, 2012). In this project, a number of questions resulted to
the numerical variables that were used in the data analysis i.e. area coverage of the house, age of
the house, the number of bedrooms a house has etc. descriptive survey design was employed in
this research aimed at evaluating the factors leading to house price changes in the real estate
business.
Sample population
Real estate business people, house owners in Sydney, house owners in different parts in Australia
and the residents in Sydney formed the targeted population. A population is a set of elements
under study (Anderson, Sweeney, Williams, Camm, & Cochran, 2016). A sample is a subset or a
fraction of the population under study and the sample size is the finite number of elements a
researcher had decided to engage in the study Button et al (2013); Charan, & Biswas, (2013). In
this case, the researcher engaged 20 people to respond to the questions structured in the
questionnaires. The sample used was believed to provide the values that represented the true
picture of what was happening in the real estate business in Sydney Australia.
Data collection procedures
This is the process of gathering data from the participants with respect to the subject of study
Englander (2012). In the data collection process, data collection methods that were used by the
researcher were interviews and questionnaires. The questionnaires were taken to a number of
people where some of them were house owners in Sydney, others were house owners in other
Paraphrase This Document
Need a fresh take? Get an instant paraphrase of this document with our AI Paraphraser
parts and others were Sydney residents. Questionnaires were preferred since they are known to
providing privacy to the participants thus making them express themselves in free manner
McCusker & Gunaydin (2015). Further they provide time to the respondents to have deeper
understanding of the subject questions unlike when interviews are used (Ainsworth, Cahalin,
Buman, & Ross, 2015).
Reliability and validity of instruments
Various research instruments can be employed by the researcher in the research process to help
in the collection of data. The instruments used in any given research project are tested for their
reliability and validity since they are what result to valid data Csikszentmihalyi & Larson (2014);
Richardson, Iezzi, Khan & Maxwell (2014). Choice of the instrument to be employed in research
process always depend on the objectives and the targeted sample population Flynn et al (2015).
In this case therefore, questionnaires were used in the entire process of data collection.
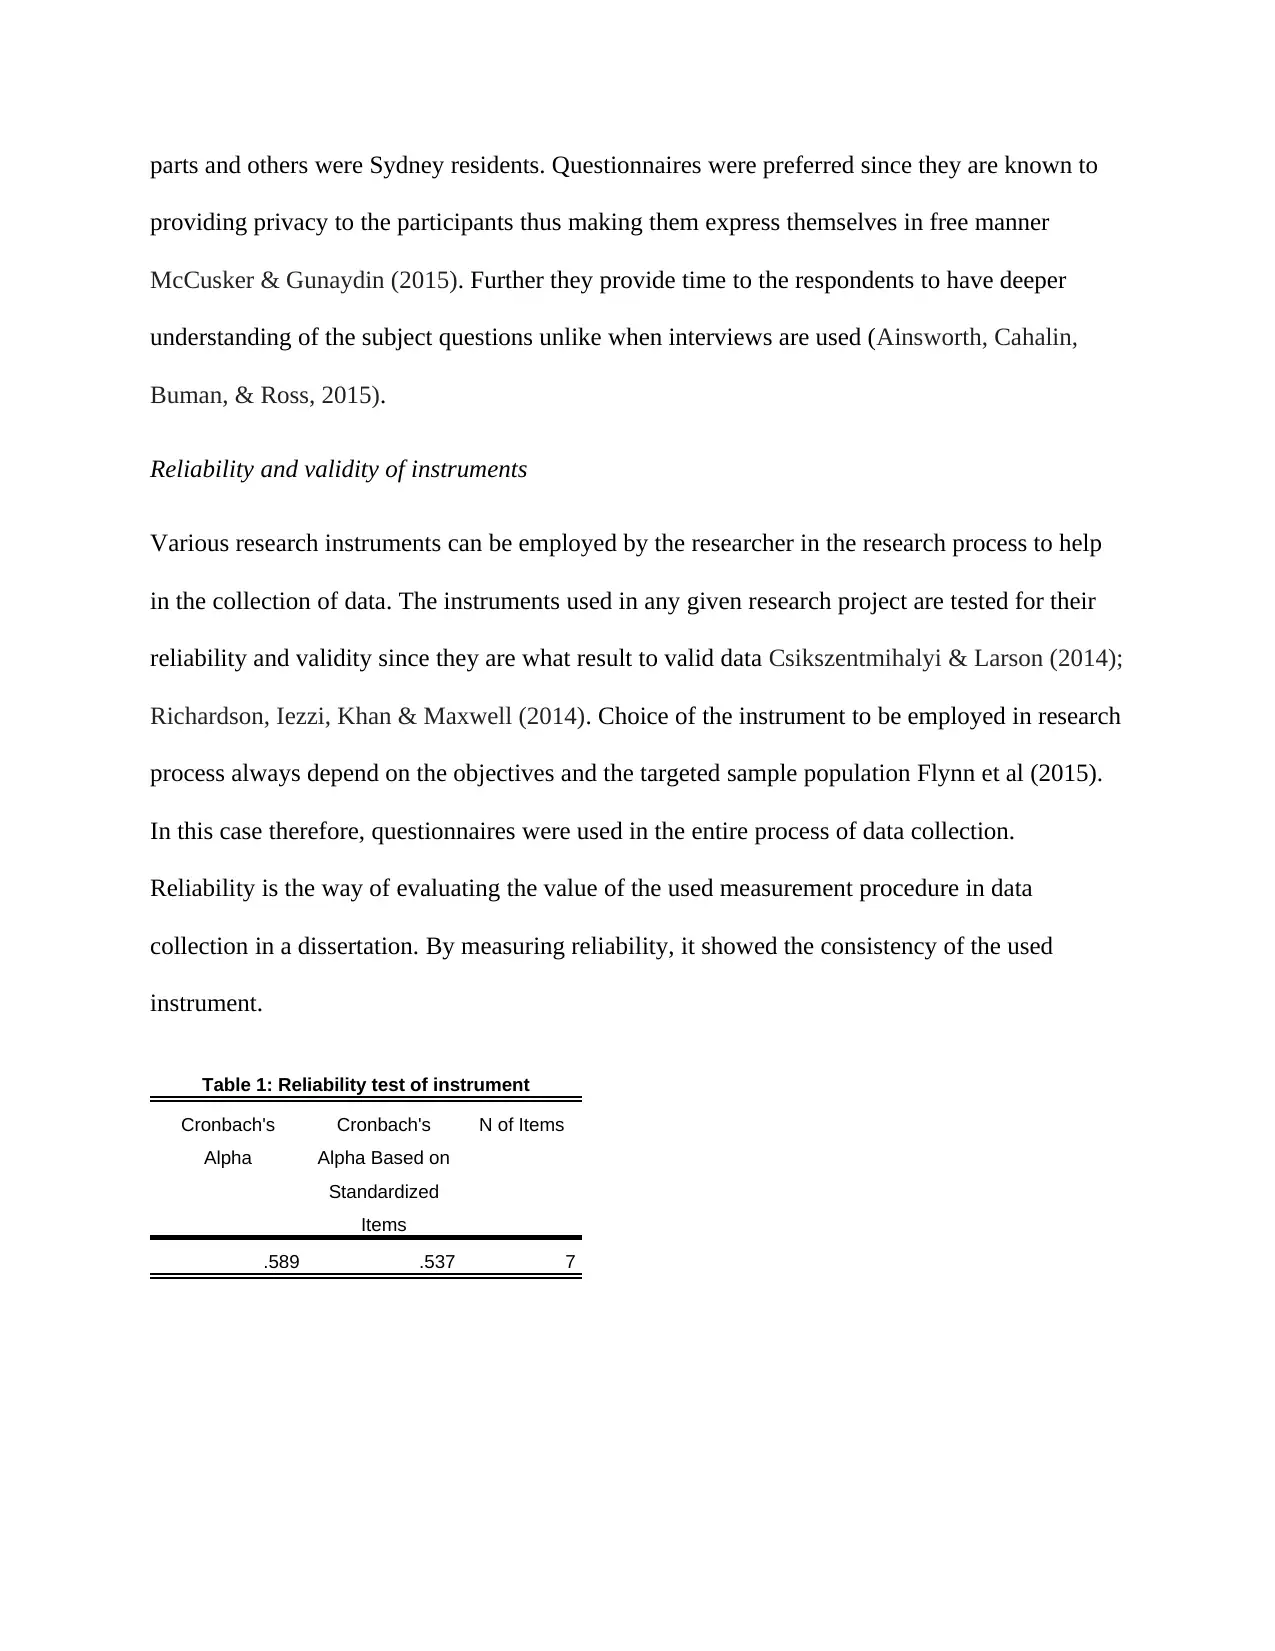
Reliability is the way of evaluating the value of the used measurement procedure in data
collection in a dissertation. By measuring reliability, it showed the consistency of the used
instrument.
Table 1: Reliability test of instrument
Cronbach's
Alpha
Cronbach's
Alpha Based on
Standardized
Items
N of Items
.589 .537 7
providing privacy to the participants thus making them express themselves in free manner
McCusker & Gunaydin (2015). Further they provide time to the respondents to have deeper
understanding of the subject questions unlike when interviews are used (Ainsworth, Cahalin,
Buman, & Ross, 2015).
Reliability and validity of instruments
Various research instruments can be employed by the researcher in the research process to help
in the collection of data. The instruments used in any given research project are tested for their
reliability and validity since they are what result to valid data Csikszentmihalyi & Larson (2014);
Richardson, Iezzi, Khan & Maxwell (2014). Choice of the instrument to be employed in research
process always depend on the objectives and the targeted sample population Flynn et al (2015).
In this case therefore, questionnaires were used in the entire process of data collection.
Reliability is the way of evaluating the value of the used measurement procedure in data
collection in a dissertation. By measuring reliability, it showed the consistency of the used
instrument.
Table 1: Reliability test of instrument
Cronbach's
Alpha
Cronbach's
Alpha Based on
Standardized
Items
N of Items
.589 .537 7
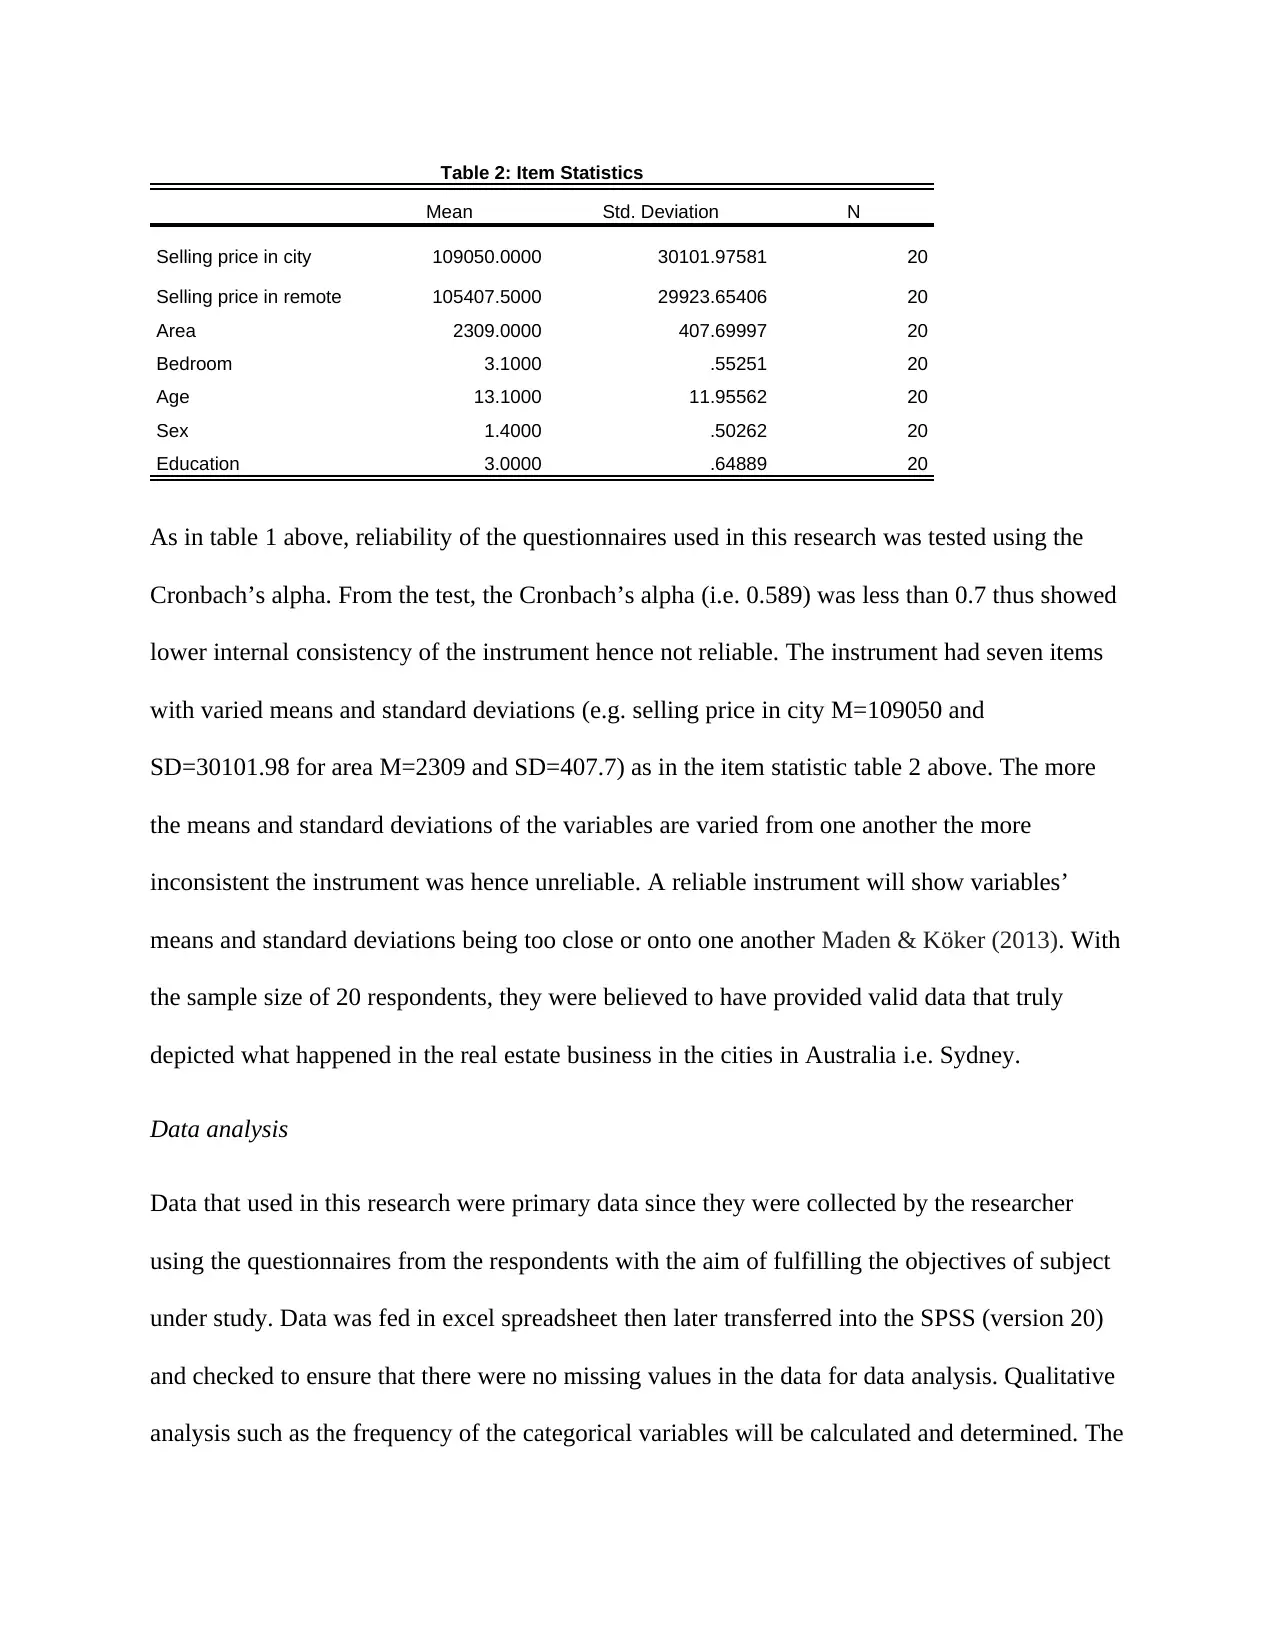
Table 2: Item Statistics
Mean Std. Deviation N
Selling price in city 109050.0000 30101.97581 20
Selling price in remote 105407.5000 29923.65406 20
Area 2309.0000 407.69997 20
Bedroom 3.1000 .55251 20
Age 13.1000 11.95562 20
Sex 1.4000 .50262 20
Education 3.0000 .64889 20
As in table 1 above, reliability of the questionnaires used in this research was tested using the
Cronbach’s alpha. From the test, the Cronbach’s alpha (i.e. 0.589) was less than 0.7 thus showed
lower internal consistency of the instrument hence not reliable. The instrument had seven items
with varied means and standard deviations (e.g. selling price in city M=109050 and
SD=30101.98 for area M=2309 and SD=407.7) as in the item statistic table 2 above. The more
the means and standard deviations of the variables are varied from one another the more
inconsistent the instrument was hence unreliable. A reliable instrument will show variables’
means and standard deviations being too close or onto one another Maden & Köker (2013). With
the sample size of 20 respondents, they were believed to have provided valid data that truly
depicted what happened in the real estate business in the cities in Australia i.e. Sydney.
Data analysis
Data that used in this research were primary data since they were collected by the researcher
using the questionnaires from the respondents with the aim of fulfilling the objectives of subject
under study. Data was fed in excel spreadsheet then later transferred into the SPSS (version 20)
and checked to ensure that there were no missing values in the data for data analysis. Qualitative
analysis such as the frequency of the categorical variables will be calculated and determined. The
⊘ This is a preview!⊘
Do you want full access?
Subscribe today to unlock all pages.
Trusted by 1+ million students worldwide
statistical software will be used to run the descriptive statistics i.e. (mean, standard deviation,
minimum and maximum) of the numerical variables from the data set. Pearson correlation will
be employed by the researcher to test for the existence of correlation between variables in the
data set. Paired sample t-test will as well be used in the research to test for the mean difference
between the selling prices of the houses in the city and in remote areas. With selling prices as the
dependent variables, age, area and bedroom will be used as independent variables in the linear
regression model to give the prediction of the selling price of the houses in the city. Linear
regression equation used was;
y=b0 +b1 area+b2 bedroom+ b3 age+ εi
Where b0 is a constant in the equation and b1 , b2 and b3 are the coefficients of area, bedroom and
age respectively. Y is the dependent variable which in this case represents selling price of the
houses in the city. Εi is the corrective error value. For better representation of data, the collected
data will be represented in the tables and graphs for easy understanding and interpretation.
Results
Demographic information
Demographic information are one of the most important information as they tell the researcher
the characteristics of the people they would wish to engage in the research process. The
demographic information collected about the participants in this research were sex of the
participants and their level of education. These information are in most cases important for
business and business people when they are outlining the business plan and also carrying out
business research.
Paraphrase This Document
Need a fresh take? Get an instant paraphrase of this document with our AI Paraphraser
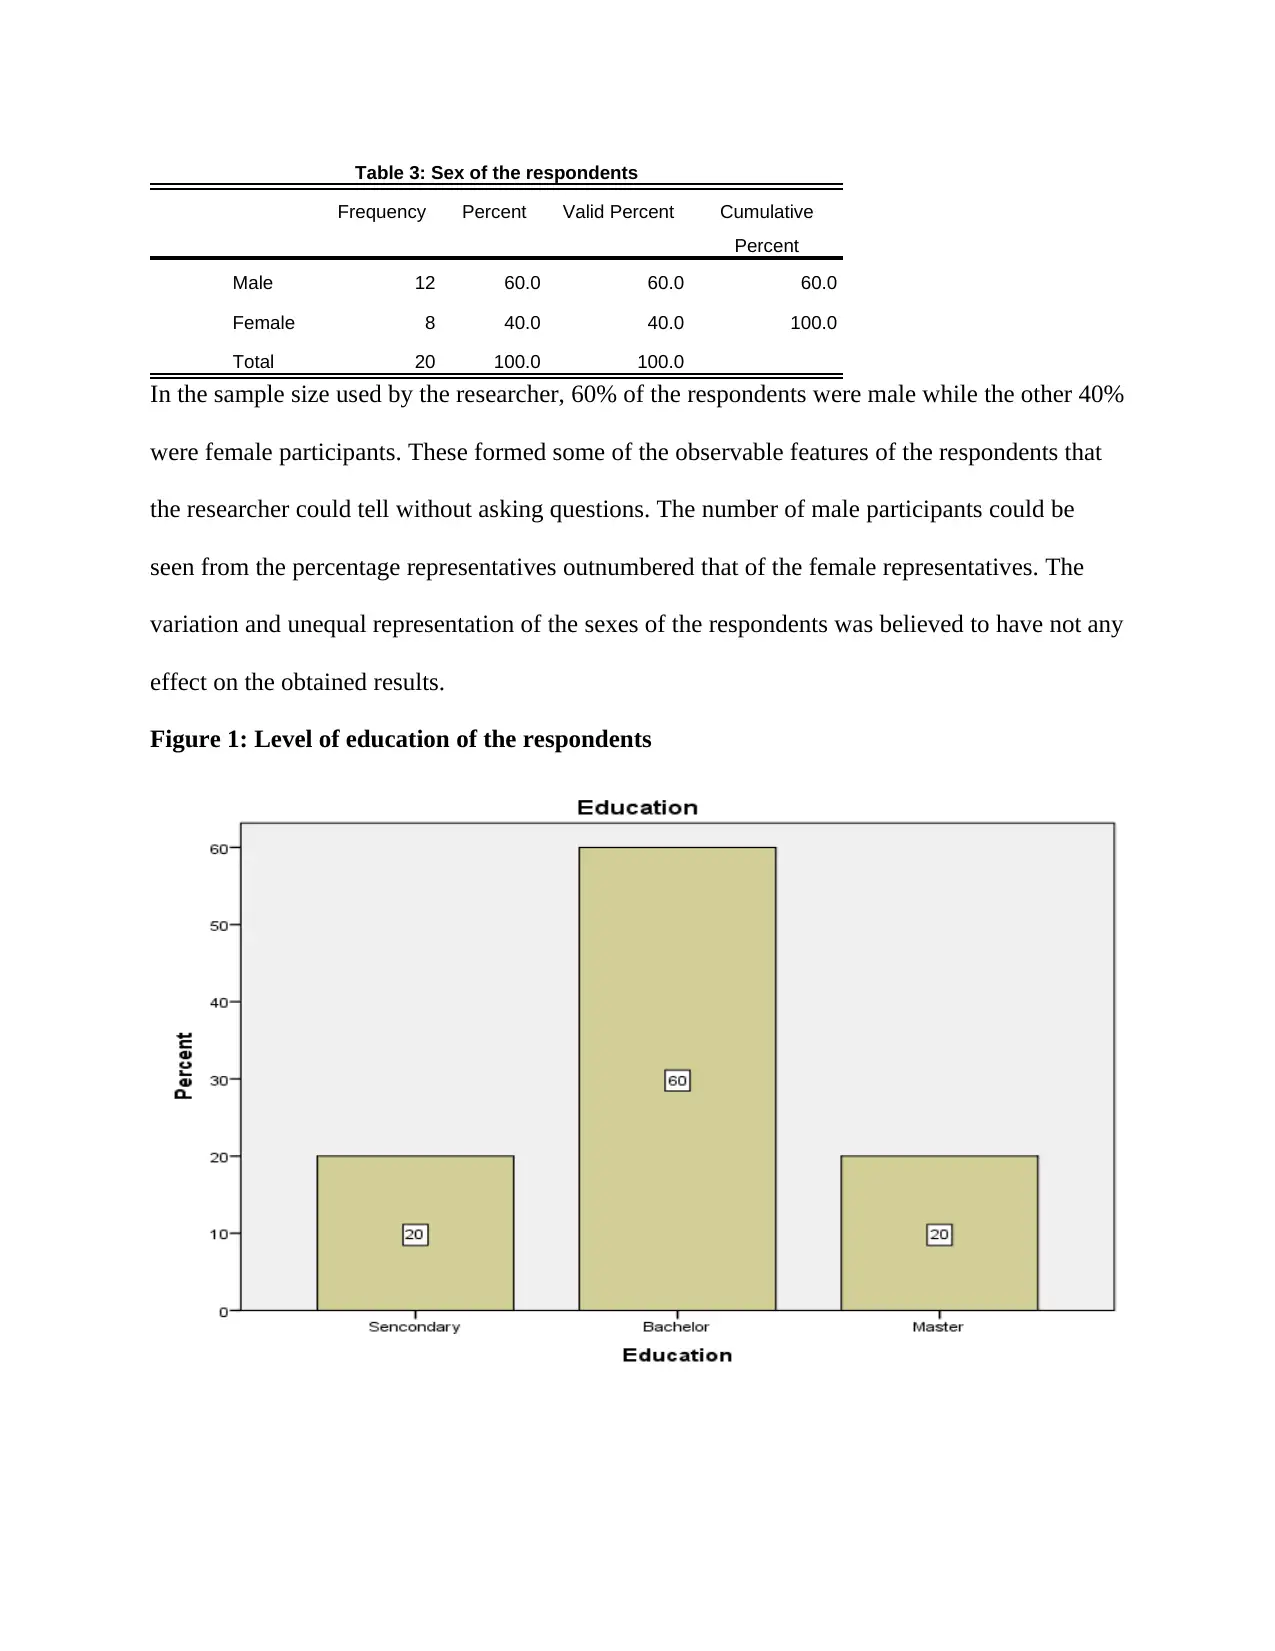
Table 3: Sex of the respondents
Frequency Percent Valid Percent Cumulative
Percent
Male 12 60.0 60.0 60.0
Female 8 40.0 40.0 100.0
Total 20 100.0 100.0
In the sample size used by the researcher, 60% of the respondents were male while the other 40%
were female participants. These formed some of the observable features of the respondents that
the researcher could tell without asking questions. The number of male participants could be
seen from the percentage representatives outnumbered that of the female representatives. The
variation and unequal representation of the sexes of the respondents was believed to have not any
effect on the obtained results.
Figure 1: Level of education of the respondents
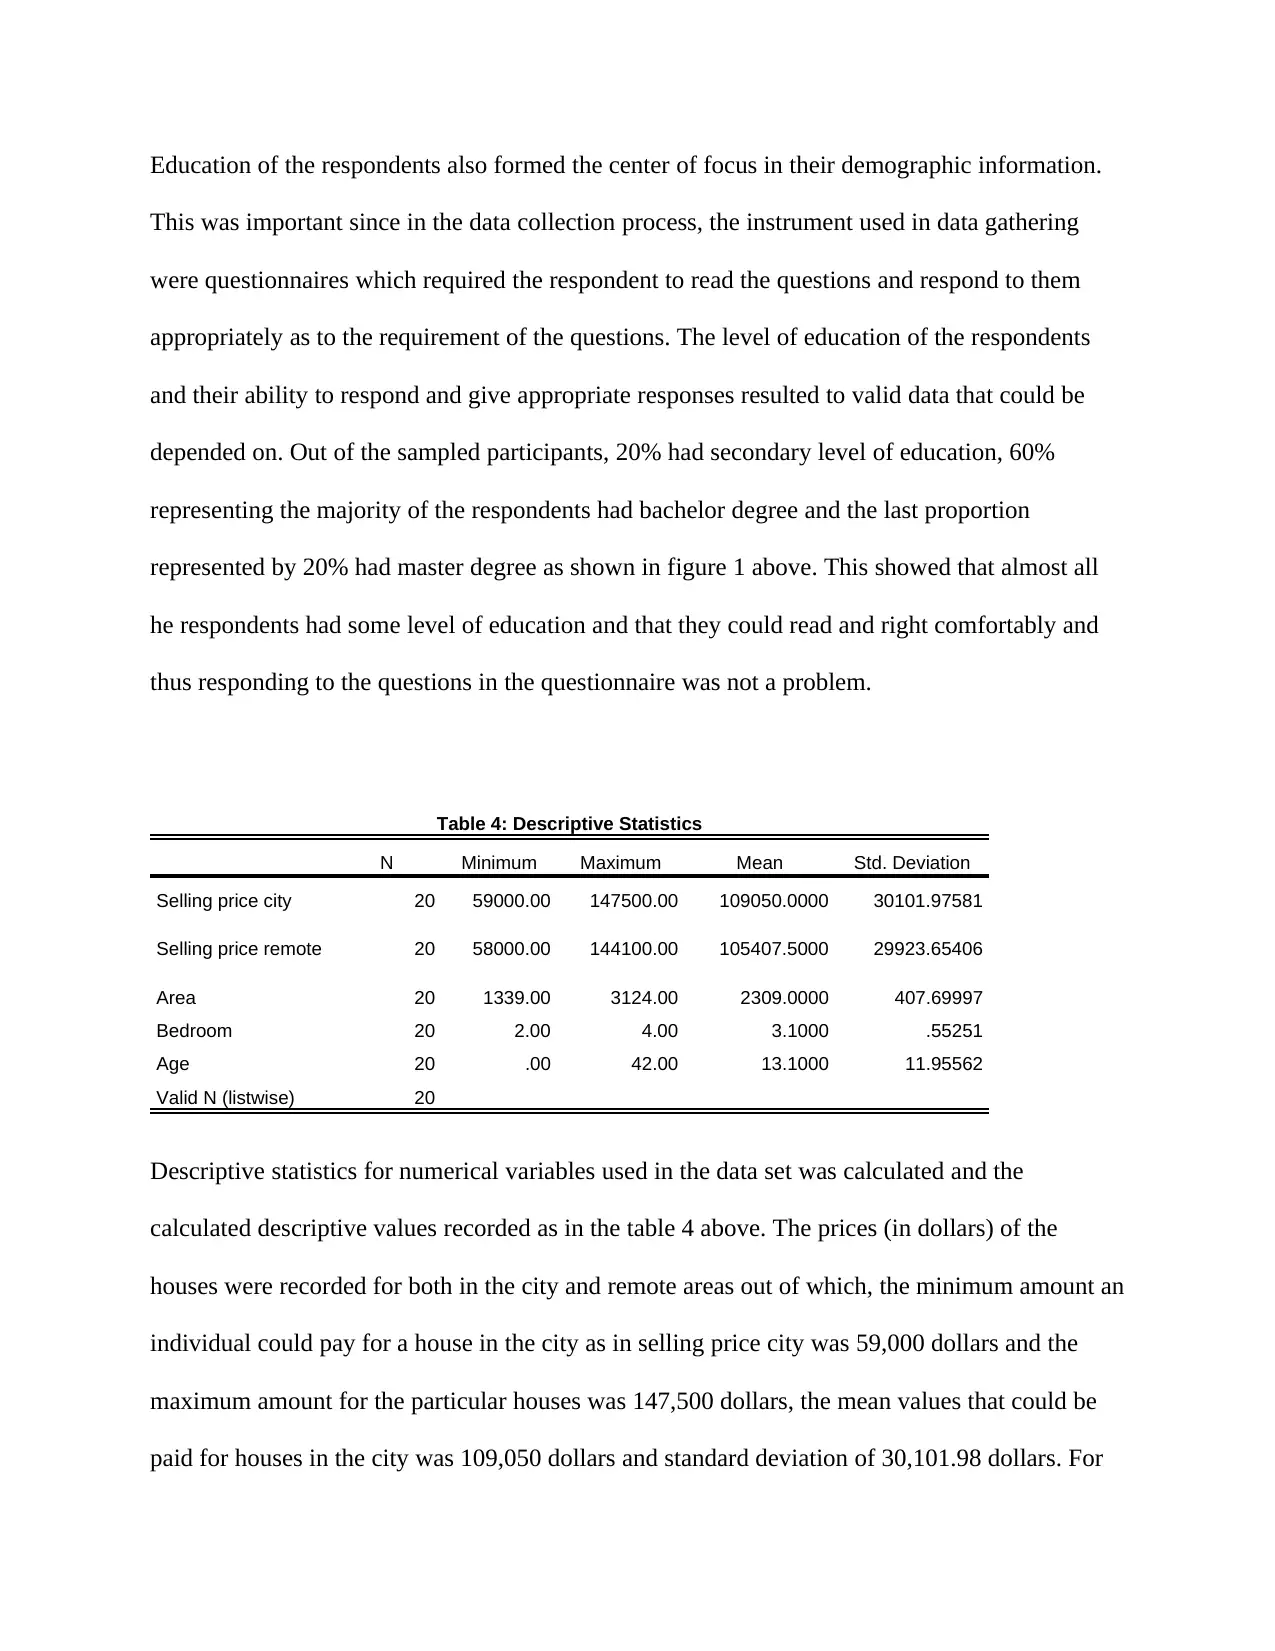
Education of the respondents also formed the center of focus in their demographic information.
This was important since in the data collection process, the instrument used in data gathering
were questionnaires which required the respondent to read the questions and respond to them
appropriately as to the requirement of the questions. The level of education of the respondents
and their ability to respond and give appropriate responses resulted to valid data that could be
depended on. Out of the sampled participants, 20% had secondary level of education, 60%
representing the majority of the respondents had bachelor degree and the last proportion
represented by 20% had master degree as shown in figure 1 above. This showed that almost all
he respondents had some level of education and that they could read and right comfortably and
thus responding to the questions in the questionnaire was not a problem.
Table 4: Descriptive Statistics
N Minimum Maximum Mean Std. Deviation
Selling price city 20 59000.00 147500.00 109050.0000 30101.97581
Selling price remote 20 58000.00 144100.00 105407.5000 29923.65406
Area 20 1339.00 3124.00 2309.0000 407.69997
Bedroom 20 2.00 4.00 3.1000 .55251
Age 20 .00 42.00 13.1000 11.95562
Valid N (listwise) 20
Descriptive statistics for numerical variables used in the data set was calculated and the
calculated descriptive values recorded as in the table 4 above. The prices (in dollars) of the
houses were recorded for both in the city and remote areas out of which, the minimum amount an
individual could pay for a house in the city as in selling price city was 59,000 dollars and the
maximum amount for the particular houses was 147,500 dollars, the mean values that could be
paid for houses in the city was 109,050 dollars and standard deviation of 30,101.98 dollars. For
⊘ This is a preview!⊘
Do you want full access?
Subscribe today to unlock all pages.
Trusted by 1+ million students worldwide
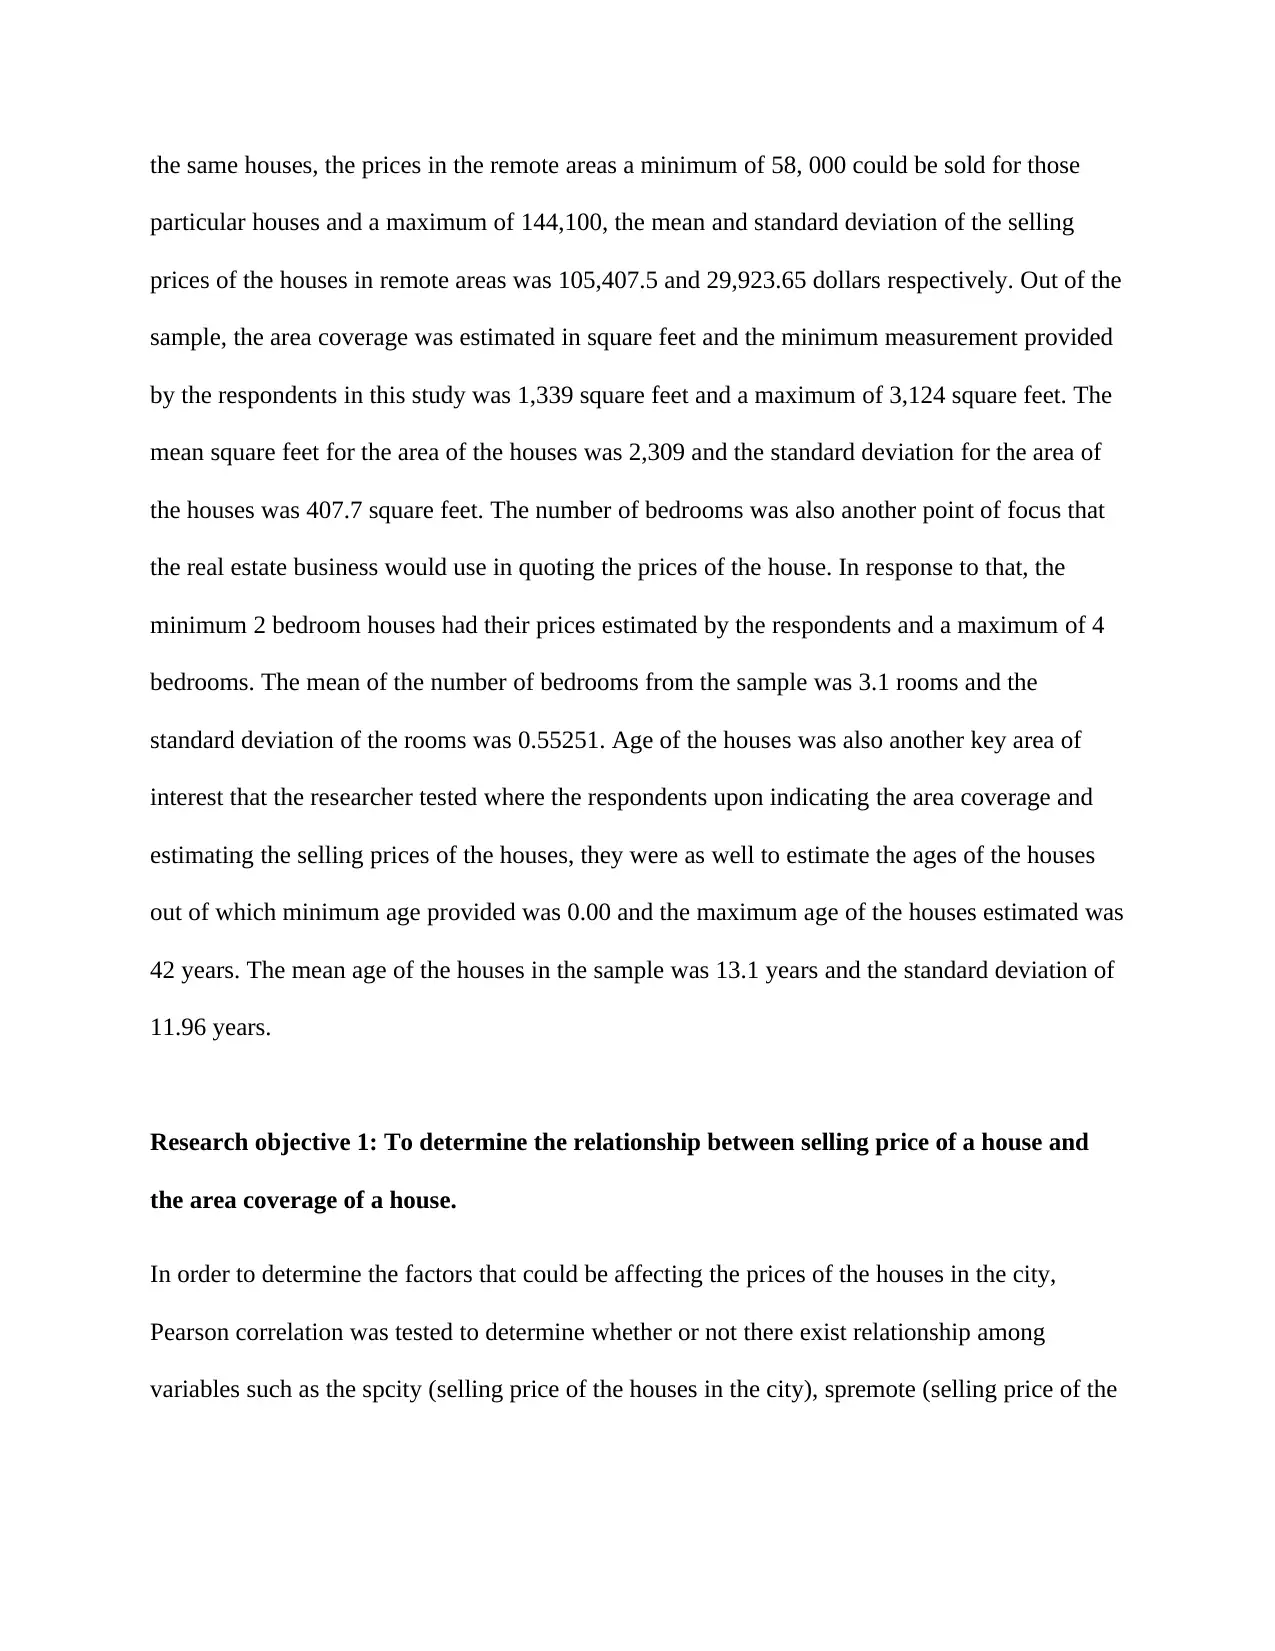
the same houses, the prices in the remote areas a minimum of 58, 000 could be sold for those
particular houses and a maximum of 144,100, the mean and standard deviation of the selling
prices of the houses in remote areas was 105,407.5 and 29,923.65 dollars respectively. Out of the
sample, the area coverage was estimated in square feet and the minimum measurement provided
by the respondents in this study was 1,339 square feet and a maximum of 3,124 square feet. The
mean square feet for the area of the houses was 2,309 and the standard deviation for the area of
the houses was 407.7 square feet. The number of bedrooms was also another point of focus that
the real estate business would use in quoting the prices of the house. In response to that, the
minimum 2 bedroom houses had their prices estimated by the respondents and a maximum of 4
bedrooms. The mean of the number of bedrooms from the sample was 3.1 rooms and the
standard deviation of the rooms was 0.55251. Age of the houses was also another key area of
interest that the researcher tested where the respondents upon indicating the area coverage and
estimating the selling prices of the houses, they were as well to estimate the ages of the houses
out of which minimum age provided was 0.00 and the maximum age of the houses estimated was
42 years. The mean age of the houses in the sample was 13.1 years and the standard deviation of
11.96 years.
Research objective 1: To determine the relationship between selling price of a house and
the area coverage of a house.
In order to determine the factors that could be affecting the prices of the houses in the city,
Pearson correlation was tested to determine whether or not there exist relationship among
variables such as the spcity (selling price of the houses in the city), spremote (selling price of the
Paraphrase This Document
Need a fresh take? Get an instant paraphrase of this document with our AI Paraphraser
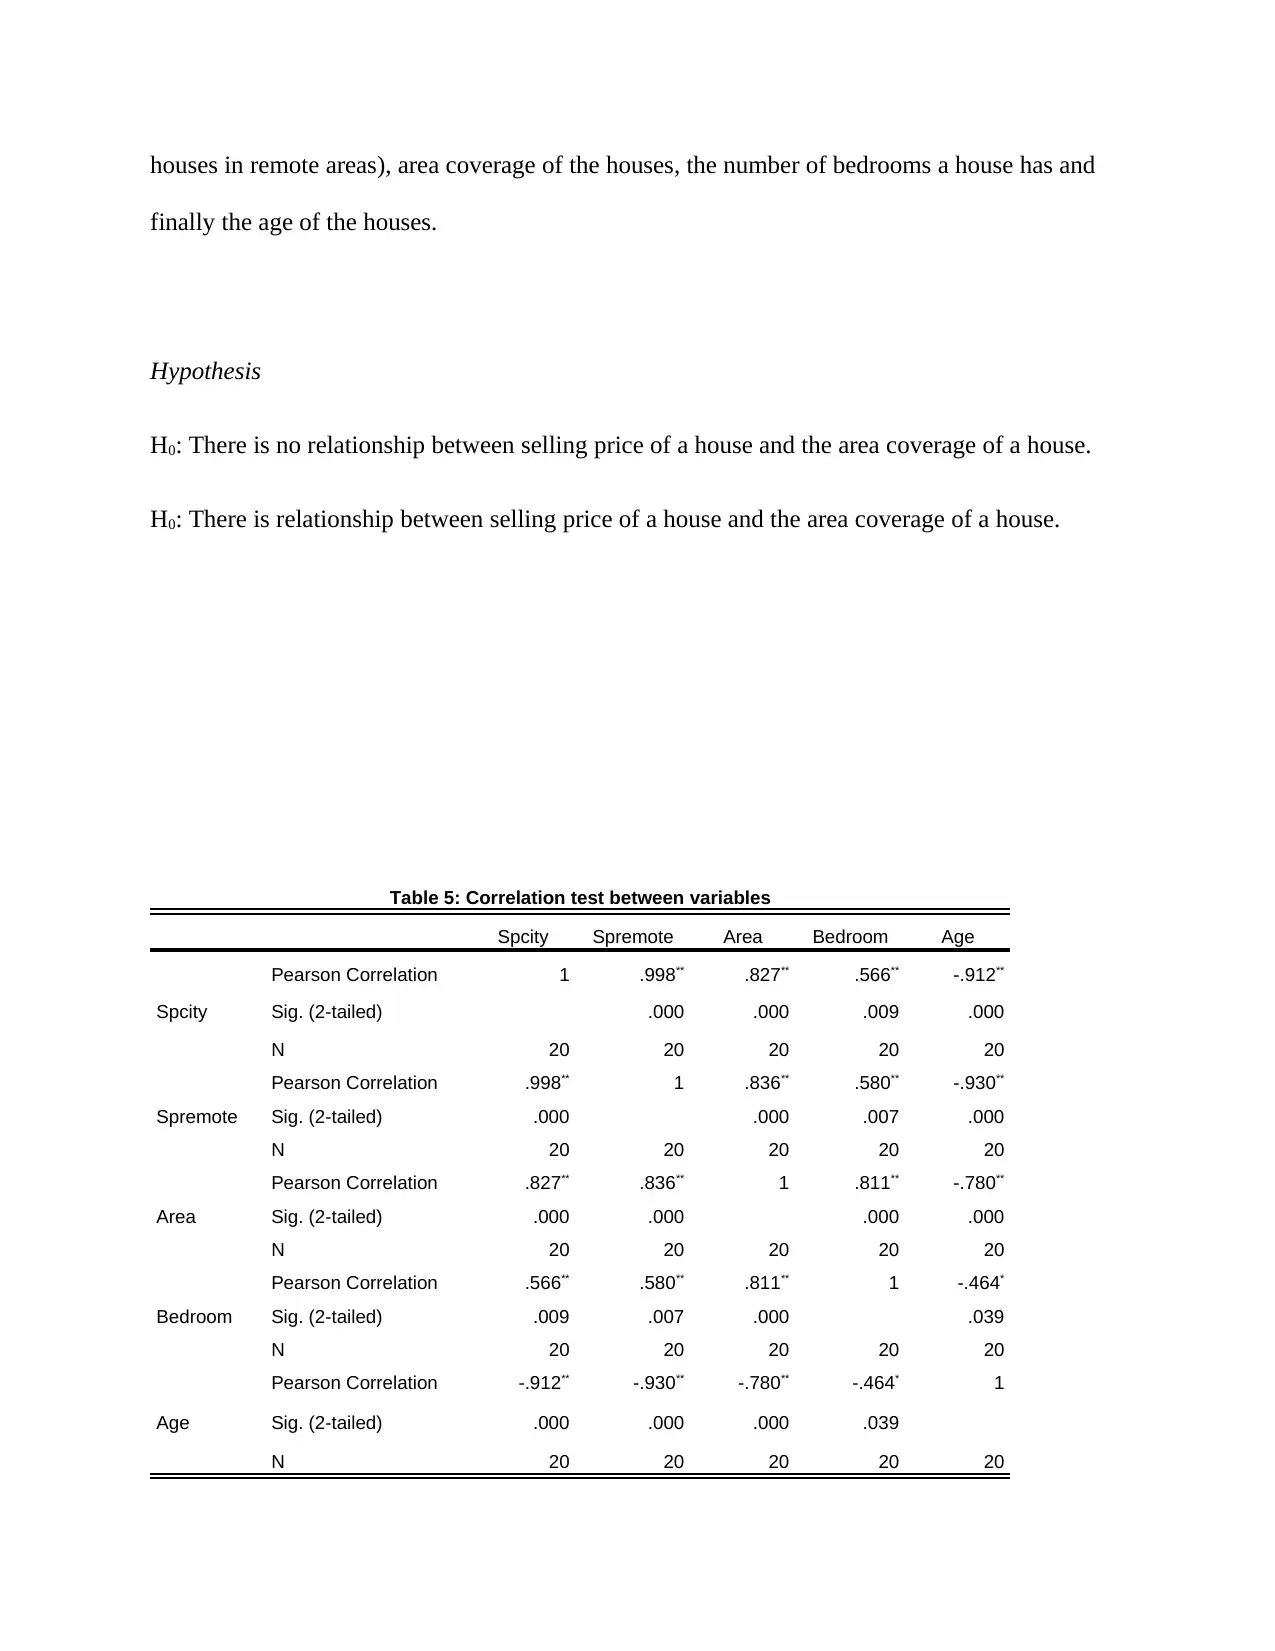
houses in remote areas), area coverage of the houses, the number of bedrooms a house has and
finally the age of the houses.
Hypothesis
H0: There is no relationship between selling price of a house and the area coverage of a house.
H0: There is relationship between selling price of a house and the area coverage of a house.
Table 5: Correlation test between variables
Spcity Spremote Area Bedroom Age
Spcity
Pearson Correlation 1 .998** .827** .566** -.912**
Sig. (2-tailed) .000 .000 .009 .000
N 20 20 20 20 20
Spremote
Pearson Correlation .998** 1 .836** .580** -.930**
Sig. (2-tailed) .000 .000 .007 .000
N 20 20 20 20 20
Area
Pearson Correlation .827** .836** 1 .811** -.780**
Sig. (2-tailed) .000 .000 .000 .000
N 20 20 20 20 20
Bedroom
Pearson Correlation .566** .580** .811** 1 -.464*
Sig. (2-tailed) .009 .007 .000 .039
N 20 20 20 20 20
Age
Pearson Correlation -.912** -.930** -.780** -.464* 1
Sig. (2-tailed) .000 .000 .000 .039
N 20 20 20 20 20
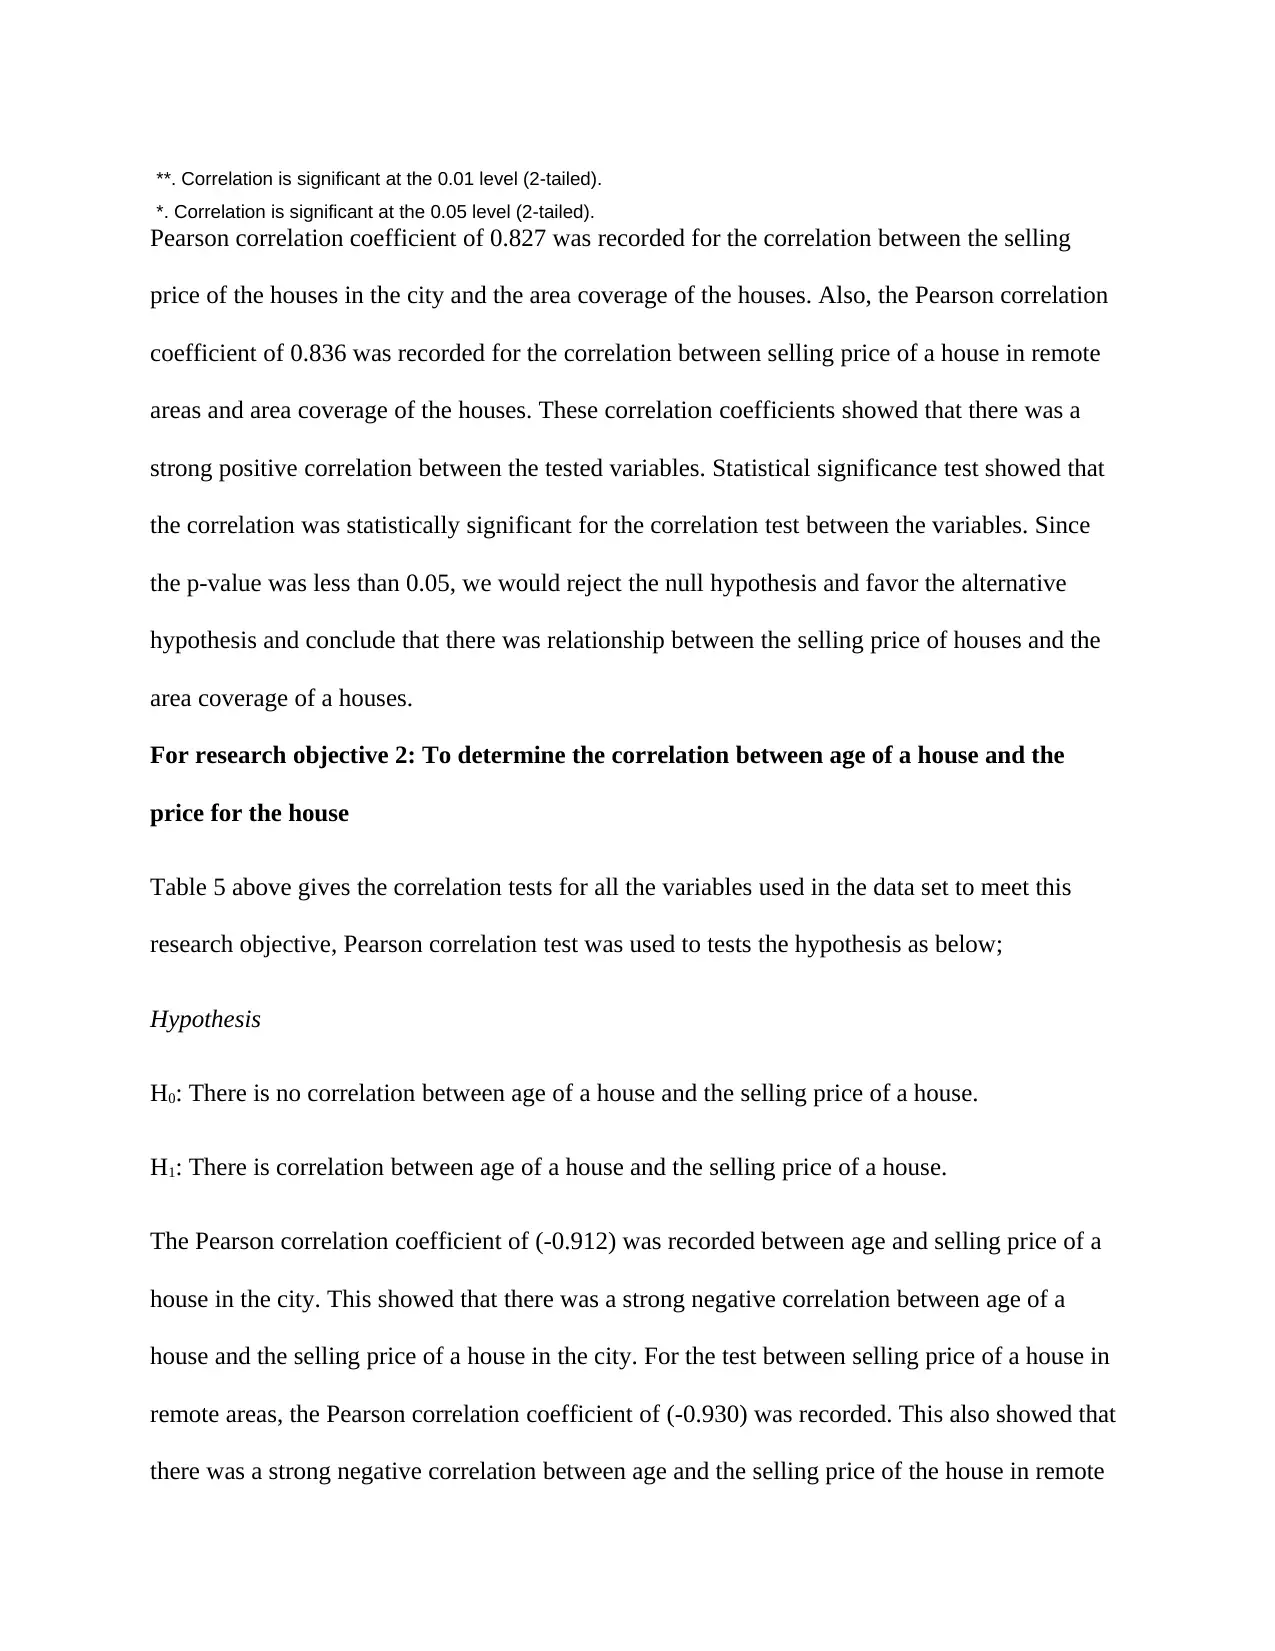
**. Correlation is significant at the 0.01 level (2-tailed).
*. Correlation is significant at the 0.05 level (2-tailed).
Pearson correlation coefficient of 0.827 was recorded for the correlation between the selling
price of the houses in the city and the area coverage of the houses. Also, the Pearson correlation
coefficient of 0.836 was recorded for the correlation between selling price of a house in remote
areas and area coverage of the houses. These correlation coefficients showed that there was a
strong positive correlation between the tested variables. Statistical significance test showed that
the correlation was statistically significant for the correlation test between the variables. Since
the p-value was less than 0.05, we would reject the null hypothesis and favor the alternative
hypothesis and conclude that there was relationship between the selling price of houses and the
area coverage of a houses.
For research objective 2: To determine the correlation between age of a house and the
price for the house
Table 5 above gives the correlation tests for all the variables used in the data set to meet this
research objective, Pearson correlation test was used to tests the hypothesis as below;
Hypothesis
H0: There is no correlation between age of a house and the selling price of a house.
H1: There is correlation between age of a house and the selling price of a house.
The Pearson correlation coefficient of (-0.912) was recorded between age and selling price of a
house in the city. This showed that there was a strong negative correlation between age of a
house and the selling price of a house in the city. For the test between selling price of a house in
remote areas, the Pearson correlation coefficient of (-0.930) was recorded. This also showed that
there was a strong negative correlation between age and the selling price of the house in remote
⊘ This is a preview!⊘
Do you want full access?
Subscribe today to unlock all pages.
Trusted by 1+ million students worldwide
1 out of 19
Related Documents


Your All-in-One AI-Powered Toolkit for Academic Success.
+13062052269
info@desklib.com
Available 24*7 on WhatsApp / Email
![[object Object]](/_next/static/media/star-bottom.7253800d.svg)
Unlock your academic potential
Copyright © 2020–2026 A2Z Services. All Rights Reserved. Developed and managed by ZUCOL.