Report on Academic Achievement Factors in First-Year Business Students

Verified

Added on  2023/03/31

|7
|597
|419
Report
AI Summary
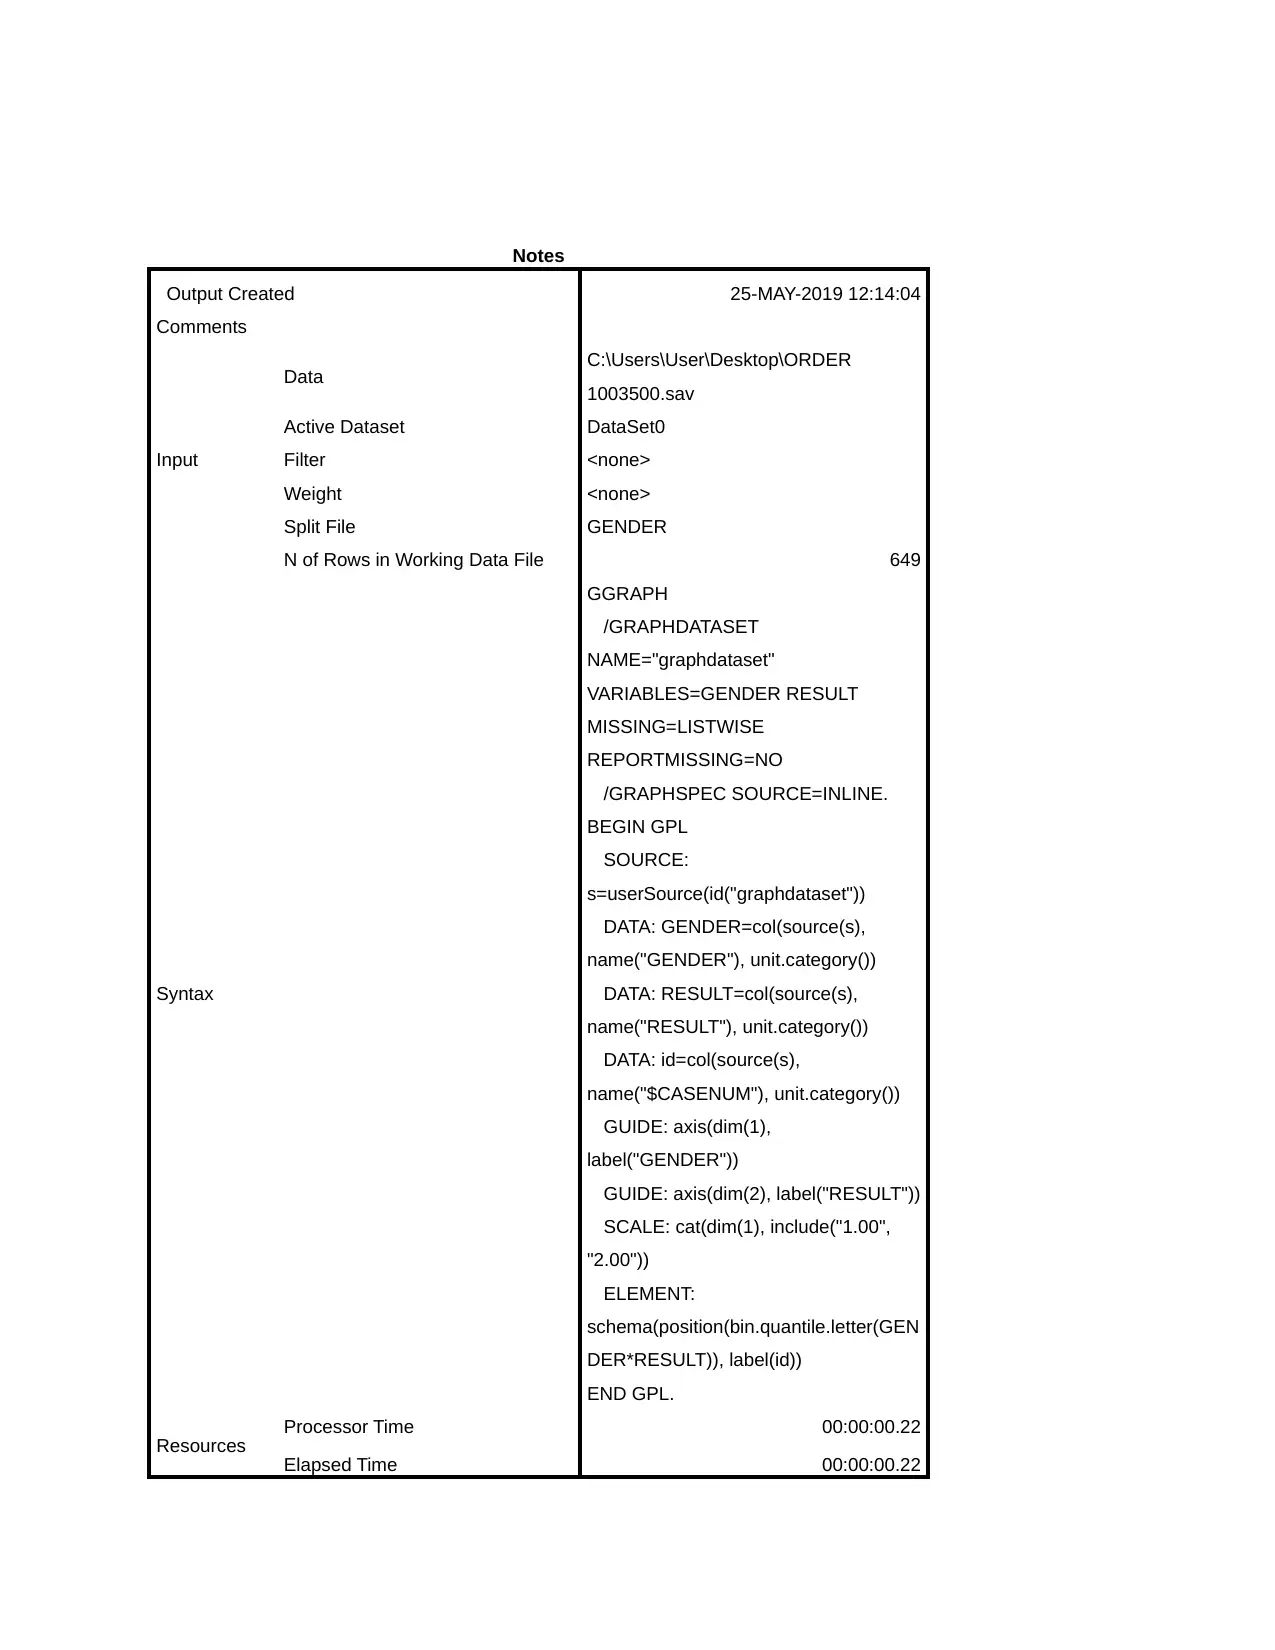
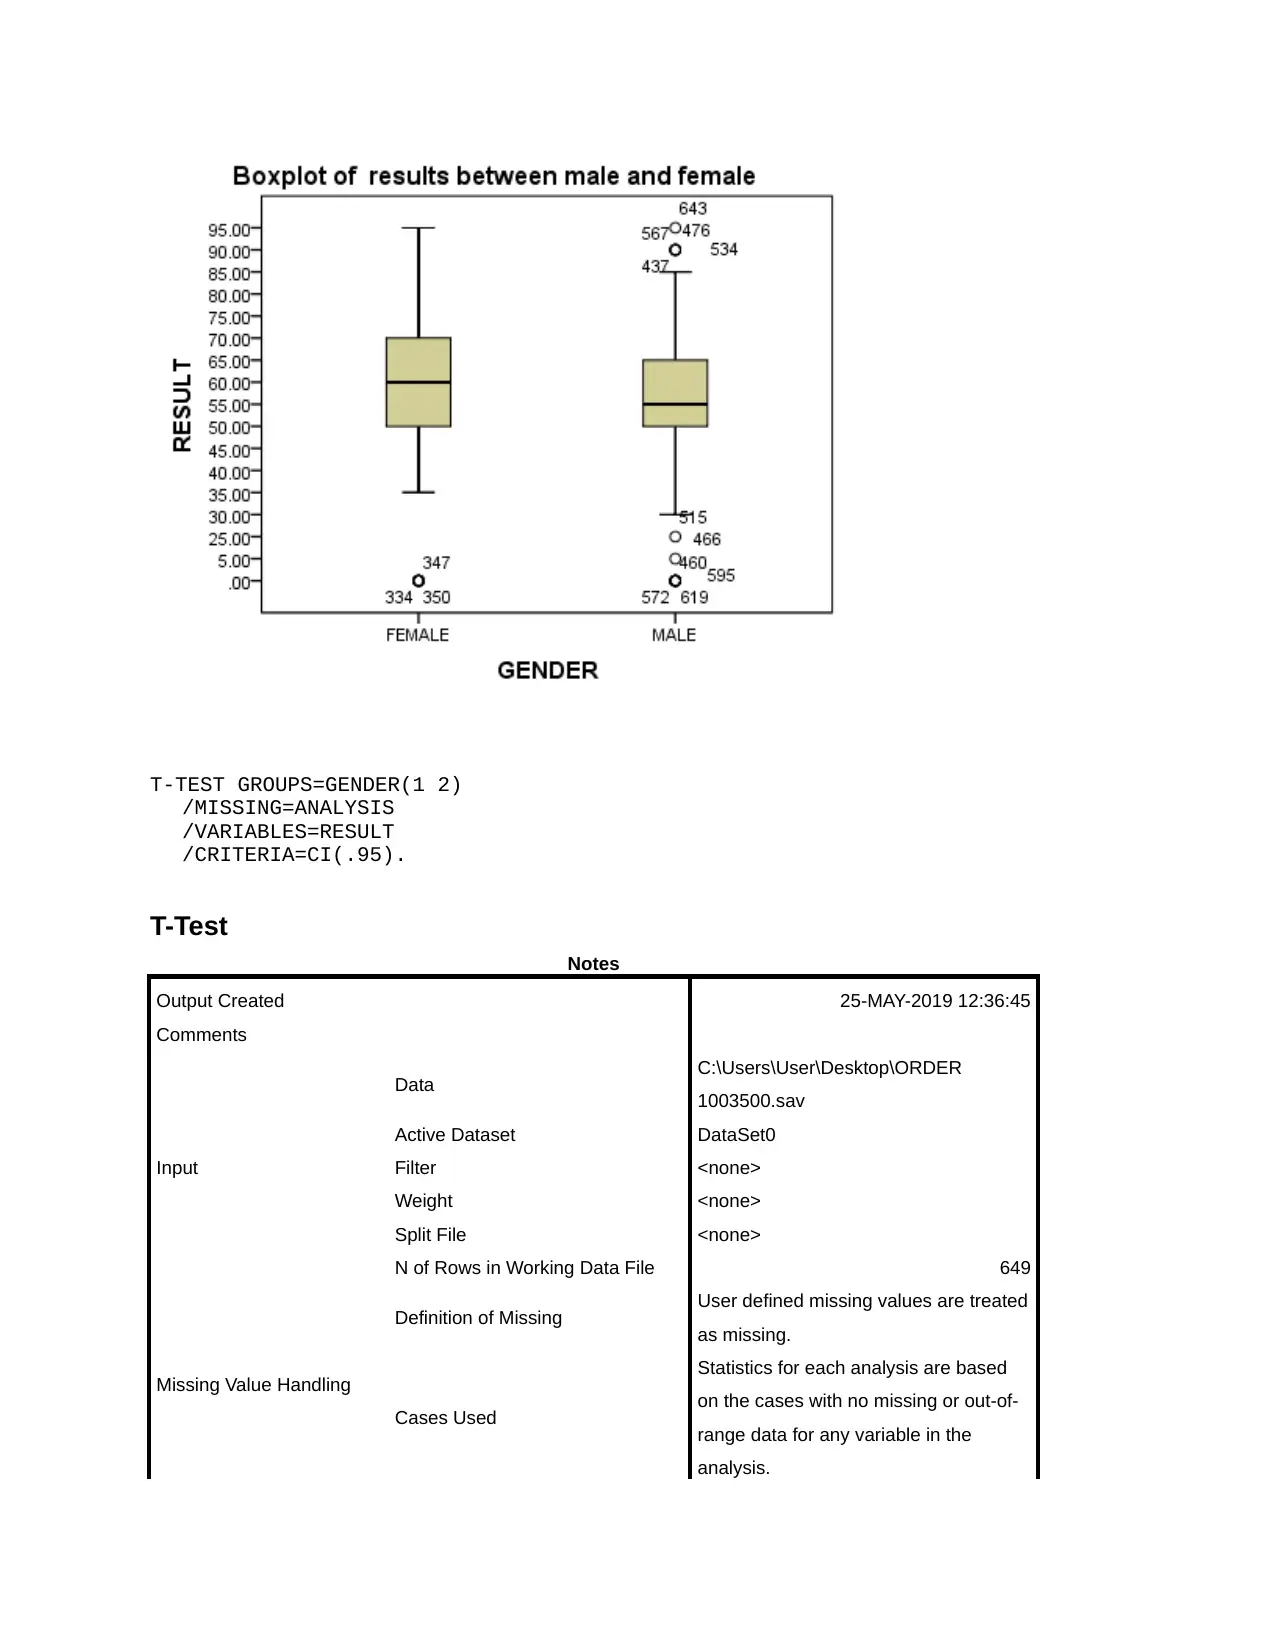
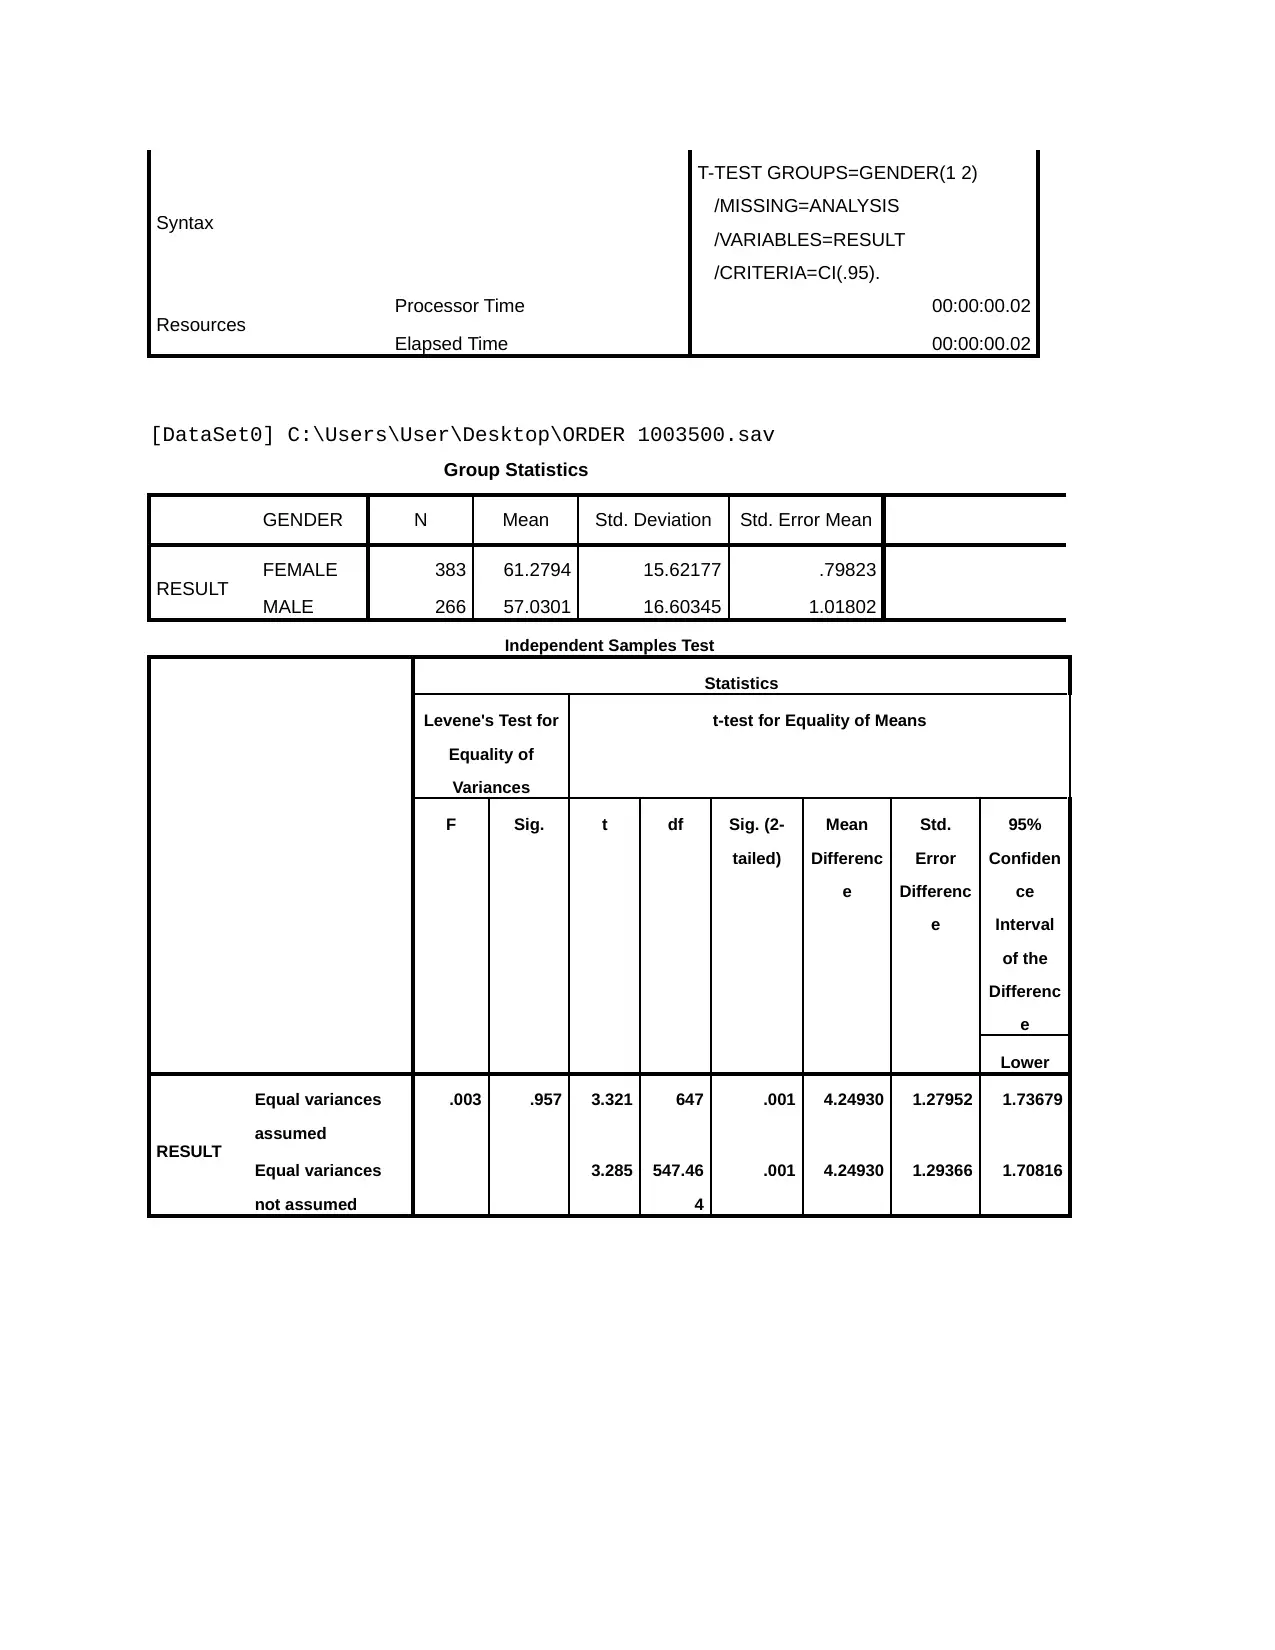
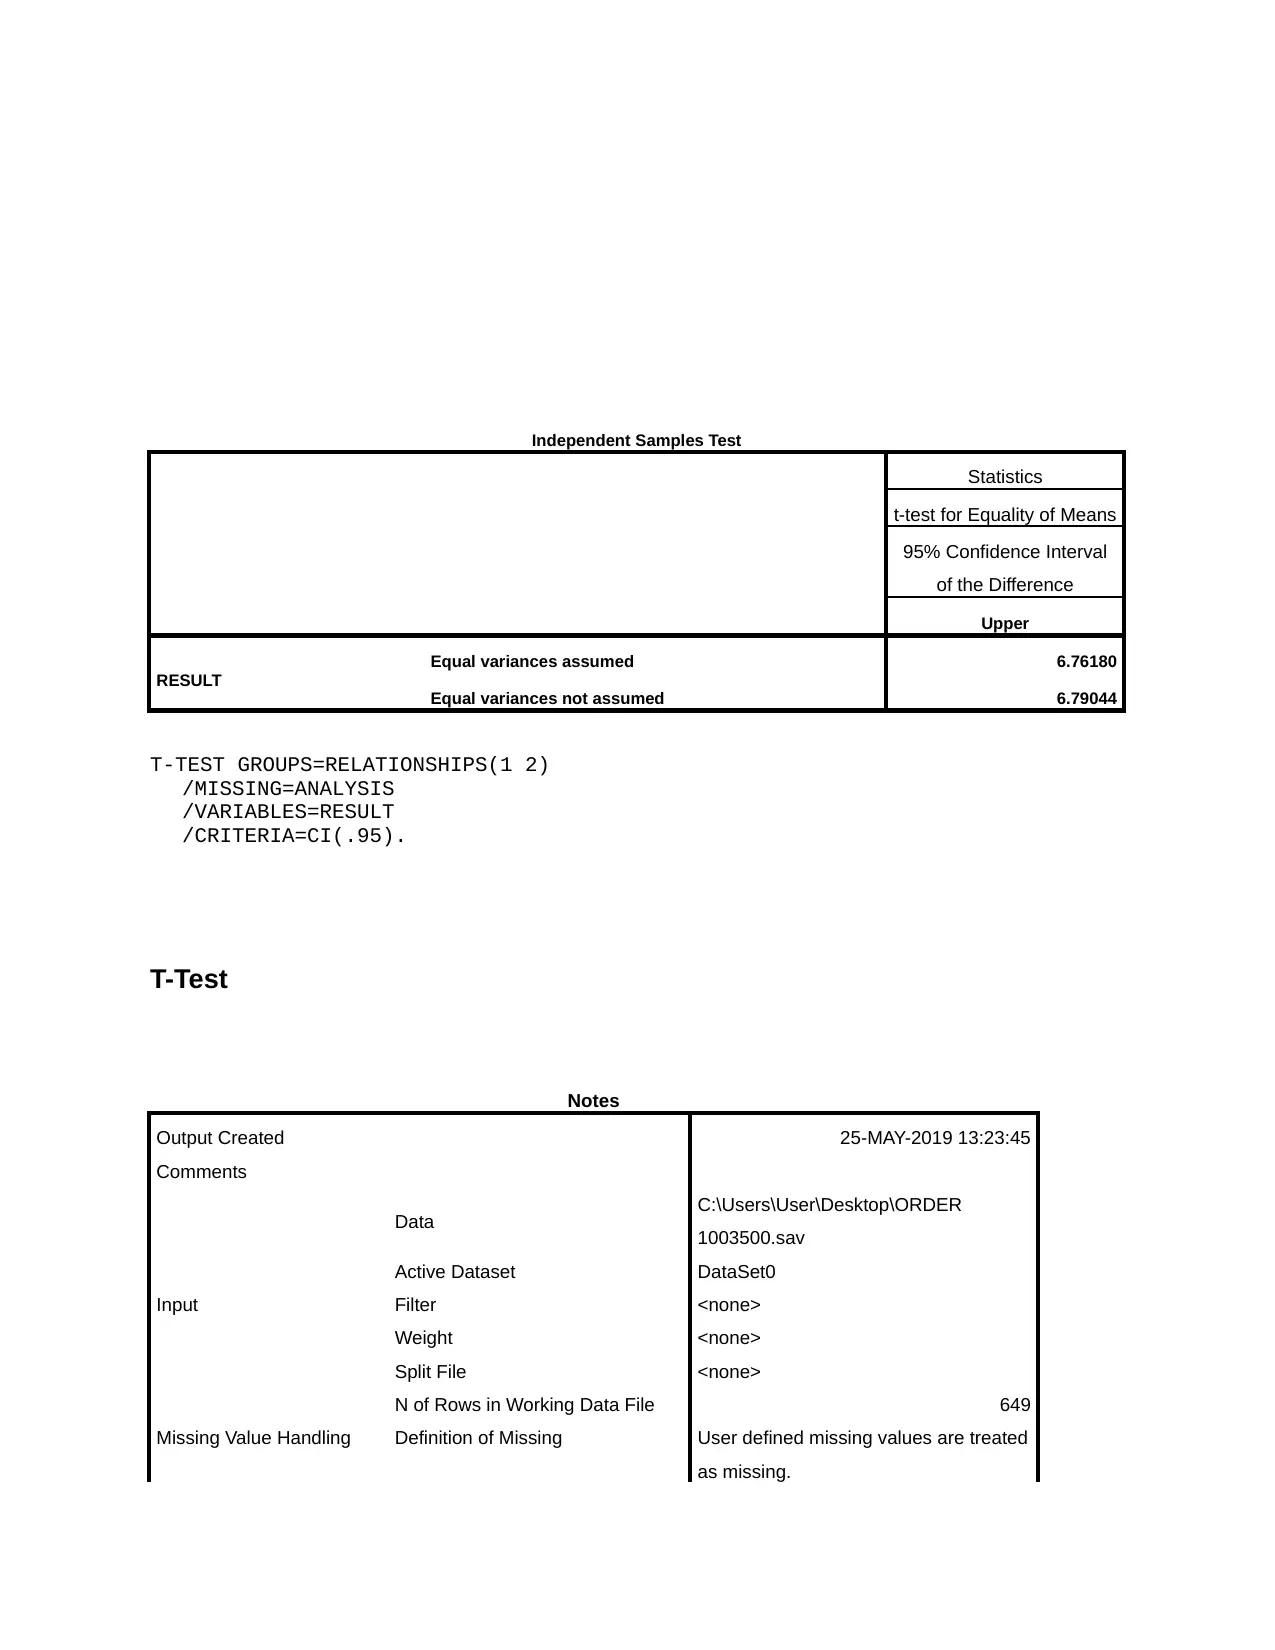
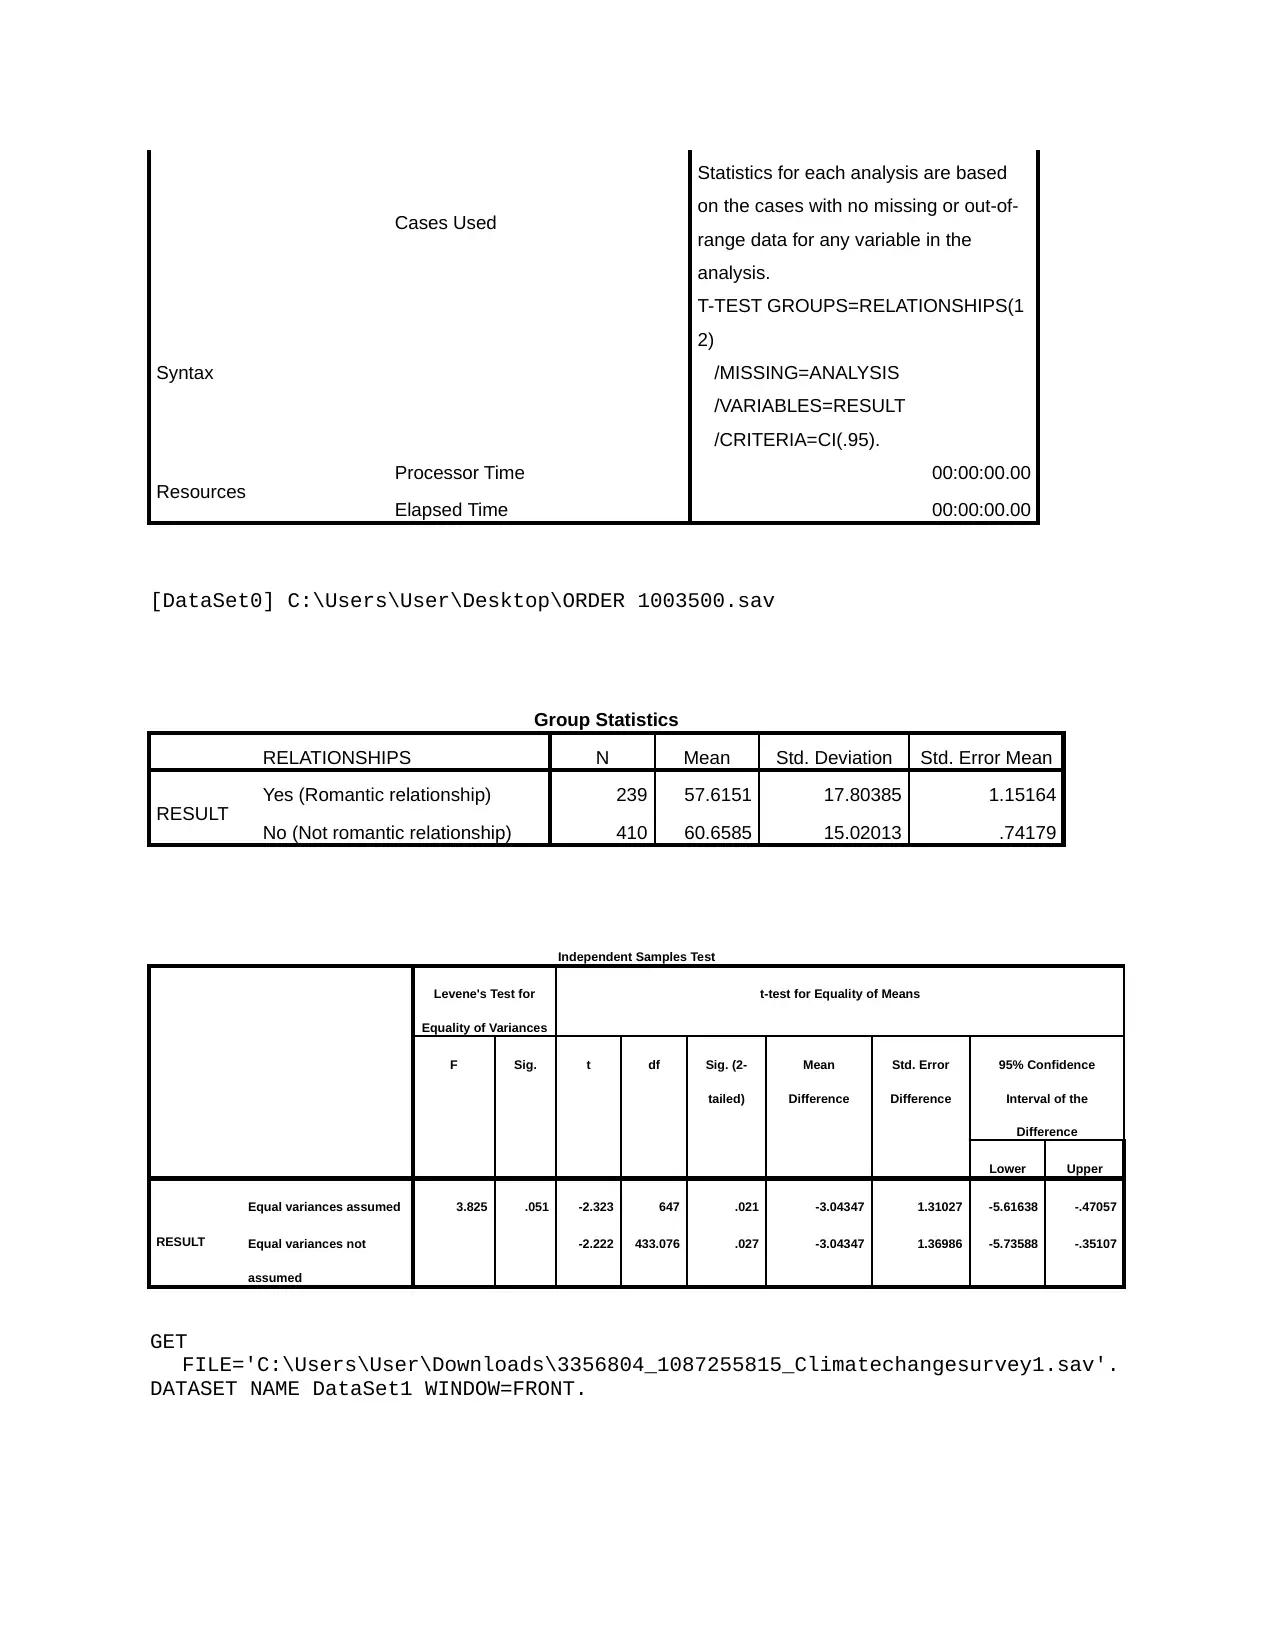
This assignment presents a statistical analysis investigating the factors influencing the academic achievement of first-year business students. The analysis utilizes data collected from 649 students, including their test scores in core business units, gender, age, education level of their mother, relationship status, and attendance records for lectures and tutorials. The report includes statistical outputs such as GGRAPH visualizations, T-tests comparing the means of different groups (e.g., gender, relationship status) and interpretations of the results. The findings explore the relationships between these variables and student performance, providing insights into potential areas for academic intervention and support. Datasets and survey details are included to enhance understanding of the research context and variables involved.
tabler-icon-diamond-filled.svg

Contribute Materials

Your contribution can guide someone’s learning journey. Share your documents today.
Document Page
Notes
Output Created 25-MAY-2019 12:14:04
Comments
Input
Data C:\Users\User\Desktop\ORDER
1003500.sav
Active Dataset DataSet0
Filter <none>
Weight <none>
Split File GENDER
N of Rows in Working Data File 649
Syntax
GGRAPH
/GRAPHDATASET
NAME="graphdataset"
VARIABLES=GENDER RESULT
MISSING=LISTWISE
REPORTMISSING=NO
/GRAPHSPEC SOURCE=INLINE.
BEGIN GPL
SOURCE:
s=userSource(id("graphdataset"))
DATA: GENDER=col(source(s),
name("GENDER"), unit.category())
DATA: RESULT=col(source(s),
name("RESULT"), unit.category())
DATA: id=col(source(s),
name("$CASENUM"), unit.category())
GUIDE: axis(dim(1),
label("GENDER"))
GUIDE: axis(dim(2), label("RESULT"))
SCALE: cat(dim(1), include("1.00",
"2.00"))
ELEMENT:
schema(position(bin.quantile.letter(GEN
DER*RESULT)), label(id))
END GPL.
Resources Processor Time 00:00:00.22
Elapsed Time 00:00:00.22
tabler-icon-diamond-filled.svg

Secure Best Marks with AI Grader

Need help grading? Try our AI Grader for instant feedback on your assignments.
Document Page
SPLIT FILE OFF.
* Chart Builder.
GGRAPH
/GRAPHDATASET NAME="graphdataset" VARIABLES=GENDER RESULT MISSING=LISTWISE
REPORTMISSING=NO
/GRAPHSPEC SOURCE=INLINE.
BEGIN GPL
SOURCE: s=userSource(id("graphdataset"))
DATA: GENDER=col(source(s), name("GENDER"), unit.category())
DATA: RESULT=col(source(s), name("RESULT"), unit.category())
DATA: id=col(source(s), name("$CASENUM"), unit.category())
GUIDE: axis(dim(1), label("GENDER"))
GUIDE: axis(dim(2), label("RESULT"))
GUIDE: text.title(label("Boxplot of results between male and female"))
SCALE: cat(dim(1), include("1.00", "2.00"))
ELEMENT: schema(position(bin.quantile.letter(GENDER*RESULT)), label(id))
END GPL.
GGraph
Notes
Output Created 25-MAY-2019 12:17:57
Comments
Input
Data C:\Users\User\Desktop\ORDER
1003500.sav
Active Dataset DataSet0
Filter <none>
Weight <none>
Split File <none>
N of Rows in Working Data File 649
Document Page
Syntax
GGRAPH
/GRAPHDATASET
NAME="graphdataset"
VARIABLES=GENDER RESULT
MISSING=LISTWISE
REPORTMISSING=NO
/GRAPHSPEC SOURCE=INLINE.
BEGIN GPL
SOURCE:
s=userSource(id("graphdataset"))
DATA: GENDER=col(source(s),
name("GENDER"), unit.category())
DATA: RESULT=col(source(s),
name("RESULT"), unit.category())
DATA: id=col(source(s),
name("$CASENUM"), unit.category())
GUIDE: axis(dim(1),
label("GENDER"))
GUIDE: axis(dim(2), label("RESULT"))
GUIDE: text.title(label("Boxplot of
results between male and female"))
SCALE: cat(dim(1), include("1.00",
"2.00"))
ELEMENT:
schema(position(bin.quantile.letter(GEN
DER*RESULT)), label(id))
END GPL.
Resources Processor Time 00:00:00.22
Elapsed Time 00:00:00.19
[DataSet0] C:\Users\User\Desktop\ORDER 1003500.sav
Document Page
T-TEST GROUPS=GENDER(1 2)
/MISSING=ANALYSIS
/VARIABLES=RESULT
/CRITERIA=CI(.95).
T-Test
Notes
Output Created 25-MAY-2019 12:36:45
Comments
Input
Data C:\Users\User\Desktop\ORDER
1003500.sav
Active Dataset DataSet0
Filter <none>
Weight <none>
Split File <none>
N of Rows in Working Data File 649
Missing Value Handling
Definition of Missing User defined missing values are treated
as missing.
Cases Used
Statistics for each analysis are based
on the cases with no missing or out-of-
range data for any variable in the
analysis.
tabler-icon-diamond-filled.svg

Secure Best Marks with AI Grader

Need help grading? Try our AI Grader for instant feedback on your assignments.
Document Page
Syntax
T-TEST GROUPS=GENDER(1 2)
/MISSING=ANALYSIS
/VARIABLES=RESULT
/CRITERIA=CI(.95).
Resources Processor Time 00:00:00.02
Elapsed Time 00:00:00.02
[DataSet0] C:\Users\User\Desktop\ORDER 1003500.sav
Group Statistics
GENDER N Mean Std. Deviation Std. Error Mean
RESULT FEMALE 383 61.2794 15.62177 .79823
MALE 266 57.0301 16.60345 1.01802
Independent Samples Test
Statistics
Levene's Test for
Equality of
Variances
t-test for Equality of Means
F Sig. t df Sig. (2-
tailed)
Mean
Differenc
e
Std.
Error
Differenc
e
95%
Confiden
ce
Interval
of the
Differenc
e
Lower
RESULT
Equal variances
assumed
.003 .957 3.321 647 .001 4.24930 1.27952 1.73679
Equal variances
not assumed
3.285 547.46
4
.001 4.24930 1.29366 1.70816
Document Page
Independent Samples Test
Statistics
t-test for Equality of Means
95% Confidence Interval
of the Difference
Upper
RESULT
Equal variances assumed 6.76180
Equal variances not assumed 6.79044
T-TEST GROUPS=RELATIONSHIPS(1 2)
/MISSING=ANALYSIS
/VARIABLES=RESULT
/CRITERIA=CI(.95).
T-Test
Notes
Output Created 25-MAY-2019 13:23:45
Comments
Input
Data C:\Users\User\Desktop\ORDER
1003500.sav
Active Dataset DataSet0
Filter <none>
Weight <none>
Split File <none>
N of Rows in Working Data File 649
Missing Value Handling Definition of Missing User defined missing values are treated
as missing.
Document Page
Cases Used
Statistics for each analysis are based
on the cases with no missing or out-of-
range data for any variable in the
analysis.
Syntax
T-TEST GROUPS=RELATIONSHIPS(1
2)
/MISSING=ANALYSIS
/VARIABLES=RESULT
/CRITERIA=CI(.95).
Resources Processor Time 00:00:00.00
Elapsed Time 00:00:00.00
[DataSet0] C:\Users\User\Desktop\ORDER 1003500.sav
Group Statistics
RELATIONSHIPS N Mean Std. Deviation Std. Error Mean
RESULT Yes (Romantic relationship) 239 57.6151 17.80385 1.15164
No (Not romantic relationship) 410 60.6585 15.02013 .74179
Independent Samples Test
Levene's Test for
Equality of Variances
t-test for Equality of Means
F Sig. t df Sig. (2-
tailed)
Mean
Difference
Std. Error
Difference
95% Confidence
Interval of the
Difference
Lower Upper
RESULT
Equal variances assumed 3.825 .051 -2.323 647 .021 -3.04347 1.31027 -5.61638 -.47057
Equal variances not
assumed
-2.222 433.076 .027 -3.04347 1.36986 -5.73588 -.35107
GET
FILE='C:\Users\User\Downloads\3356804_1087255815_Climatechangesurvey1.sav'.
DATASET NAME DataSet1 WINDOW=FRONT.
chevron_up_icon
1 out of 7
circle_padding
hide_on_mobile
zoom_out_icon
logo.png

Your All-in-One AI-Powered Toolkit for Academic Success.

Available 24*7 on WhatsApp / Email

[object Object]