Analysis: Factors Impacting Information Management System Performance
VerifiedAdded on 2023/04/25
|10
|1984
|307
Report
AI Summary
This report investigates the factors affecting the general performance of information management systems, focusing on hardware, software, networking/telecommunication, and decision support systems. The study utilizes secondary data and employs correlation, ANOVA, and regression analyses to determine the relationships between these factors and system performance. The findings reveal positive correlations between software, networking, and telecommunication with the general system performance. The analysis shows that software and networking/telecommunication are statistically significant, while hardware and decision support systems are not. The report concludes with recommendations for upgrading software and prioritizing telecommunication and networking to enhance the overall performance of the information management system. The study also acknowledges limitations due to the scarcity of related research in this field.
FACTORS AFFECTING THE GENERAL PERFORMANCE OF THE INFORMATION MANAGEMENT SYSTEM
Table of Contents
1.0. Introduction...................................................................................................................................1
1.2. Problem statement.......................................................................................................................1
1.3. Research questions.........................................................................................................................2
1.4. Research objective........................................................................................................................2
1.4.1. Specific objectives......................................................................................................................2
1.5. Hypothesis testing.........................................................................................................................2
2.0. Data collection and data description............................................................................................2
2.1. Data analysis.................................................................................................................................2
2.2. Correlation....................................................................................................................................3
Table 1: Correlation coefficient..........................................................................................................3
2.3. ANOVA.........................................................................................................................................4
2.3.1. Reliability of the data................................................................................................................4
Table II: ANOVA Table..........................................................................................................................4
2.4. Regression analysis.......................................................................................................................4
Table III: Regression coefficients.......................................................................................................4
Table IV: SUMMARY OUTPUT.............................................................................................................5
3.0. Conclusion.....................................................................................................................................5
4.0. Limitation......................................................................................................................................6
5.0. Recommendation...........................................................................................................................6
6.0. References......................................................................................................................................7
7.0. APPENDIX A: DATA....................................................................................................................8
Paraphrase This Document
Need a fresh take? Get an instant paraphrase of this document with our AI Paraphraser
1.0. Introduction
The Information management system in an institution is one of the important areas that need
greater attention. This is where the database of every individual, transaction track record as
well as the identity of items that circulates in any institution. (Squara, 2013) Reveal that
sophisticated machines are needed due to the need for improving the capabilities of better
decision making, and development of several cybercrimes across the globe (José, 2011).
Technological revolution has simplified and provided secrecy across the sectors of the
economy, however, technical experts are also developing software’s to hack systems
(Chakraborty, 2019) to obtain the data, this has become a common threat and individuals
from both private and public sector are always trying to find ways on how to upgrade their
management information system (GRISHKO, 2014). This research, therefore, is worth being
conducted to asses how the performance of the management information systems is being
influenced by hardware, software, networking and telecommunication, and the decision
support system.
1.2. Problem statement
Following the rise of computer security threats (Stafford, 2010) and the need to improve
decision making based on the data that are gathered in the information management systems,
individuals as well as the institution are concerned with how to upgrade the information
management system (Anisimova, 2009) and at the same time curb the issue of computer
security threats. This study, therefore, asses how hardware, software, network and
communication, and the decision support system affect the information management system
general performance at company XYZ.
1.3. Research questions
1. What factors affect the information management system general performance?
2. How do these factors being investigated affect the information management system
general performance?
3. To improve existing information management system, what must or should it be
done?
1.4. Research objective
The general objective of this study is to determine the factors that affect information
management system general performance
1.4.1. Specific objectives
1. To investigate if there is a linear relationship between the hardware and the
information management system general performance
2. To identify the effect of the software on information management system general
performance.
3. To identify the effect of networking and telecommunication on information
management system general performance.
4. To investigate how decision support system, affect information management system
general performance
1.5. Hypothesis testing
H0: There is no association between the dependent and independent variables.
H1: There is an association between the dependent and independent variables
2.0. Data collection and data description
This study utilized secondary data that was gathered in the information management system.
The quantitative data consists of five variables namely hardware, software, network and
telecommunication, decision support system, and the information management system
general performance.
2.1. Data analysis
The data were analyzed by use of excel. Correlation analysis was conducted to investigate
how does the dependent and independent variables correlate. Regression and analysis of
variance were employed to develop the model that demonstrates the linear relationship
between the independent factors and the dependent factor.
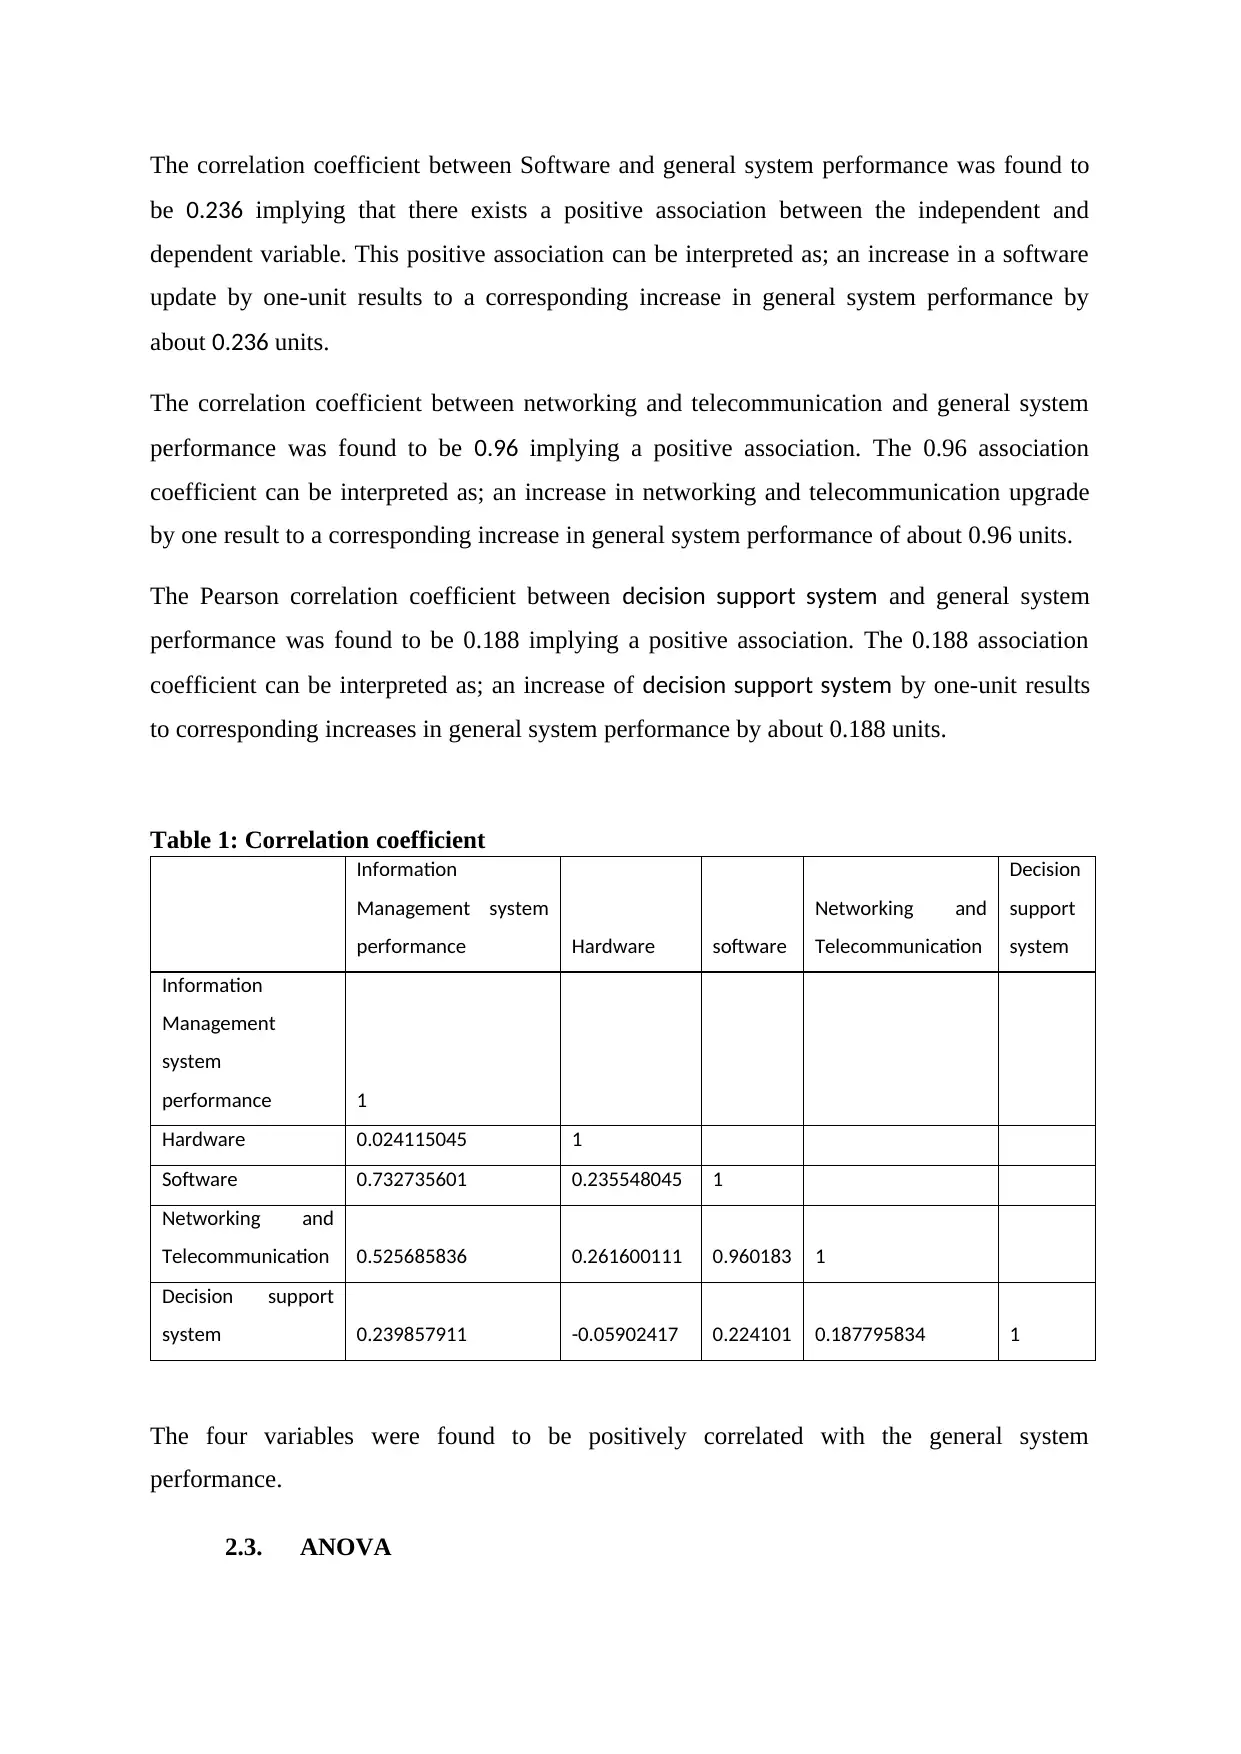
2.2. Correlation
Correlation analysis is carried out to assess the relationship between variables. Of more
interest in this analysis, is the correlation between the dependent and independent variables
The correlation coefficient between hardware and Information Management system
performance is 0.024 implying a positive association between the two variables. A change in
hardware in one direction results in a change in the general system performance in the same
direction.
The general objective of this study is to determine the factors that affect information
management system general performance
1.4.1. Specific objectives
1. To investigate if there is a linear relationship between the hardware and the
information management system general performance
2. To identify the effect of the software on information management system general
performance.
3. To identify the effect of networking and telecommunication on information
management system general performance.
4. To investigate how decision support system, affect information management system
general performance
1.5. Hypothesis testing
H0: There is no association between the dependent and independent variables.
H1: There is an association between the dependent and independent variables
2.0. Data collection and data description
This study utilized secondary data that was gathered in the information management system.
The quantitative data consists of five variables namely hardware, software, network and
telecommunication, decision support system, and the information management system
general performance.
2.1. Data analysis
The data were analyzed by use of excel. Correlation analysis was conducted to investigate
how does the dependent and independent variables correlate. Regression and analysis of
variance were employed to develop the model that demonstrates the linear relationship
between the independent factors and the dependent factor.
2.2. Correlation
Correlation analysis is carried out to assess the relationship between variables. Of more
interest in this analysis, is the correlation between the dependent and independent variables
The correlation coefficient between hardware and Information Management system
performance is 0.024 implying a positive association between the two variables. A change in
hardware in one direction results in a change in the general system performance in the same
direction.
⊘ This is a preview!⊘
Do you want full access?
Subscribe today to unlock all pages.
Trusted by 1+ million students worldwide
The correlation coefficient between Software and general system performance was found to
be 0.236 implying that there exists a positive association between the independent and
dependent variable. This positive association can be interpreted as; an increase in a software
update by one-unit results to a corresponding increase in general system performance by
about 0.236 units.
The correlation coefficient between networking and telecommunication and general system
performance was found to be 0.96 implying a positive association. The 0.96 association
coefficient can be interpreted as; an increase in networking and telecommunication upgrade
by one result to a corresponding increase in general system performance of about 0.96 units.
The Pearson correlation coefficient between decision support system and general system
performance was found to be 0.188 implying a positive association. The 0.188 association
coefficient can be interpreted as; an increase of decision support system by one-unit results
to corresponding increases in general system performance by about 0.188 units.
Table 1: Correlation coefficient
Information
Management system
performance Hardware software
Networking and
Telecommunication
Decision
support
system
Information
Management
system
performance 1
Hardware 0.024115045 1
Software 0.732735601 0.235548045 1
Networking and
Telecommunication 0.525685836 0.261600111 0.960183 1
Decision support
system 0.239857911 -0.05902417 0.224101 0.187795834 1
The four variables were found to be positively correlated with the general system
performance.
2.3. ANOVA
Paraphrase This Document
Need a fresh take? Get an instant paraphrase of this document with our AI Paraphraser
2.3.1. Reliability of the data
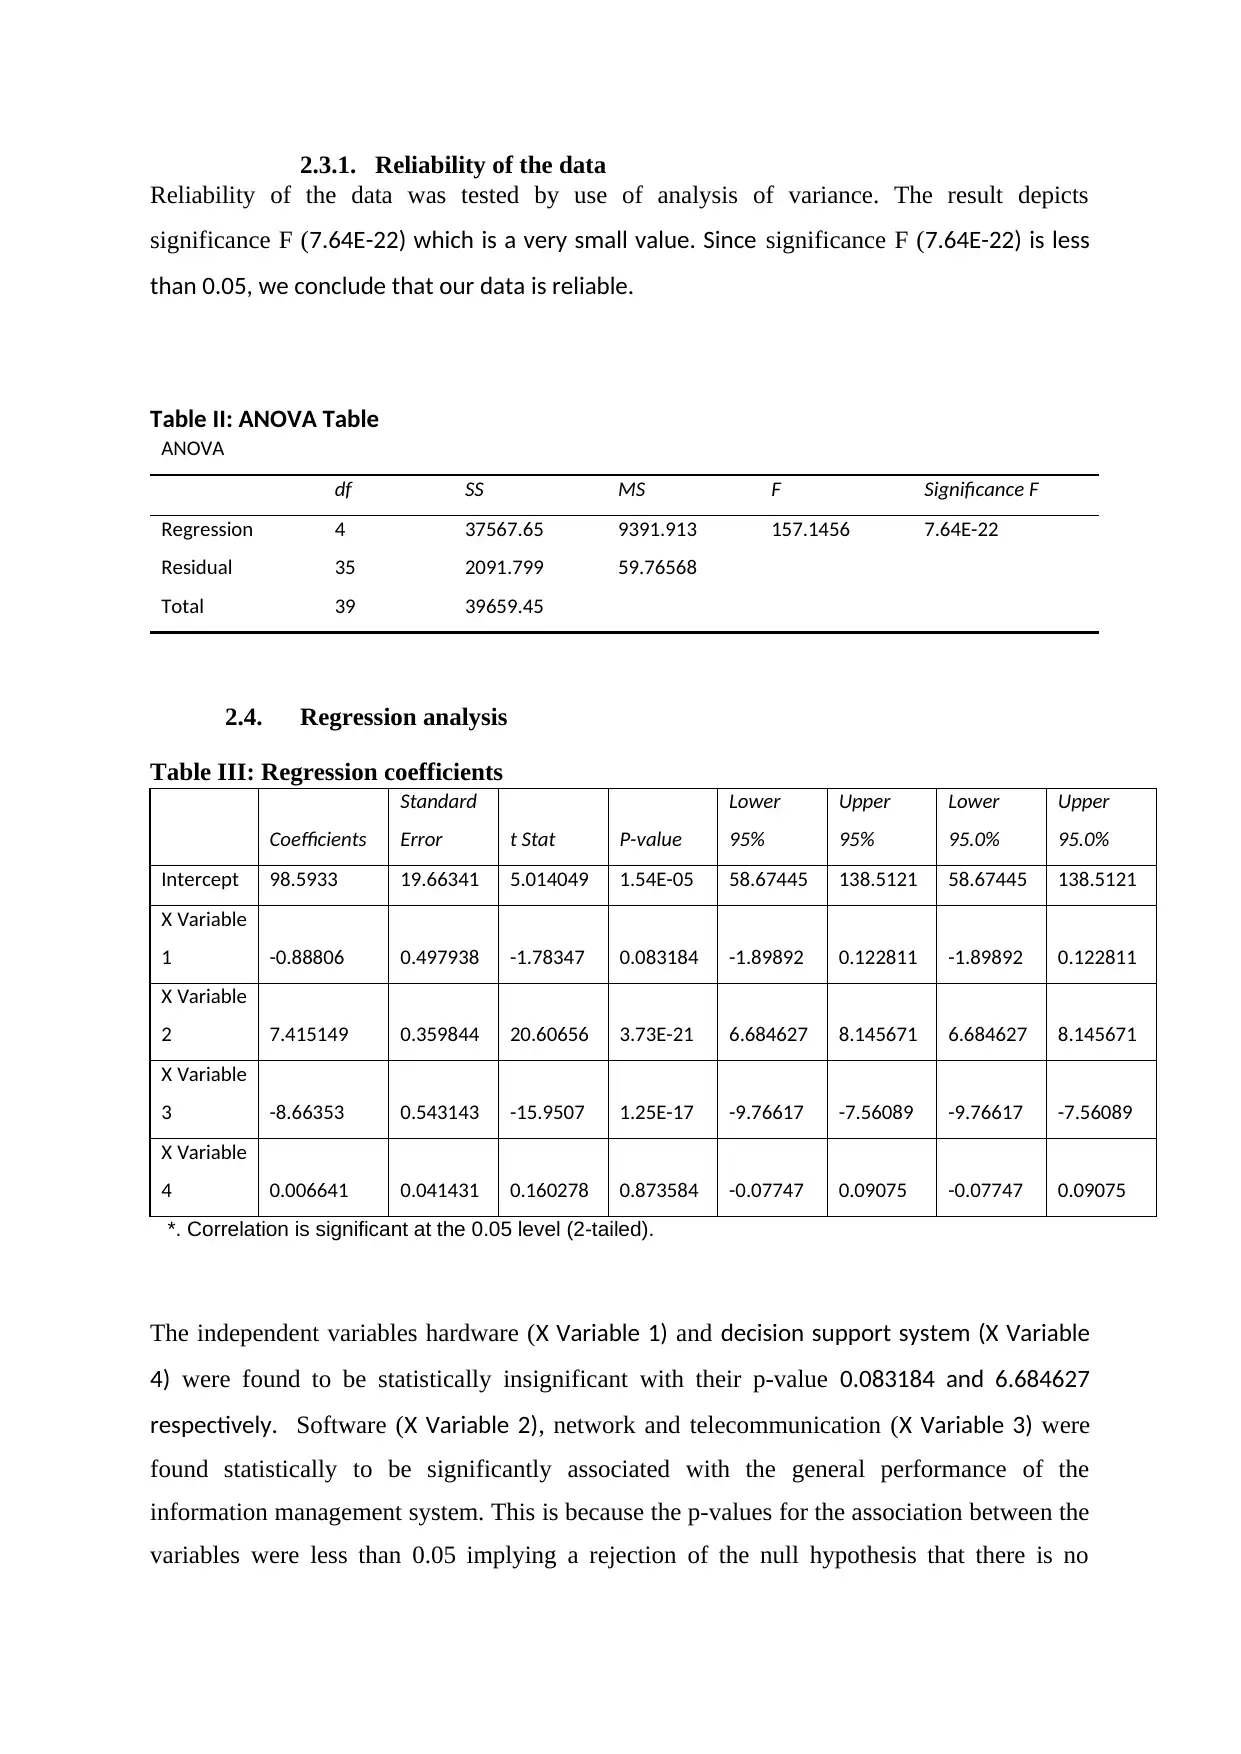
Reliability of the data was tested by use of analysis of variance. The result depicts
significance F (7.64E-22) which is a very small value. Since significance F (7.64E-22) is less
than 0.05, we conclude that our data is reliable.
Table II: ANOVA Table
ANOVA
df SS MS F Significance F
Regression 4 37567.65 9391.913 157.1456 7.64E-22
Residual 35 2091.799 59.76568
Total 39 39659.45
2.4. Regression analysis
Table III: Regression coefficients
Coefficients
Standard
Error t Stat P-value
Lower
95%
Upper
95%
Lower
95.0%
Upper
95.0%
Intercept 98.5933 19.66341 5.014049 1.54E-05 58.67445 138.5121 58.67445 138.5121
X Variable
1 -0.88806 0.497938 -1.78347 0.083184 -1.89892 0.122811 -1.89892 0.122811
X Variable
2 7.415149 0.359844 20.60656 3.73E-21 6.684627 8.145671 6.684627 8.145671
X Variable
3 -8.66353 0.543143 -15.9507 1.25E-17 -9.76617 -7.56089 -9.76617 -7.56089
X Variable
4 0.006641 0.041431 0.160278 0.873584 -0.07747 0.09075 -0.07747 0.09075
*. Correlation is significant at the 0.05 level (2-tailed).
The independent variables hardware (X Variable 1) and decision support system (X Variable
4) were found to be statistically insignificant with their p-value 0.083184 and 6.684627
respectively. Software (X Variable 2), network and telecommunication (X Variable 3) were
found statistically to be significantly associated with the general performance of the
information management system. This is because the p-values for the association between the
variables were less than 0.05 implying a rejection of the null hypothesis that there is no
association between the dependent and independent variables. Hardware and decision
support system depicts a negative association with the dependent variable while software and
network and telecommunication were positively associated with the general system
performance.
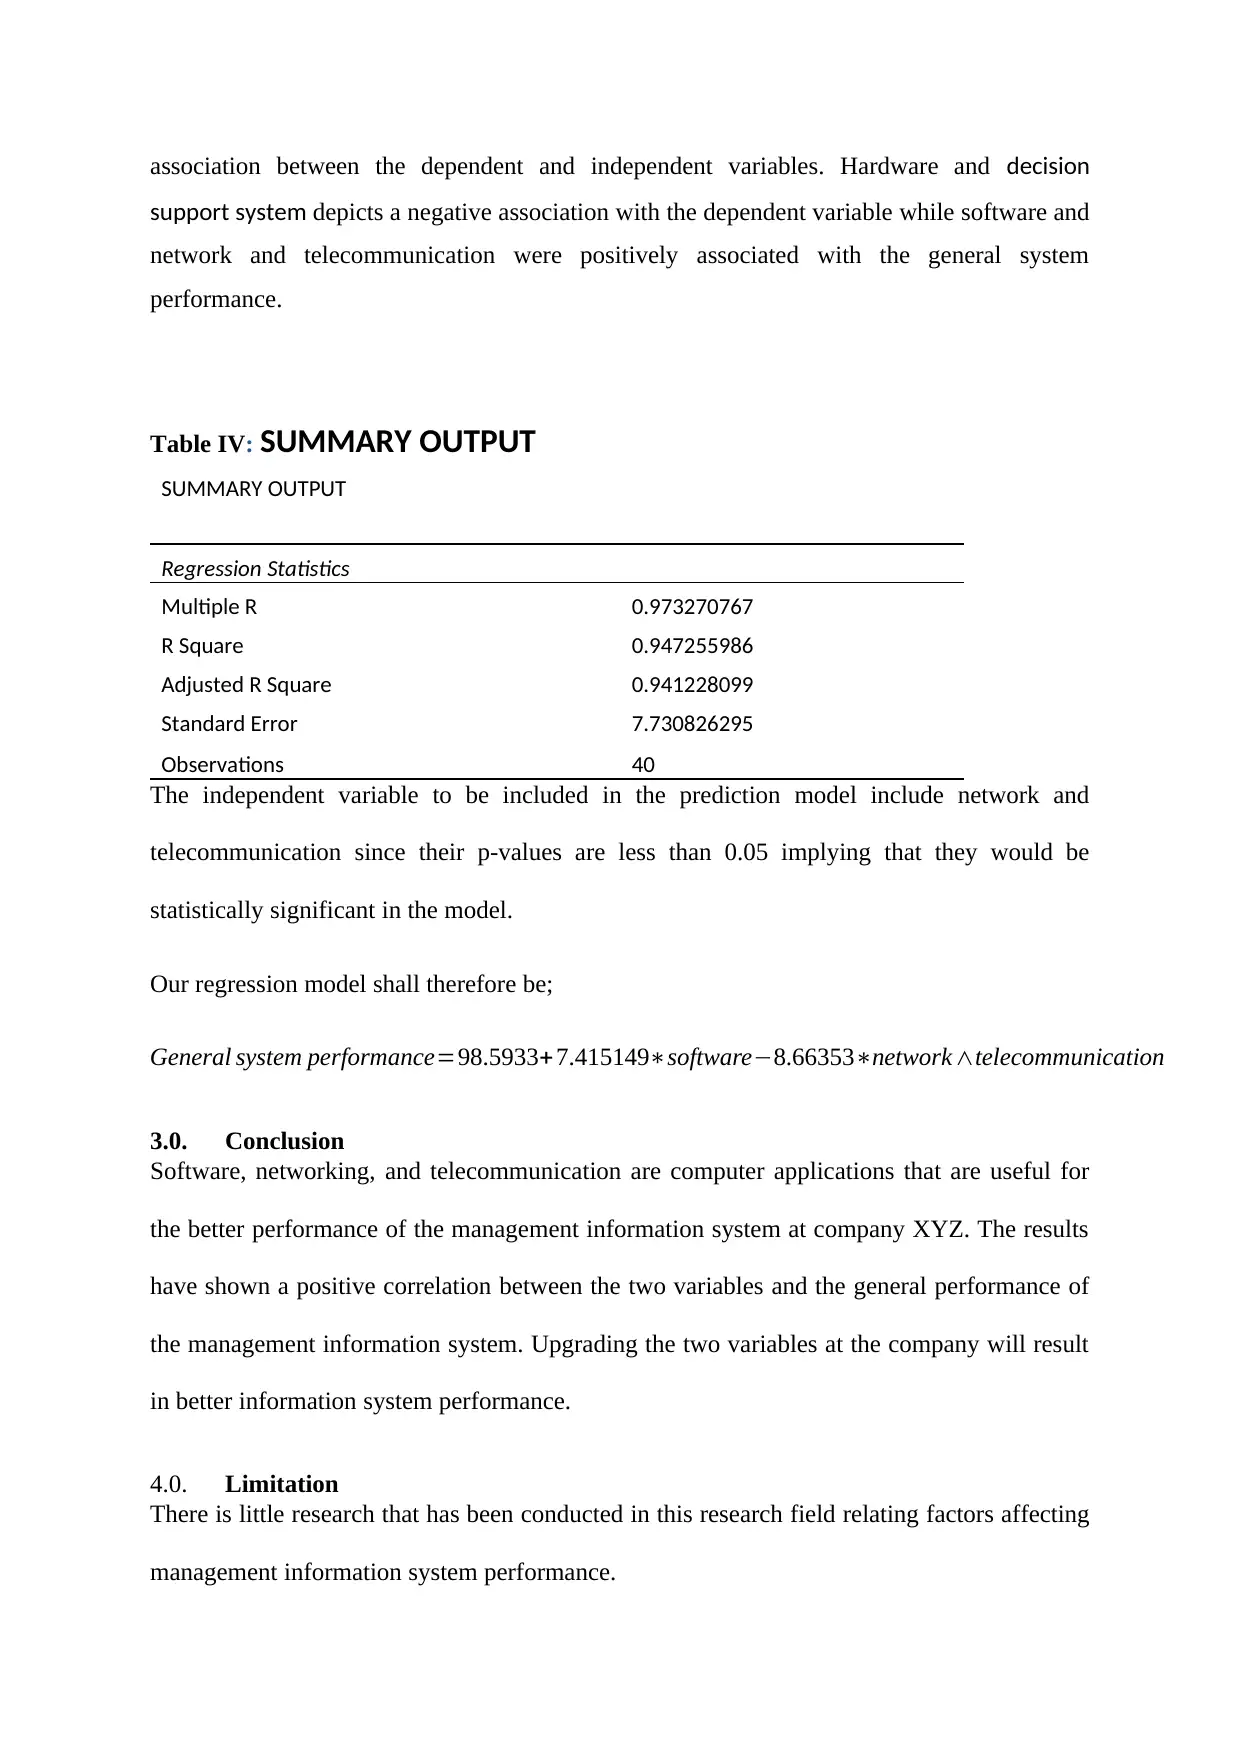
Table IV: SUMMARY OUTPUT
SUMMARY OUTPUT
Regression Statistics
Multiple R 0.973270767
R Square 0.947255986
Adjusted R Square 0.941228099
Standard Error 7.730826295
Observations 40
The independent variable to be included in the prediction model include network and
telecommunication since their p-values are less than 0.05 implying that they would be
statistically significant in the model.
Our regression model shall therefore be;
General system performance=98.5933+7.415149∗software−8.66353∗network∧telecommunication
3.0. Conclusion
Software, networking, and telecommunication are computer applications that are useful for
the better performance of the management information system at company XYZ. The results
have shown a positive correlation between the two variables and the general performance of
the management information system. Upgrading the two variables at the company will result
in better information system performance.
4.0. Limitation
There is little research that has been conducted in this research field relating factors affecting
management information system performance.
support system depicts a negative association with the dependent variable while software and
network and telecommunication were positively associated with the general system
performance.
Table IV: SUMMARY OUTPUT
SUMMARY OUTPUT
Regression Statistics
Multiple R 0.973270767
R Square 0.947255986
Adjusted R Square 0.941228099
Standard Error 7.730826295
Observations 40
The independent variable to be included in the prediction model include network and
telecommunication since their p-values are less than 0.05 implying that they would be
statistically significant in the model.
Our regression model shall therefore be;
General system performance=98.5933+7.415149∗software−8.66353∗network∧telecommunication
3.0. Conclusion
Software, networking, and telecommunication are computer applications that are useful for
the better performance of the management information system at company XYZ. The results
have shown a positive correlation between the two variables and the general performance of
the management information system. Upgrading the two variables at the company will result
in better information system performance.
4.0. Limitation
There is little research that has been conducted in this research field relating factors affecting
management information system performance.
⊘ This is a preview!⊘
Do you want full access?
Subscribe today to unlock all pages.
Trusted by 1+ million students worldwide
5.0. Recommendation
From the results of the analysis of this research, the following are the recommendation which
should be employed to increase the general performance of the management information
system.
i. The software is one of the important computer applications that company XYZ should
upgrade since the results correlate positively with the general performance of the
information management system.
ii. Company XYZ should put a greater concern should be put on telecommunication and
networking for better performance of the information management system.
Paraphrase This Document
Need a fresh take? Get an instant paraphrase of this document with our AI Paraphraser
6.0. References
Anisimova, L. (2009). Information management system. Improving quality management system in
conditions of the market globalization, 1(110), 30-39.
Chakraborty, M. C. (2019). Advances in Intelligent Systems and Computing. Proceedings of
International Ethical Hacking Conference 2018 Volume 811 (eHaCON 2018, Kolkata, India) ||
An Enhanced Post-migration Algorithm for Dynamic Load Balancing in Cloud Computing
Environment, 811, pp. 59-68. Kolkata, India.
GRISHKO. (2014). QUALITY MANAGEMENT SYSTEM. QUALITY MANAGEMENT SYSTEM AS A TOOL
FOR IMPROVING THE PERFORMANCE COMPANIES RAILWAYS(45), 64-72.
José R. Agustina, F. I. (2011). Computer Law & Security Review. Challenges before crime in a digital
era: Outsmarting cybercrime offenders – Workshop on Cybercrime, Computer Crime
Prevention and the Surveillance Society, 27(2), 2012-2021.
Squara, P. (2013). Systematic approach: an evidence management strategy for better decision-
making. Journal of Evidence-Based Medicine, 6(2), 109-117.
Stafford, T. P. (2010). Computer security threat. Online Security Threats and Computer User
Intentions, 43(1), 58-65.
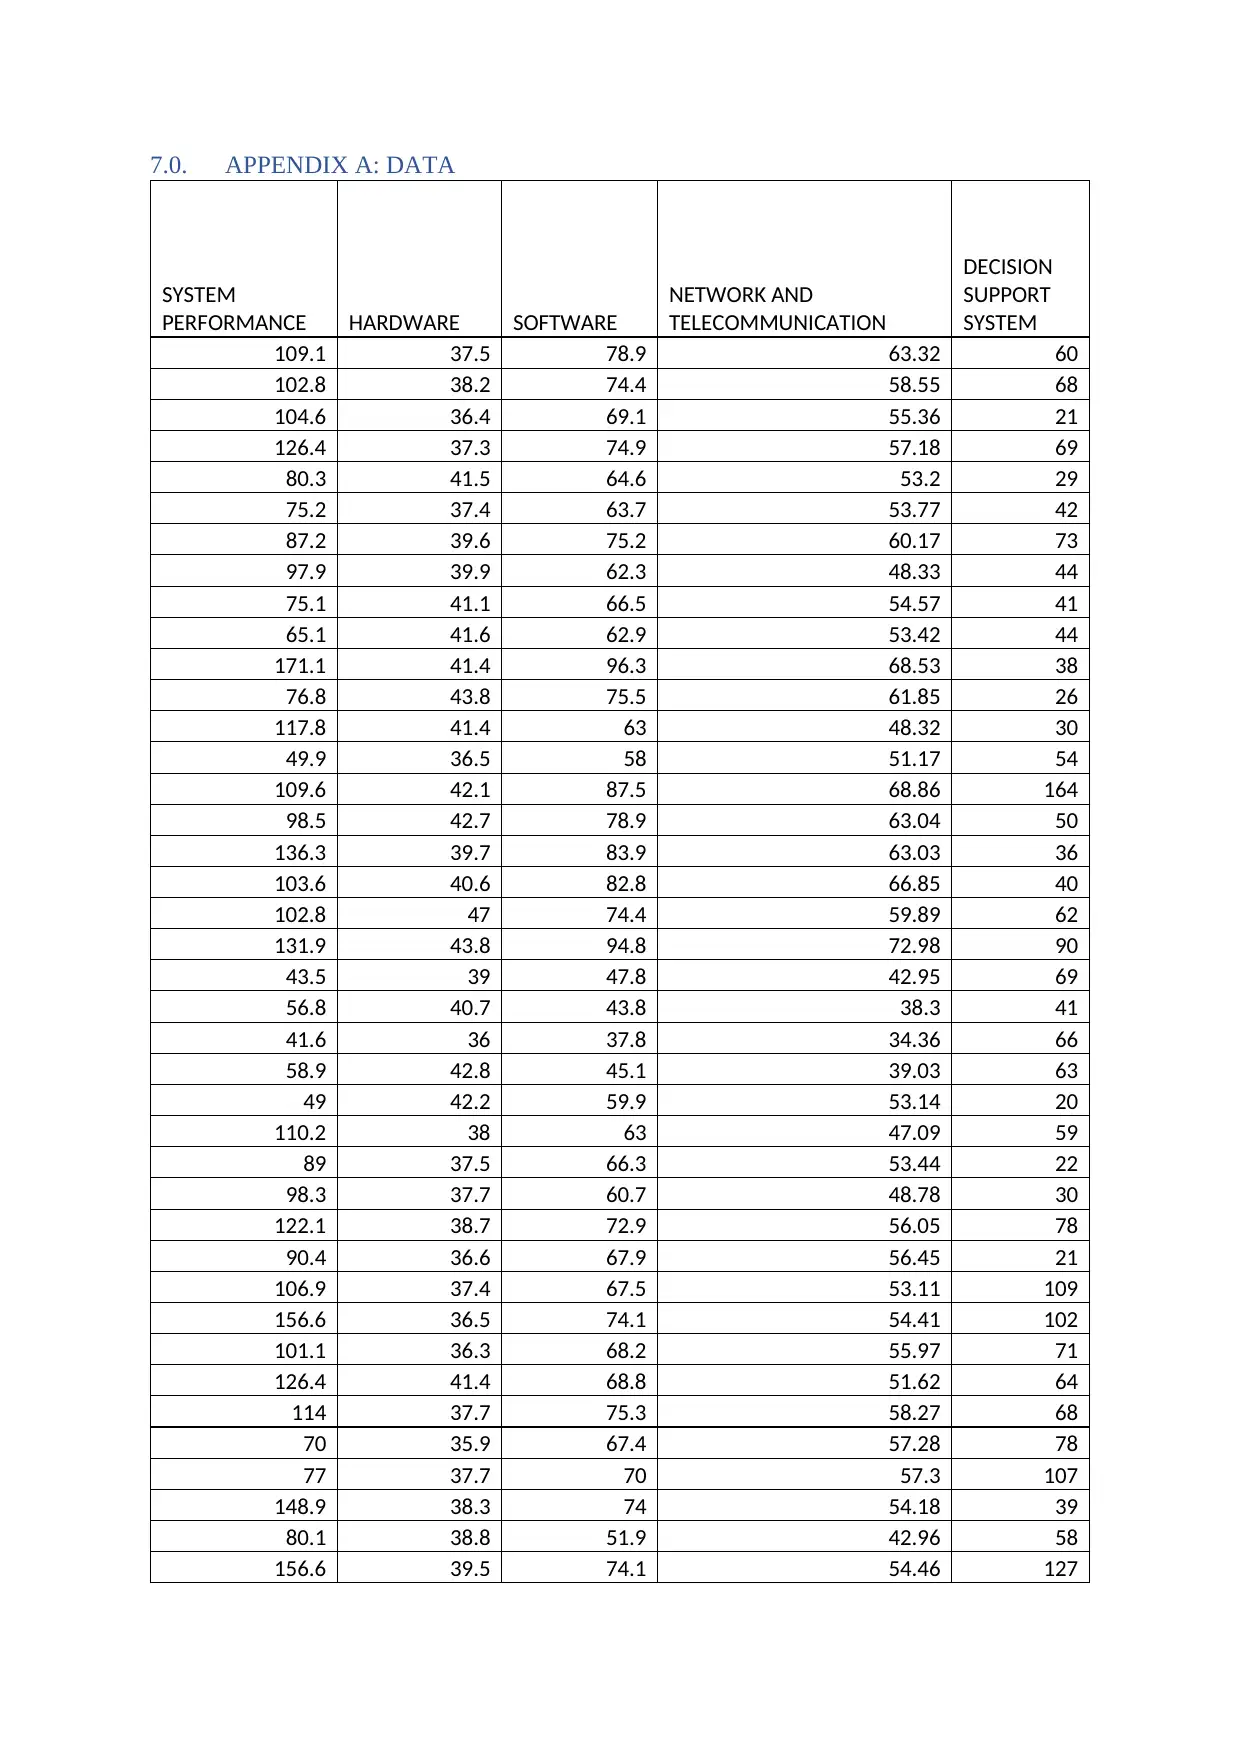
7.0. APPENDIX A: DATA
SYSTEM
PERFORMANCE HARDWARE SOFTWARE
NETWORK AND
TELECOMMUNICATION
DECISION
SUPPORT
SYSTEM
109.1 37.5 78.9 63.32 60
102.8 38.2 74.4 58.55 68
104.6 36.4 69.1 55.36 21
126.4 37.3 74.9 57.18 69
80.3 41.5 64.6 53.2 29
75.2 37.4 63.7 53.77 42
87.2 39.6 75.2 60.17 73
97.9 39.9 62.3 48.33 44
75.1 41.1 66.5 54.57 41
65.1 41.6 62.9 53.42 44
171.1 41.4 96.3 68.53 38
76.8 43.8 75.5 61.85 26
117.8 41.4 63 48.32 30
49.9 36.5 58 51.17 54
109.6 42.1 87.5 68.86 164
98.5 42.7 78.9 63.04 50
136.3 39.7 83.9 63.03 36
103.6 40.6 82.8 66.85 40
102.8 47 74.4 59.89 62
131.9 43.8 94.8 72.98 90
43.5 39 47.8 42.95 69
56.8 40.7 43.8 38.3 41
41.6 36 37.8 34.36 66
58.9 42.8 45.1 39.03 63
49 42.2 59.9 53.14 20
110.2 38 63 47.09 59
89 37.5 66.3 53.44 22
98.3 37.7 60.7 48.78 30
122.1 38.7 72.9 56.05 78
90.4 36.6 67.9 56.45 21
106.9 37.4 67.5 53.11 109
156.6 36.5 74.1 54.41 102
101.1 36.3 68.2 55.97 71
126.4 41.4 68.8 51.62 64
114 37.7 75.3 58.27 68
70 35.9 67.4 57.28 78
77 37.7 70 57.3 107
148.9 38.3 74 54.18 39
80.1 38.8 51.9 42.96 58
156.6 39.5 74.1 54.46 127
SYSTEM
PERFORMANCE HARDWARE SOFTWARE
NETWORK AND
TELECOMMUNICATION
DECISION
SUPPORT
SYSTEM
109.1 37.5 78.9 63.32 60
102.8 38.2 74.4 58.55 68
104.6 36.4 69.1 55.36 21
126.4 37.3 74.9 57.18 69
80.3 41.5 64.6 53.2 29
75.2 37.4 63.7 53.77 42
87.2 39.6 75.2 60.17 73
97.9 39.9 62.3 48.33 44
75.1 41.1 66.5 54.57 41
65.1 41.6 62.9 53.42 44
171.1 41.4 96.3 68.53 38
76.8 43.8 75.5 61.85 26
117.8 41.4 63 48.32 30
49.9 36.5 58 51.17 54
109.6 42.1 87.5 68.86 164
98.5 42.7 78.9 63.04 50
136.3 39.7 83.9 63.03 36
103.6 40.6 82.8 66.85 40
102.8 47 74.4 59.89 62
131.9 43.8 94.8 72.98 90
43.5 39 47.8 42.95 69
56.8 40.7 43.8 38.3 41
41.6 36 37.8 34.36 66
58.9 42.8 45.1 39.03 63
49 42.2 59.9 53.14 20
110.2 38 63 47.09 59
89 37.5 66.3 53.44 22
98.3 37.7 60.7 48.78 30
122.1 38.7 72.9 56.05 78
90.4 36.6 67.9 56.45 21
106.9 37.4 67.5 53.11 109
156.6 36.5 74.1 54.41 102
101.1 36.3 68.2 55.97 71
126.4 41.4 68.8 51.62 64
114 37.7 75.3 58.27 68
70 35.9 67.4 57.28 78
77 37.7 70 57.3 107
148.9 38.3 74 54.18 39
80.1 38.8 51.9 42.96 58
156.6 39.5 74.1 54.46 127
⊘ This is a preview!⊘
Do you want full access?
Subscribe today to unlock all pages.
Trusted by 1+ million students worldwide

1 out of 10
Related Documents


Your All-in-One AI-Powered Toolkit for Academic Success.
+13062052269
info@desklib.com
Available 24*7 on WhatsApp / Email
![[object Object]](/_next/static/media/star-bottom.7253800d.svg)
Unlock your academic potential
Copyright © 2020–2026 A2Z Services. All Rights Reserved. Developed and managed by ZUCOL.