SPSS Analysis of Factors Influencing Tax Compliance in the UAE
VerifiedAdded on 2023/06/14
|47
|7502
|248
Report
AI Summary
This report presents an analysis of factors affecting tax compliance intention in the UAE, based on a survey of 152 respondents. The demographic profile reveals a majority of female respondents, with most aged between 30-40 and holding bachelor's or master's degrees. Reliability tests, including Cronbach's alpha, confirm the internal consistency of the questionnaire. Factor analysis identifies key factors influencing tax compliance, and multiple regression analysis reveals the impact of tax-complying attitude, normative expectation, and perceived tax compliance control on tax compliance intention. The moderator variable also shows a statistically significant and positive impact. The report concludes by interpreting the regression coefficients and discussing the implications of the findings. The analysis was conducted using SPSS software, and the results are presented in tables and figures. Desklib offers similar solved assignments and past papers for students.
Results and Discussion
Demographic Profile of the respondents
Results shows that majority of the respondents are female and the proportion of male
comparatively less. Usually in the tax payer database male dominate female taxpayers. Similarly
the results from age distribution shows that 44 % of the respondents are in the age group of 30 -
40, followed by 32 % in 20 -30 age group. In terms of education level 51 5 have bachelor degree
followed by 47 % with master degree. Very less respondents have Phd degree and also the
respondents with only high school degree is also less. Around 58 % of the respondents are
studying accounts which means that people are trying to get the knowledge about the tax
compliance.
In terms of position in the most of the respondents are in the middle management followed by
high management and executive level. This shows that the respondents in the study are most
likely to be in the tax paying bracket. When asked about the TRN number 86 % of the
respondents said that they have TRN number which indicates most of the them pay their
tax, .Results from the tax registration type shows that most of them comes under company VAT
registration followed by legal person VAT registration. Results from turn over shows that
majority of the firms have turnover between 375000 and 1.5 million followed by 27 % having
turnover between 187000 and 375000. The detailed table and graph of the demographic profile
has been shown in the appendix 1.
2) Reliability test
For the current research the reliability test has been conducted to examine the internal
consistency of the questions included in the study. The reliability has been examined using the
Cronbach’s alpha. Since the questionnaire included the liker scale questions, it is considered to
be the most appropriate measure of reliability. In the current research the liker scale was set as
following:
1-Strongly Disagree/ Strongly Unlikely
5- Strongly Agree/Very Likely
Paraphrase This Document
Need a fresh take? Get an instant paraphrase of this document with our AI Paraphraser
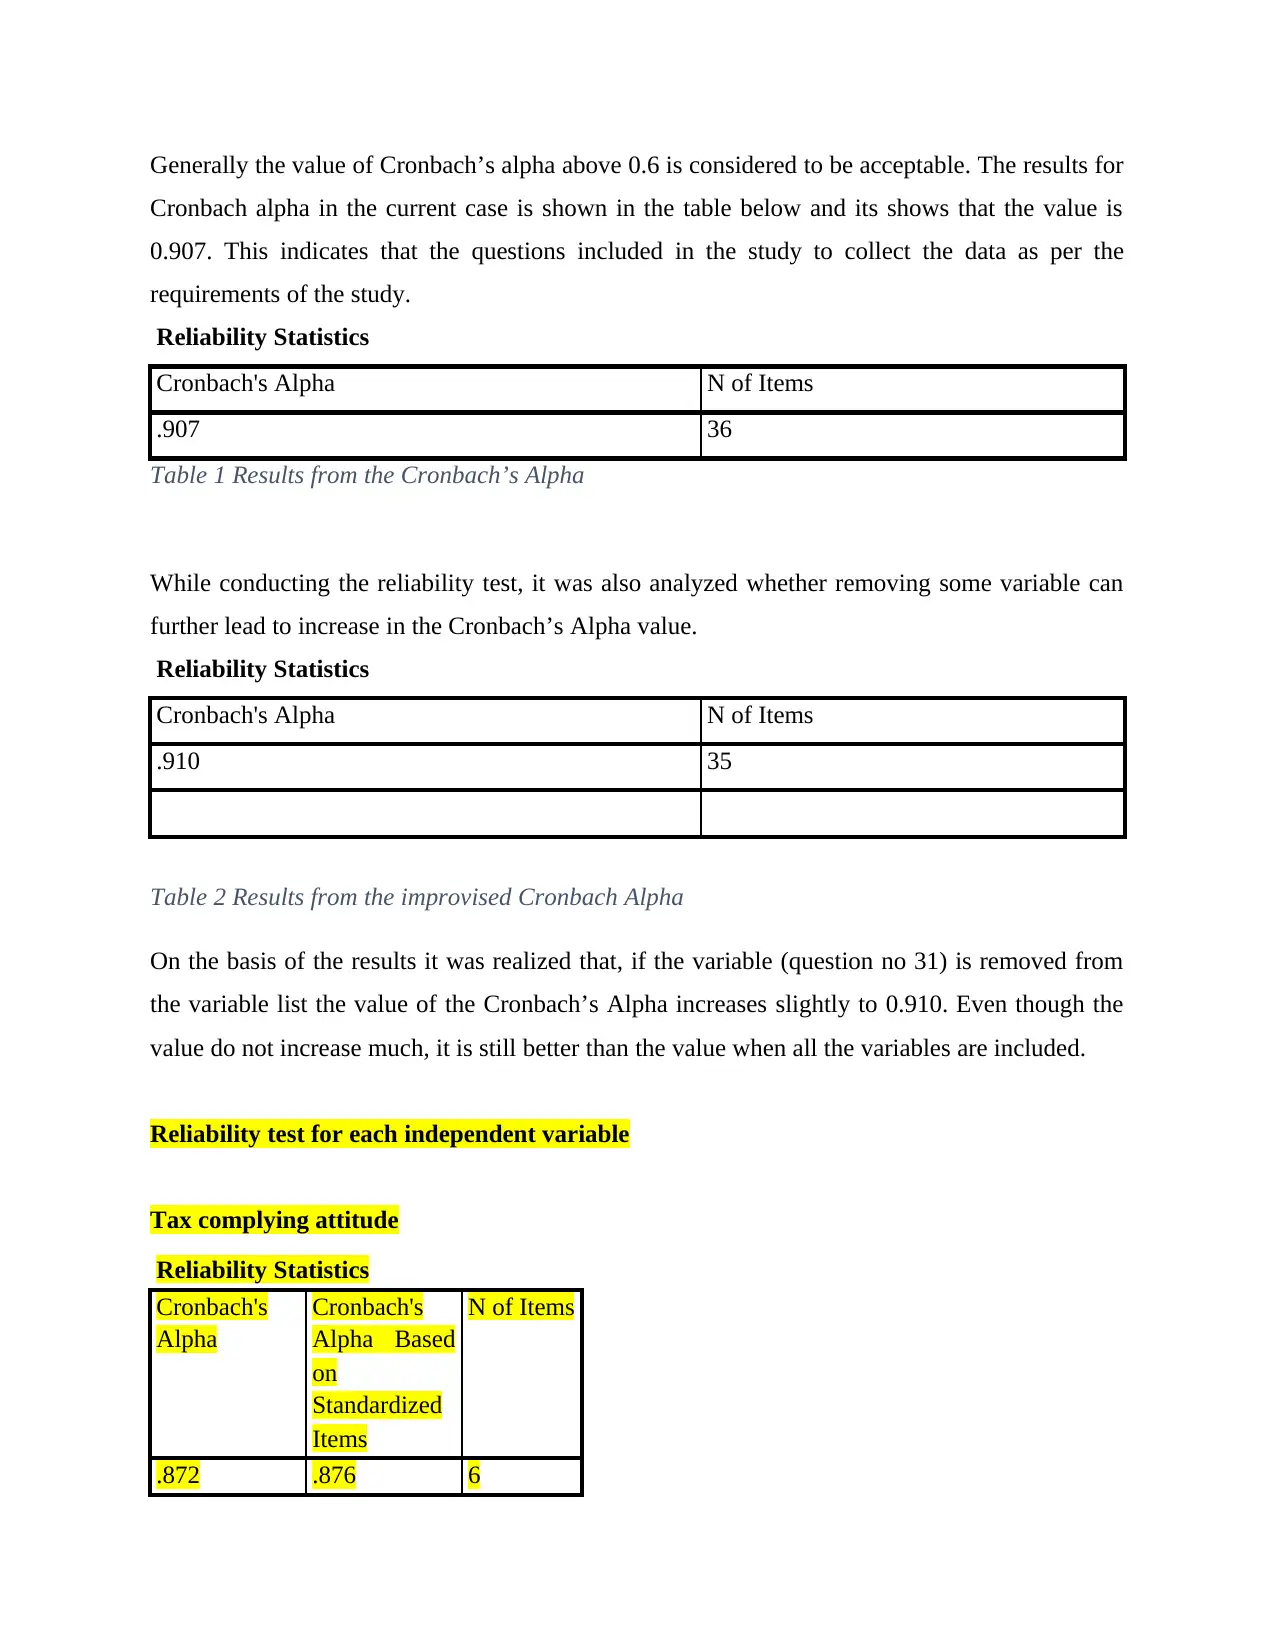
Generally the value of Cronbach’s alpha above 0.6 is considered to be acceptable. The results for
Cronbach alpha in the current case is shown in the table below and its shows that the value is
0.907. This indicates that the questions included in the study to collect the data as per the
requirements of the study.
Reliability Statistics
Cronbach's Alpha N of Items
.907 36
Table 1 Results from the Cronbach’s Alpha
While conducting the reliability test, it was also analyzed whether removing some variable can
further lead to increase in the Cronbach’s Alpha value.
Reliability Statistics
Cronbach's Alpha N of Items
.910 35
Table 2 Results from the improvised Cronbach Alpha
On the basis of the results it was realized that, if the variable (question no 31) is removed from
the variable list the value of the Cronbach’s Alpha increases slightly to 0.910. Even though the
value do not increase much, it is still better than the value when all the variables are included.
Reliability test for each independent variable
Tax complying attitude
Reliability Statistics
Cronbach's
Alpha
Cronbach's
Alpha Based
on
Standardized
Items
N of Items
.872 .876 6
Summary Item Statistics
Mean Minimu
m
Maximu
m
Range Maximum /
Minimum
Variance N of
Items
Item Means 4.200 4.013 4.450 .437 1.109 .040 6
Item
Variances
.807 .449 1.053 .604 2.345 .045 6
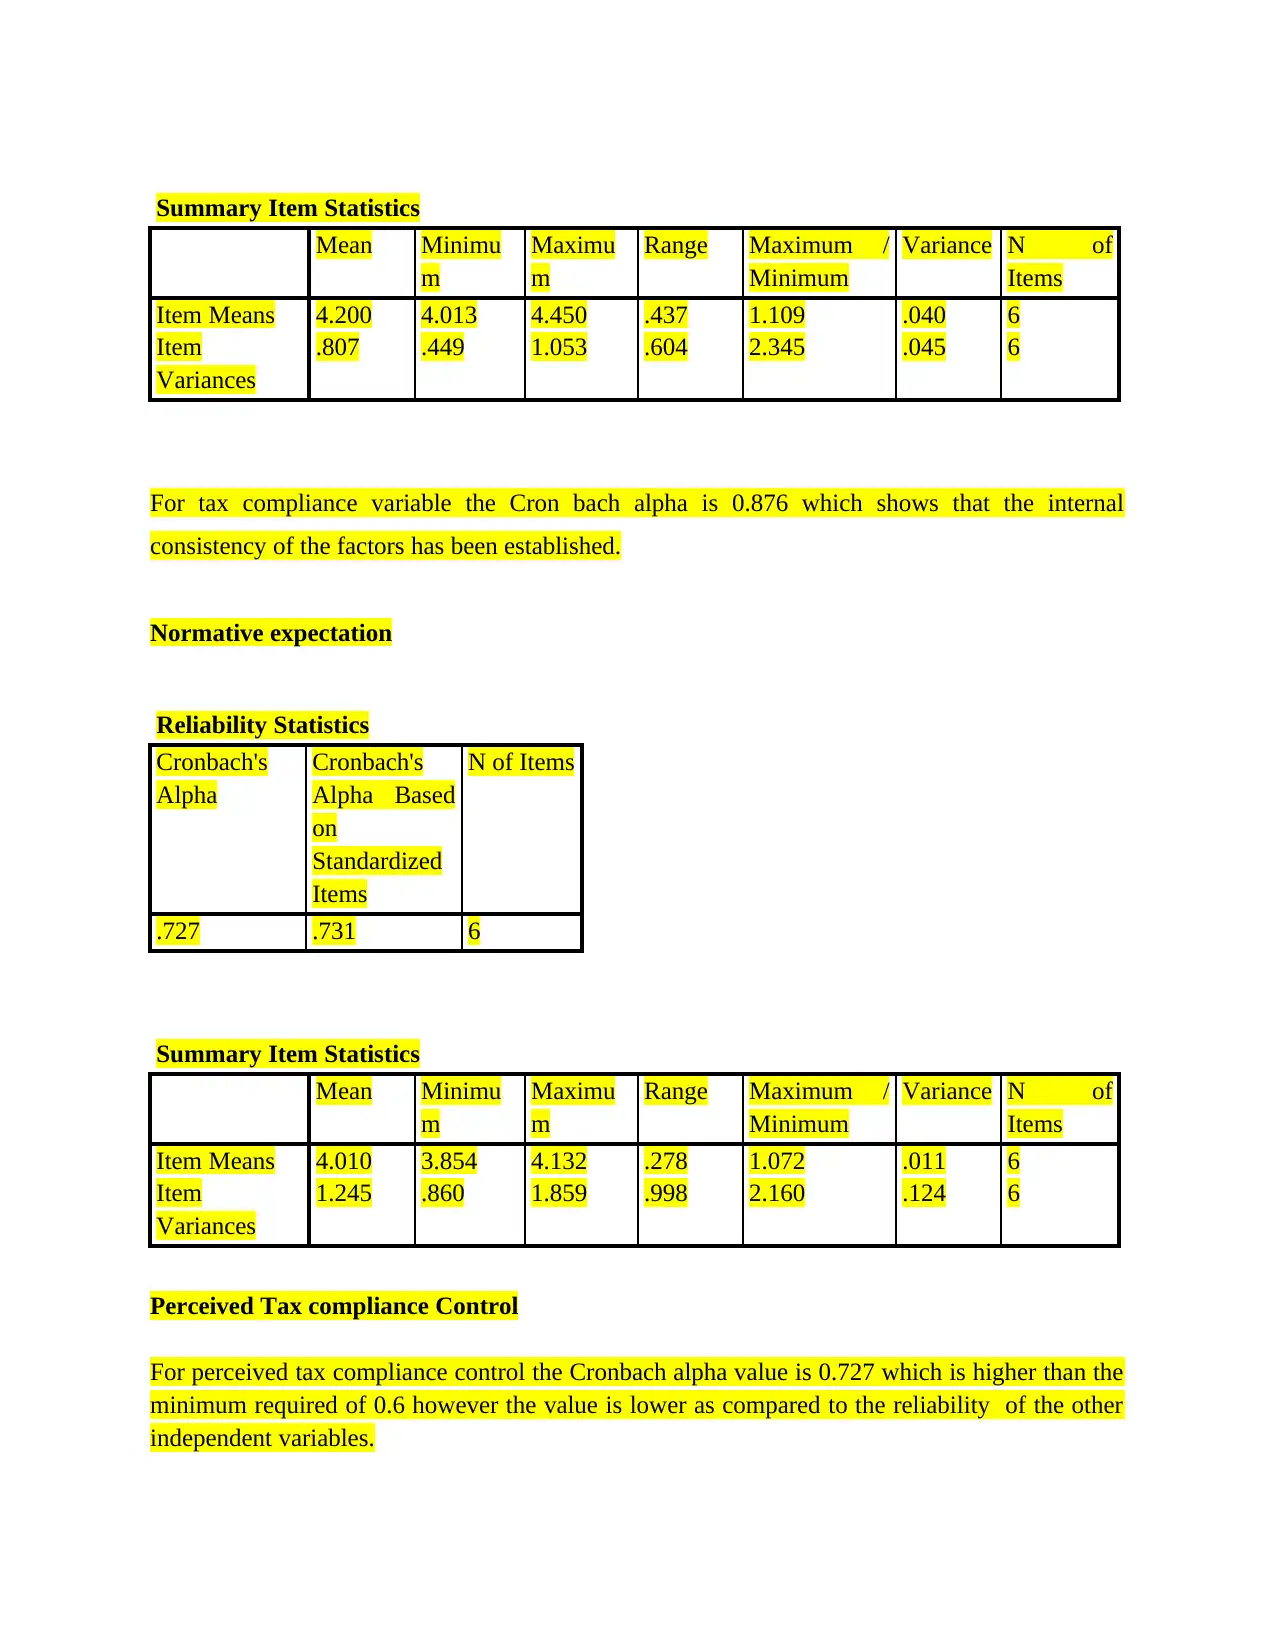
For tax compliance variable the Cron bach alpha is 0.876 which shows that the internal
consistency of the factors has been established.
Normative expectation
Reliability Statistics
Cronbach's
Alpha
Cronbach's
Alpha Based
on
Standardized
Items
N of Items
.727 .731 6
Summary Item Statistics
Mean Minimu
m
Maximu
m
Range Maximum /
Minimum
Variance N of
Items
Item Means 4.010 3.854 4.132 .278 1.072 .011 6
Item
Variances
1.245 .860 1.859 .998 2.160 .124 6
Perceived Tax compliance Control
For perceived tax compliance control the Cronbach alpha value is 0.727 which is higher than the
minimum required of 0.6 however the value is lower as compared to the reliability of the other
independent variables.
Mean Minimu
m
Maximu
m
Range Maximum /
Minimum
Variance N of
Items
Item Means 4.200 4.013 4.450 .437 1.109 .040 6
Item
Variances
.807 .449 1.053 .604 2.345 .045 6
For tax compliance variable the Cron bach alpha is 0.876 which shows that the internal
consistency of the factors has been established.
Normative expectation
Reliability Statistics
Cronbach's
Alpha
Cronbach's
Alpha Based
on
Standardized
Items
N of Items
.727 .731 6
Summary Item Statistics
Mean Minimu
m
Maximu
m
Range Maximum /
Minimum
Variance N of
Items
Item Means 4.010 3.854 4.132 .278 1.072 .011 6
Item
Variances
1.245 .860 1.859 .998 2.160 .124 6
Perceived Tax compliance Control
For perceived tax compliance control the Cronbach alpha value is 0.727 which is higher than the
minimum required of 0.6 however the value is lower as compared to the reliability of the other
independent variables.
⊘ This is a preview!⊘
Do you want full access?
Subscribe today to unlock all pages.
Trusted by 1+ million students worldwide
Reliability Statistics
Cronbach's
Alpha
Cronbach's
Alpha Based
on
Standardized
Items
N of Items
.896 .893 14
Summary Item Statistics
Mean Minimu
m
Maximu
m
Range Maximum /
Minimum
Variance N of
Items
Item Means 3.876 3.649 4.199 .550 1.151 .029 14
Item
Variances
1.126 .778 1.525 .747 1.960 .063 14
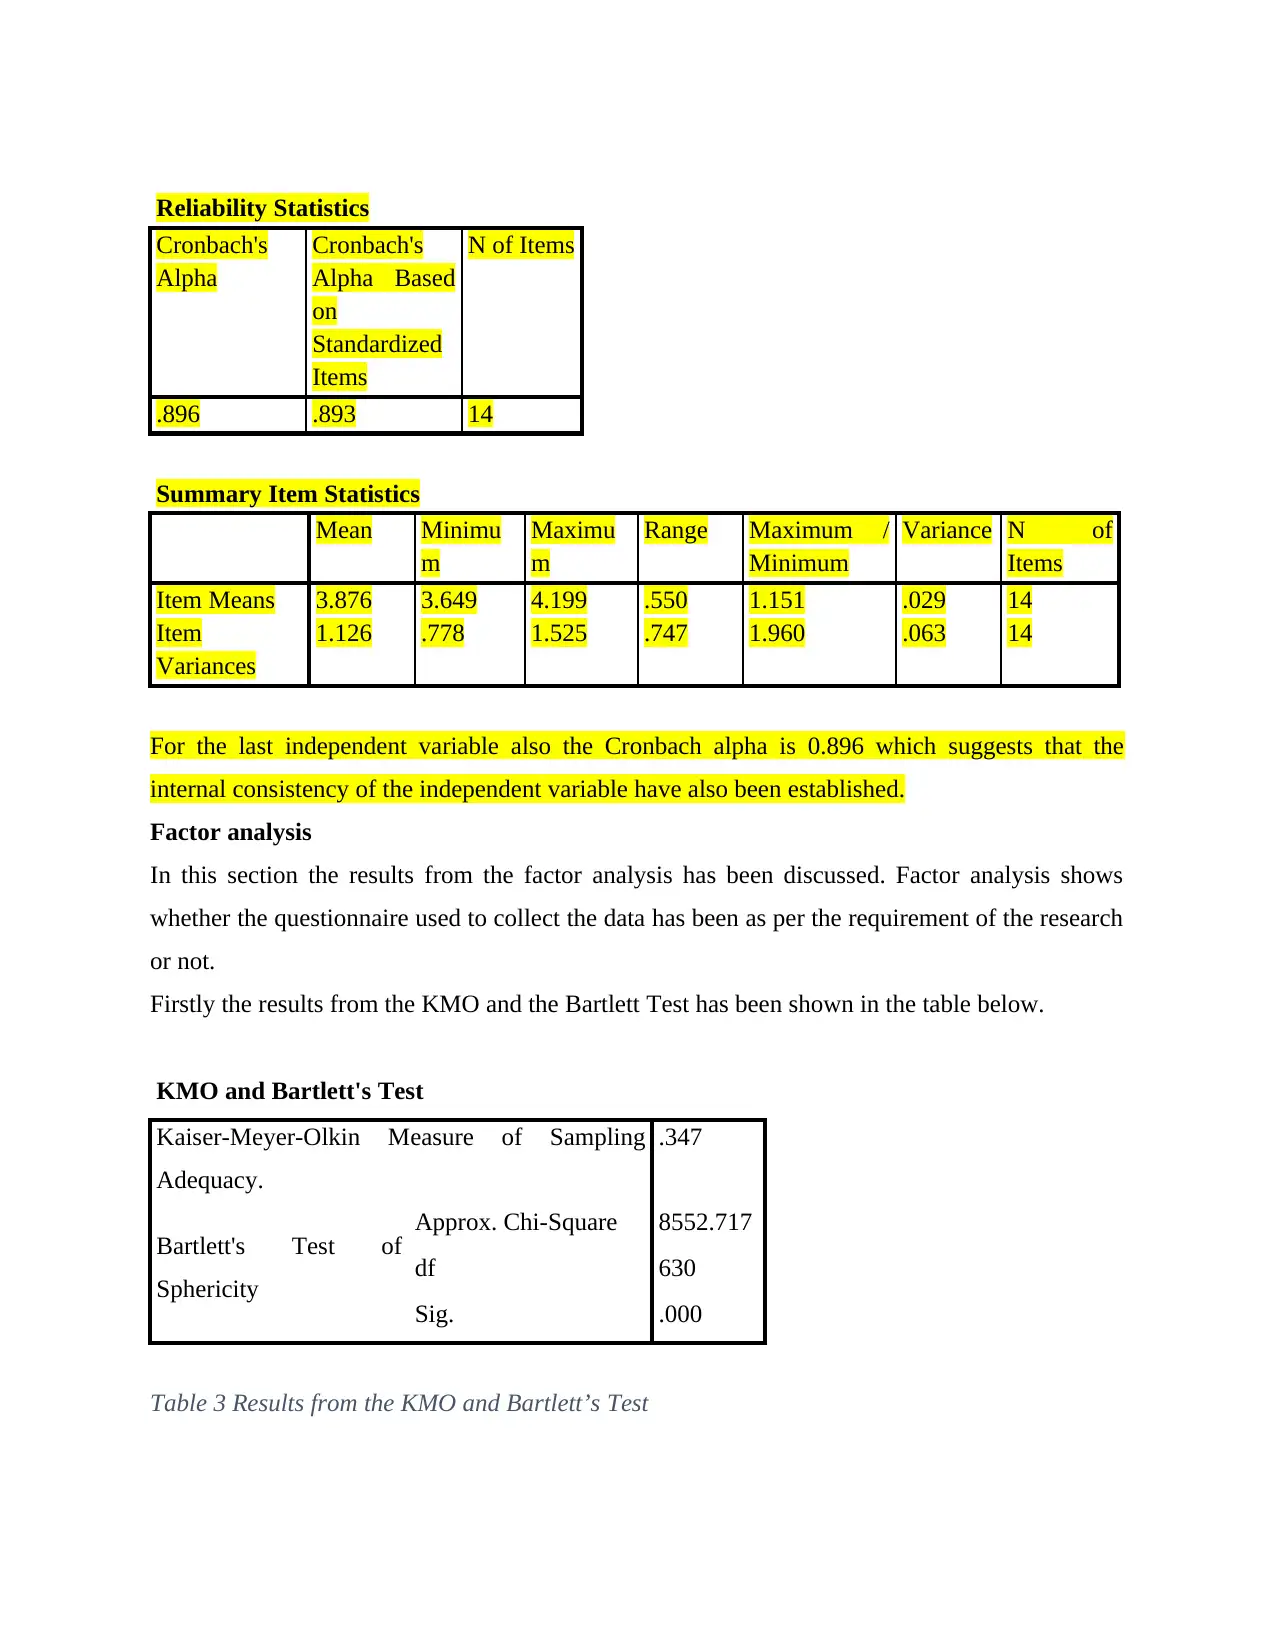
For the last independent variable also the Cronbach alpha is 0.896 which suggests that the
internal consistency of the independent variable have also been established.
Factor analysis
In this section the results from the factor analysis has been discussed. Factor analysis shows
whether the questionnaire used to collect the data has been as per the requirement of the research
or not.
Firstly the results from the KMO and the Bartlett Test has been shown in the table below.
KMO and Bartlett's Test
Kaiser-Meyer-Olkin Measure of Sampling
Adequacy.
.347
Bartlett's Test of
Sphericity
Approx. Chi-Square 8552.717
df 630
Sig. .000
Table 3 Results from the KMO and Bartlett’s Test
Cronbach's
Alpha
Cronbach's
Alpha Based
on
Standardized
Items
N of Items
.896 .893 14
Summary Item Statistics
Mean Minimu
m
Maximu
m
Range Maximum /
Minimum
Variance N of
Items
Item Means 3.876 3.649 4.199 .550 1.151 .029 14
Item
Variances
1.126 .778 1.525 .747 1.960 .063 14
For the last independent variable also the Cronbach alpha is 0.896 which suggests that the
internal consistency of the independent variable have also been established.
Factor analysis
In this section the results from the factor analysis has been discussed. Factor analysis shows
whether the questionnaire used to collect the data has been as per the requirement of the research
or not.
Firstly the results from the KMO and the Bartlett Test has been shown in the table below.
KMO and Bartlett's Test
Kaiser-Meyer-Olkin Measure of Sampling
Adequacy.
.347
Bartlett's Test of
Sphericity
Approx. Chi-Square 8552.717
df 630
Sig. .000
Table 3 Results from the KMO and Bartlett’s Test
Paraphrase This Document
Need a fresh take? Get an instant paraphrase of this document with our AI Paraphraser
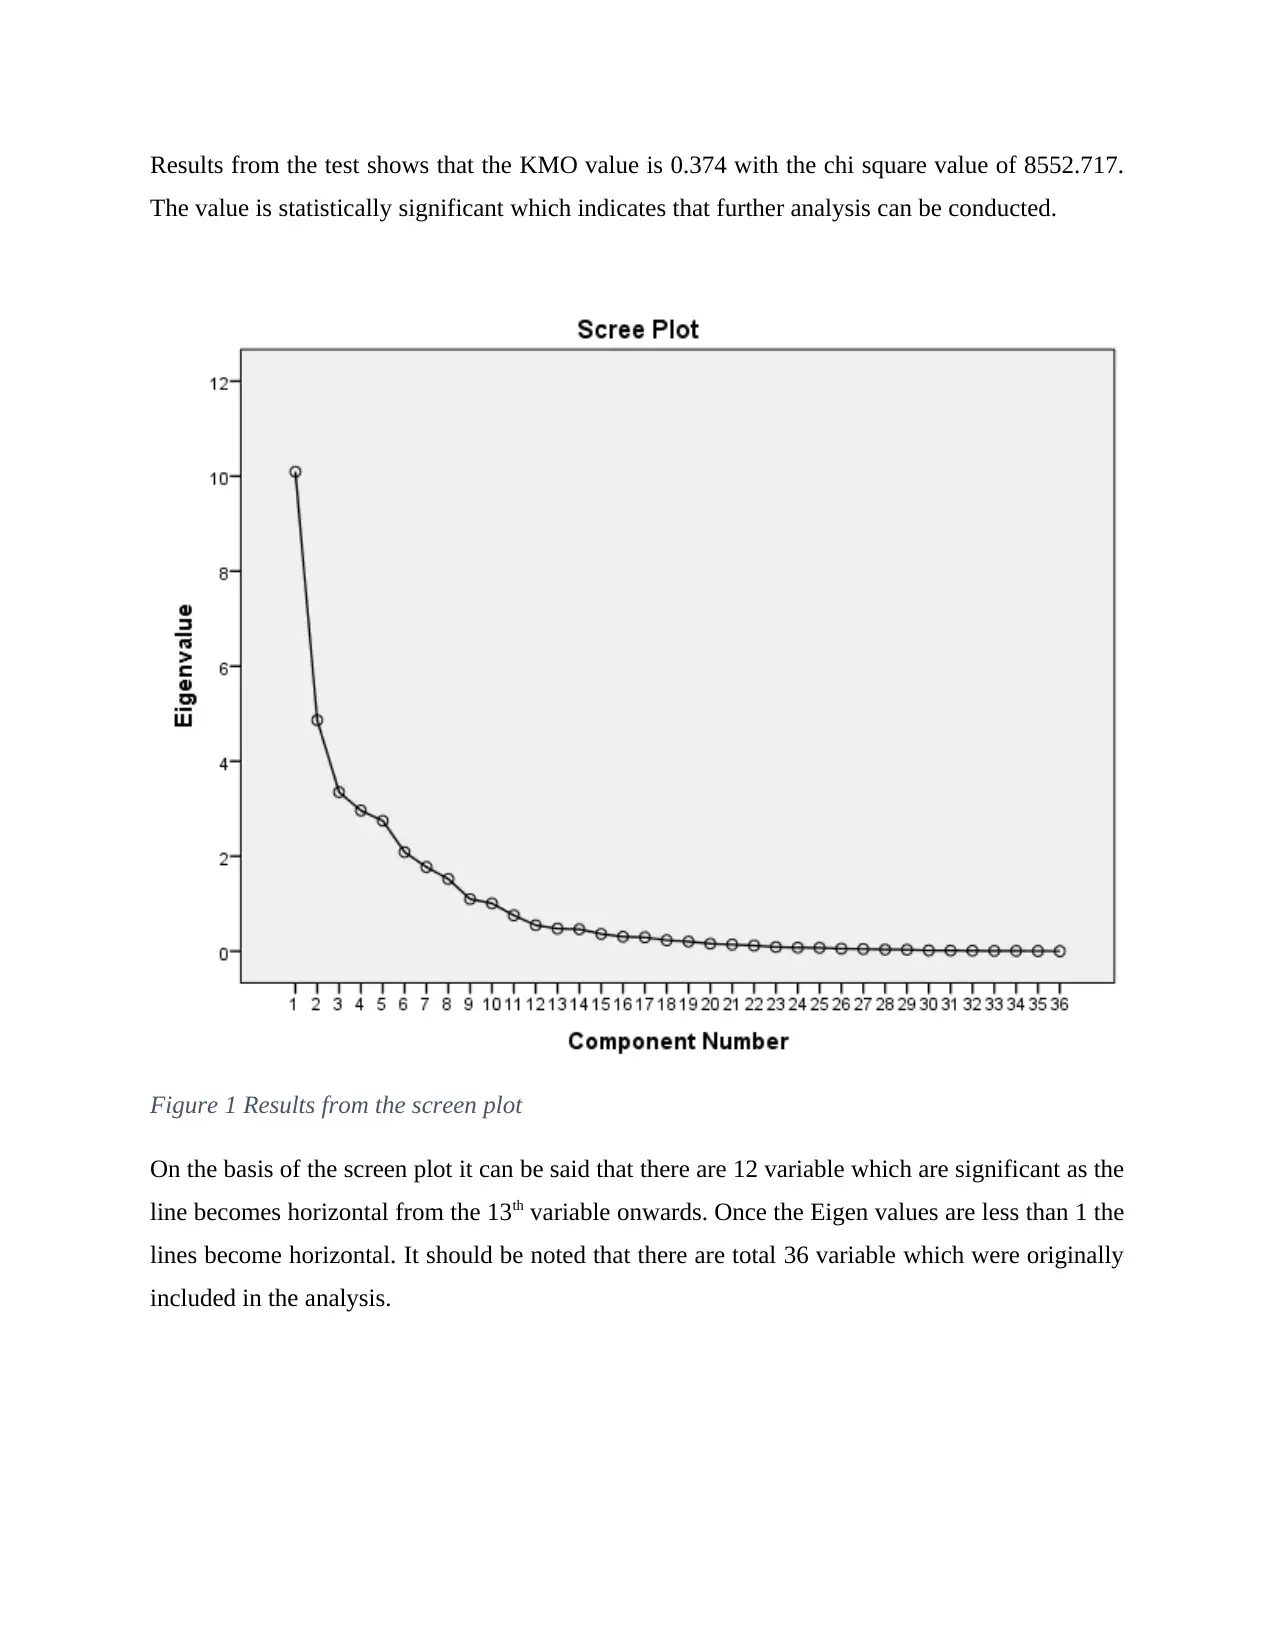
Results from the test shows that the KMO value is 0.374 with the chi square value of 8552.717.
The value is statistically significant which indicates that further analysis can be conducted.
Figure 1 Results from the screen plot
On the basis of the screen plot it can be said that there are 12 variable which are significant as the
line becomes horizontal from the 13th variable onwards. Once the Eigen values are less than 1 the
lines become horizontal. It should be noted that there are total 36 variable which were originally
included in the analysis.
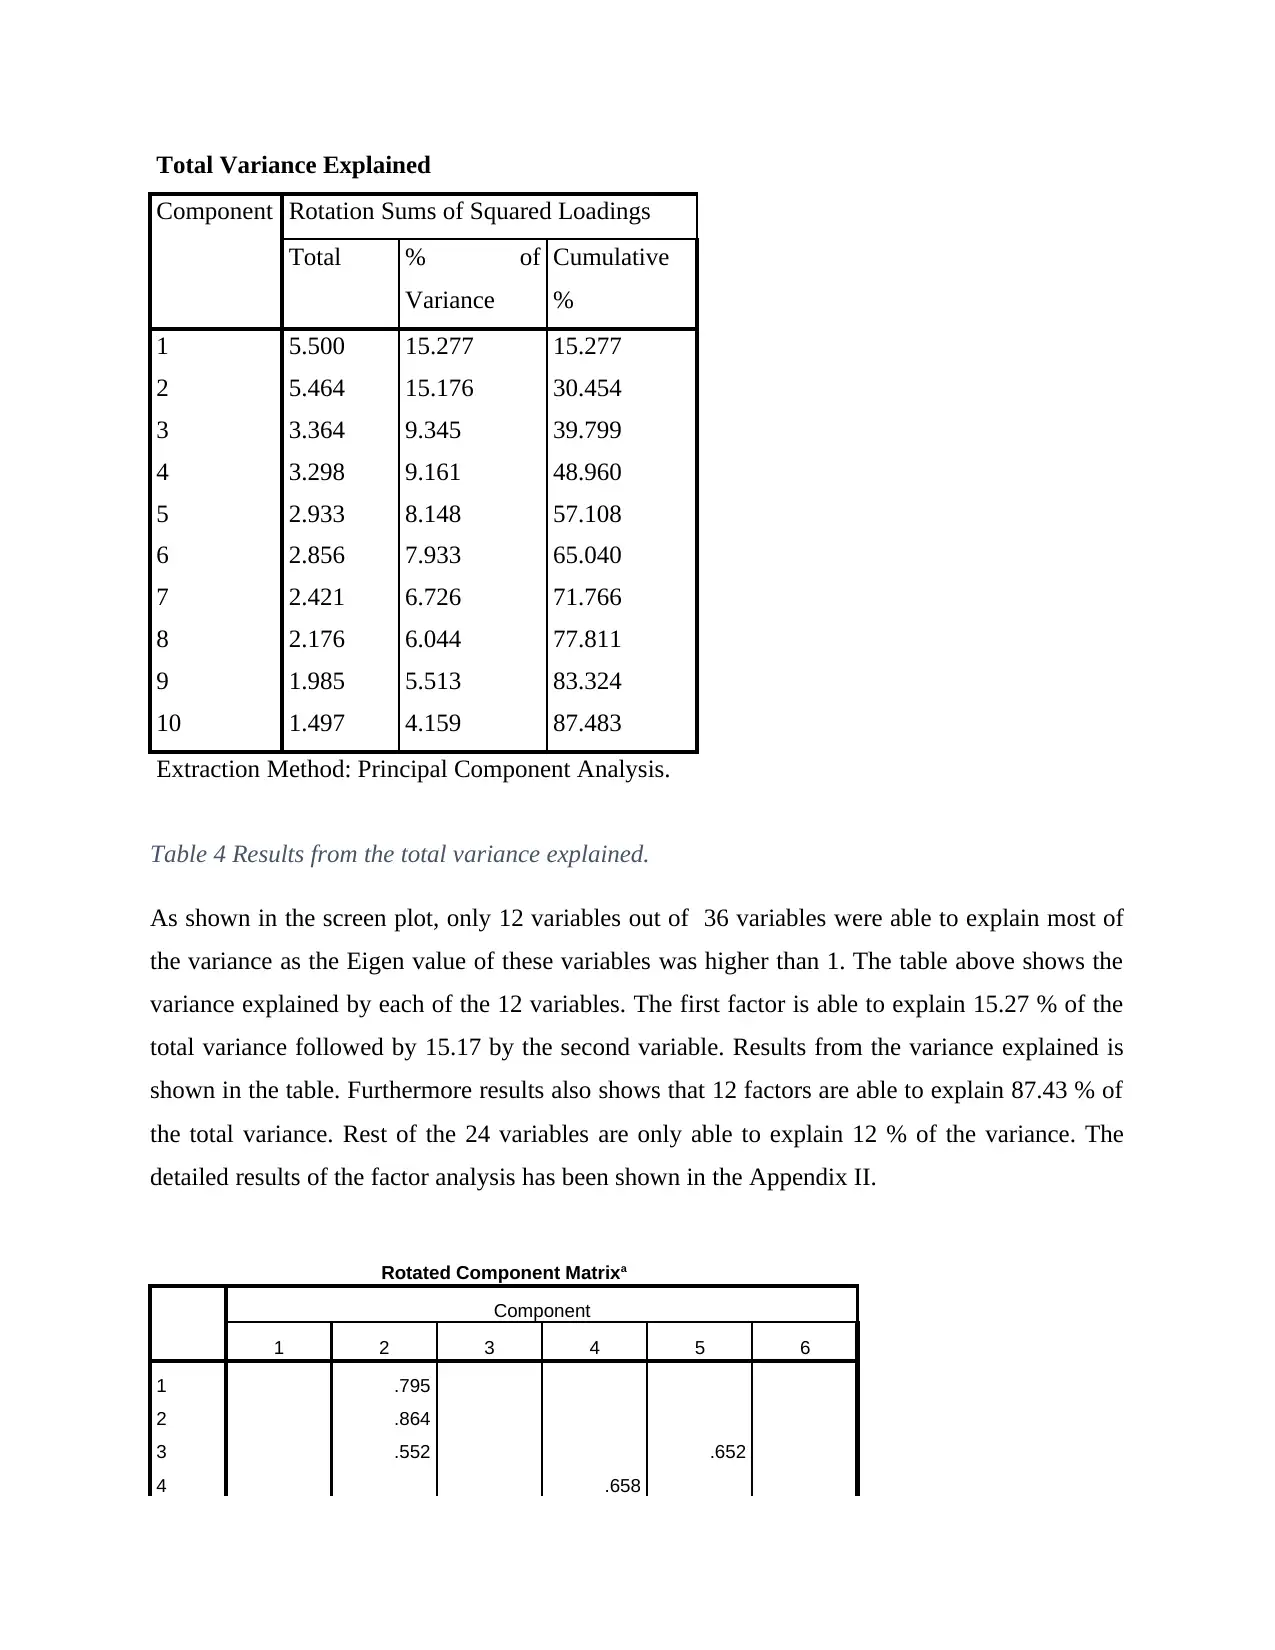
Total Variance Explained
Component Rotation Sums of Squared Loadings
Total % of
Variance
Cumulative
%
1 5.500 15.277 15.277
2 5.464 15.176 30.454
3 3.364 9.345 39.799
4 3.298 9.161 48.960
5 2.933 8.148 57.108
6 2.856 7.933 65.040
7 2.421 6.726 71.766
8 2.176 6.044 77.811
9 1.985 5.513 83.324
10 1.497 4.159 87.483
Extraction Method: Principal Component Analysis.
Table 4 Results from the total variance explained.
As shown in the screen plot, only 12 variables out of 36 variables were able to explain most of
the variance as the Eigen value of these variables was higher than 1. The table above shows the
variance explained by each of the 12 variables. The first factor is able to explain 15.27 % of the
total variance followed by 15.17 by the second variable. Results from the variance explained is
shown in the table. Furthermore results also shows that 12 factors are able to explain 87.43 % of
the total variance. Rest of the 24 variables are only able to explain 12 % of the variance. The
detailed results of the factor analysis has been shown in the Appendix II.
Rotated Component Matrixa
Component
1 2 3 4 5 6
1 .795
2 .864
3 .552 .652
4 .658
⊘ This is a preview!⊘
Do you want full access?
Subscribe today to unlock all pages.
Trusted by 1+ million students worldwide
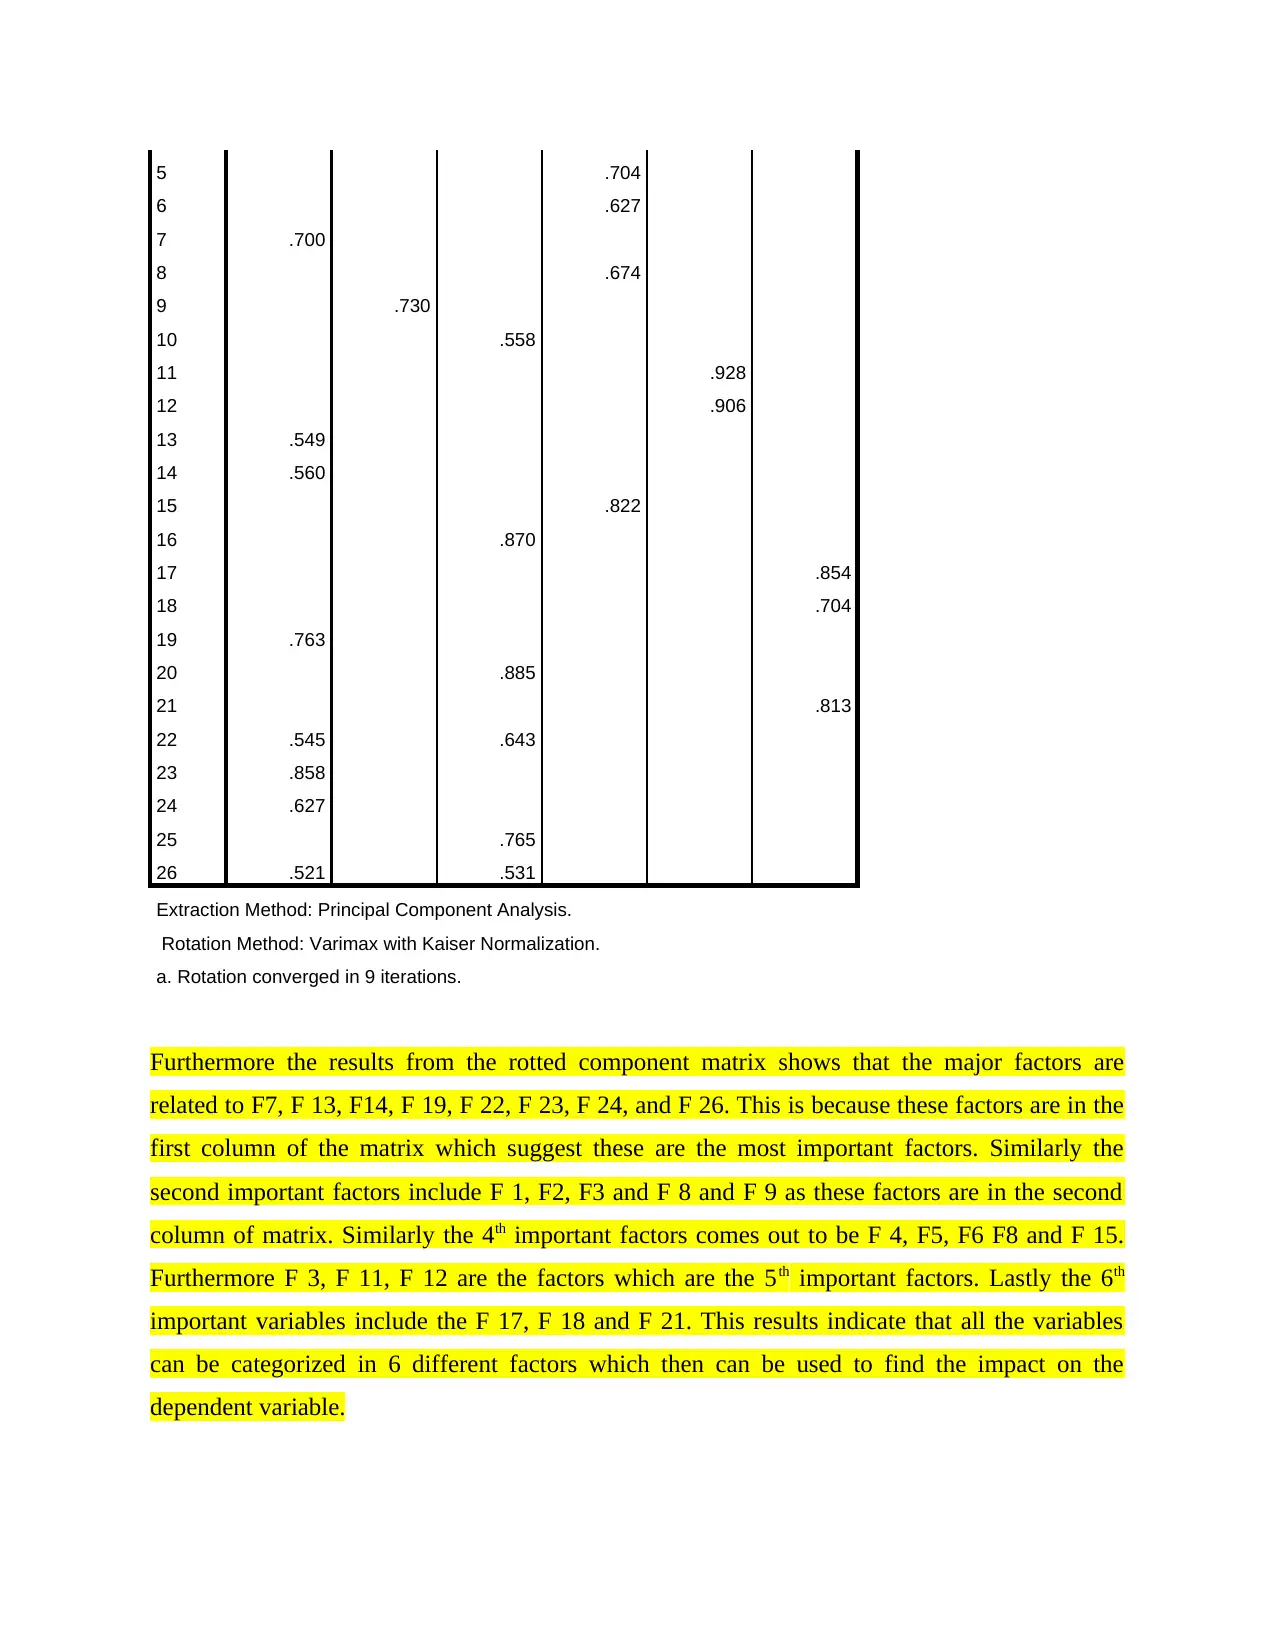
5 .704
6 .627
7 .700
8 .674
9 .730
10 .558
11 .928
12 .906
13 .549
14 .560
15 .822
16 .870
17 .854
18 .704
19 .763
20 .885
21 .813
22 .545 .643
23 .858
24 .627
25 .765
26 .521 .531
Extraction Method: Principal Component Analysis.
Rotation Method: Varimax with Kaiser Normalization.
a. Rotation converged in 9 iterations.
Furthermore the results from the rotted component matrix shows that the major factors are
related to F7, F 13, F14, F 19, F 22, F 23, F 24, and F 26. This is because these factors are in the
first column of the matrix which suggest these are the most important factors. Similarly the
second important factors include F 1, F2, F3 and F 8 and F 9 as these factors are in the second
column of matrix. Similarly the 4th important factors comes out to be F 4, F5, F6 F8 and F 15.
Furthermore F 3, F 11, F 12 are the factors which are the 5th important factors. Lastly the 6th
important variables include the F 17, F 18 and F 21. This results indicate that all the variables
can be categorized in 6 different factors which then can be used to find the impact on the
dependent variable.
Paraphrase This Document
Need a fresh take? Get an instant paraphrase of this document with our AI Paraphraser
Multiple regression analysis
The regression analysis is has been performed to find the impact of the independent variables on
the dependent variable. The impact is decided on the basis of the regression coefficient of the
independent. If the coefficient is positive then the independent variable have positive and if the
regression coefficient is negative then the impact is also negative. For the current research the
dependent and the independent variables are as follows:
Dependent variable:
Tax compliance intention
Independent variable:
Tax complying attitude
Normative expectation
Perceived Tax compliance Control
Moderator variable:
Perceived Tax compliance Control * tax compliance intention
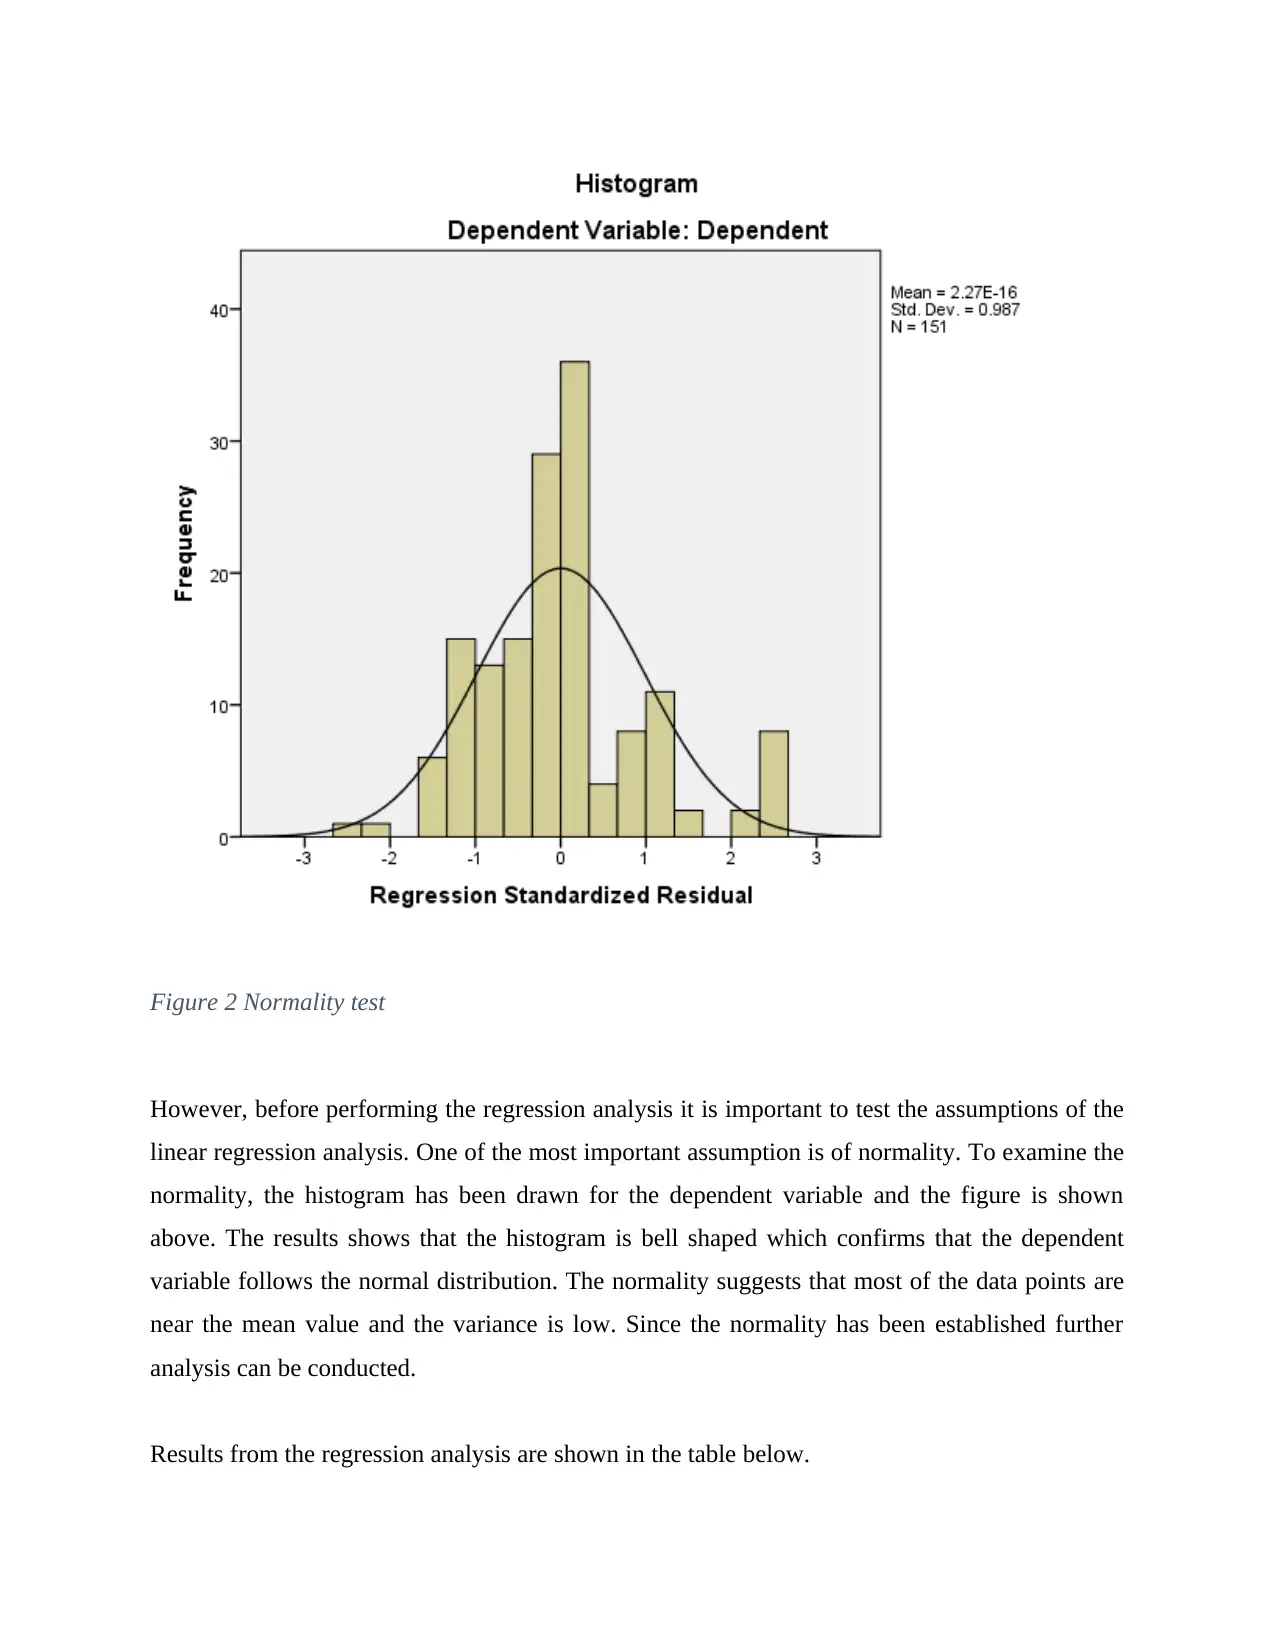
Figure 2 Normality test
However, before performing the regression analysis it is important to test the assumptions of the
linear regression analysis. One of the most important assumption is of normality. To examine the
normality, the histogram has been drawn for the dependent variable and the figure is shown
above. The results shows that the histogram is bell shaped which confirms that the dependent
variable follows the normal distribution. The normality suggests that most of the data points are
near the mean value and the variance is low. Since the normality has been established further
analysis can be conducted.
Results from the regression analysis are shown in the table below.
⊘ This is a preview!⊘
Do you want full access?
Subscribe today to unlock all pages.
Trusted by 1+ million students worldwide
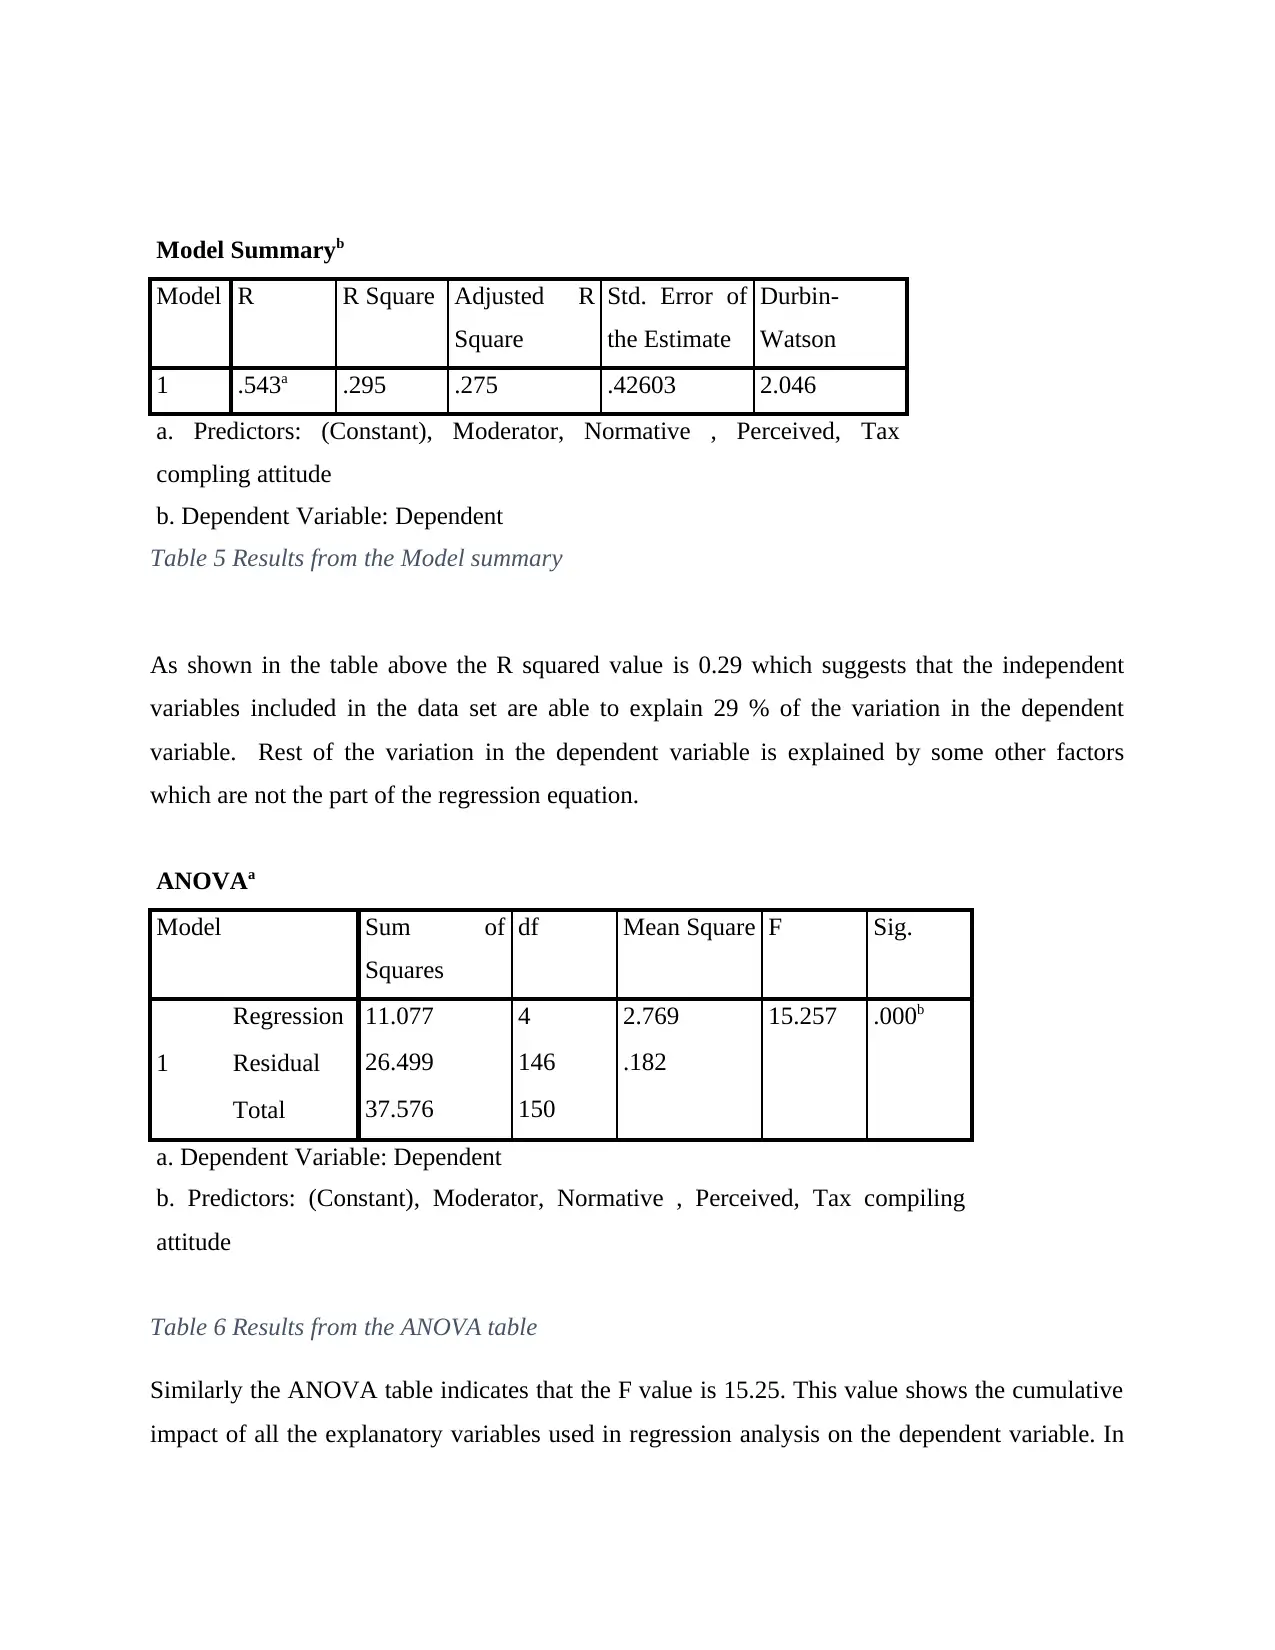
Model Summaryb
Model R R Square Adjusted R
Square
Std. Error of
the Estimate
Durbin-
Watson
1 .543a .295 .275 .42603 2.046
a. Predictors: (Constant), Moderator, Normative , Perceived, Tax
compling attitude
b. Dependent Variable: Dependent
Table 5 Results from the Model summary
As shown in the table above the R squared value is 0.29 which suggests that the independent
variables included in the data set are able to explain 29 % of the variation in the dependent
variable. Rest of the variation in the dependent variable is explained by some other factors
which are not the part of the regression equation.
ANOVAa
Model Sum of
Squares
df Mean Square F Sig.
1
Regression 11.077 4 2.769 15.257 .000b
Residual 26.499 146 .182
Total 37.576 150
a. Dependent Variable: Dependent
b. Predictors: (Constant), Moderator, Normative , Perceived, Tax compiling
attitude
Table 6 Results from the ANOVA table
Similarly the ANOVA table indicates that the F value is 15.25. This value shows the cumulative
impact of all the explanatory variables used in regression analysis on the dependent variable. In
Paraphrase This Document
Need a fresh take? Get an instant paraphrase of this document with our AI Paraphraser
the current case the F value is statistically significant as the p value is less than 0.05. So the
cumulative impact is significant.
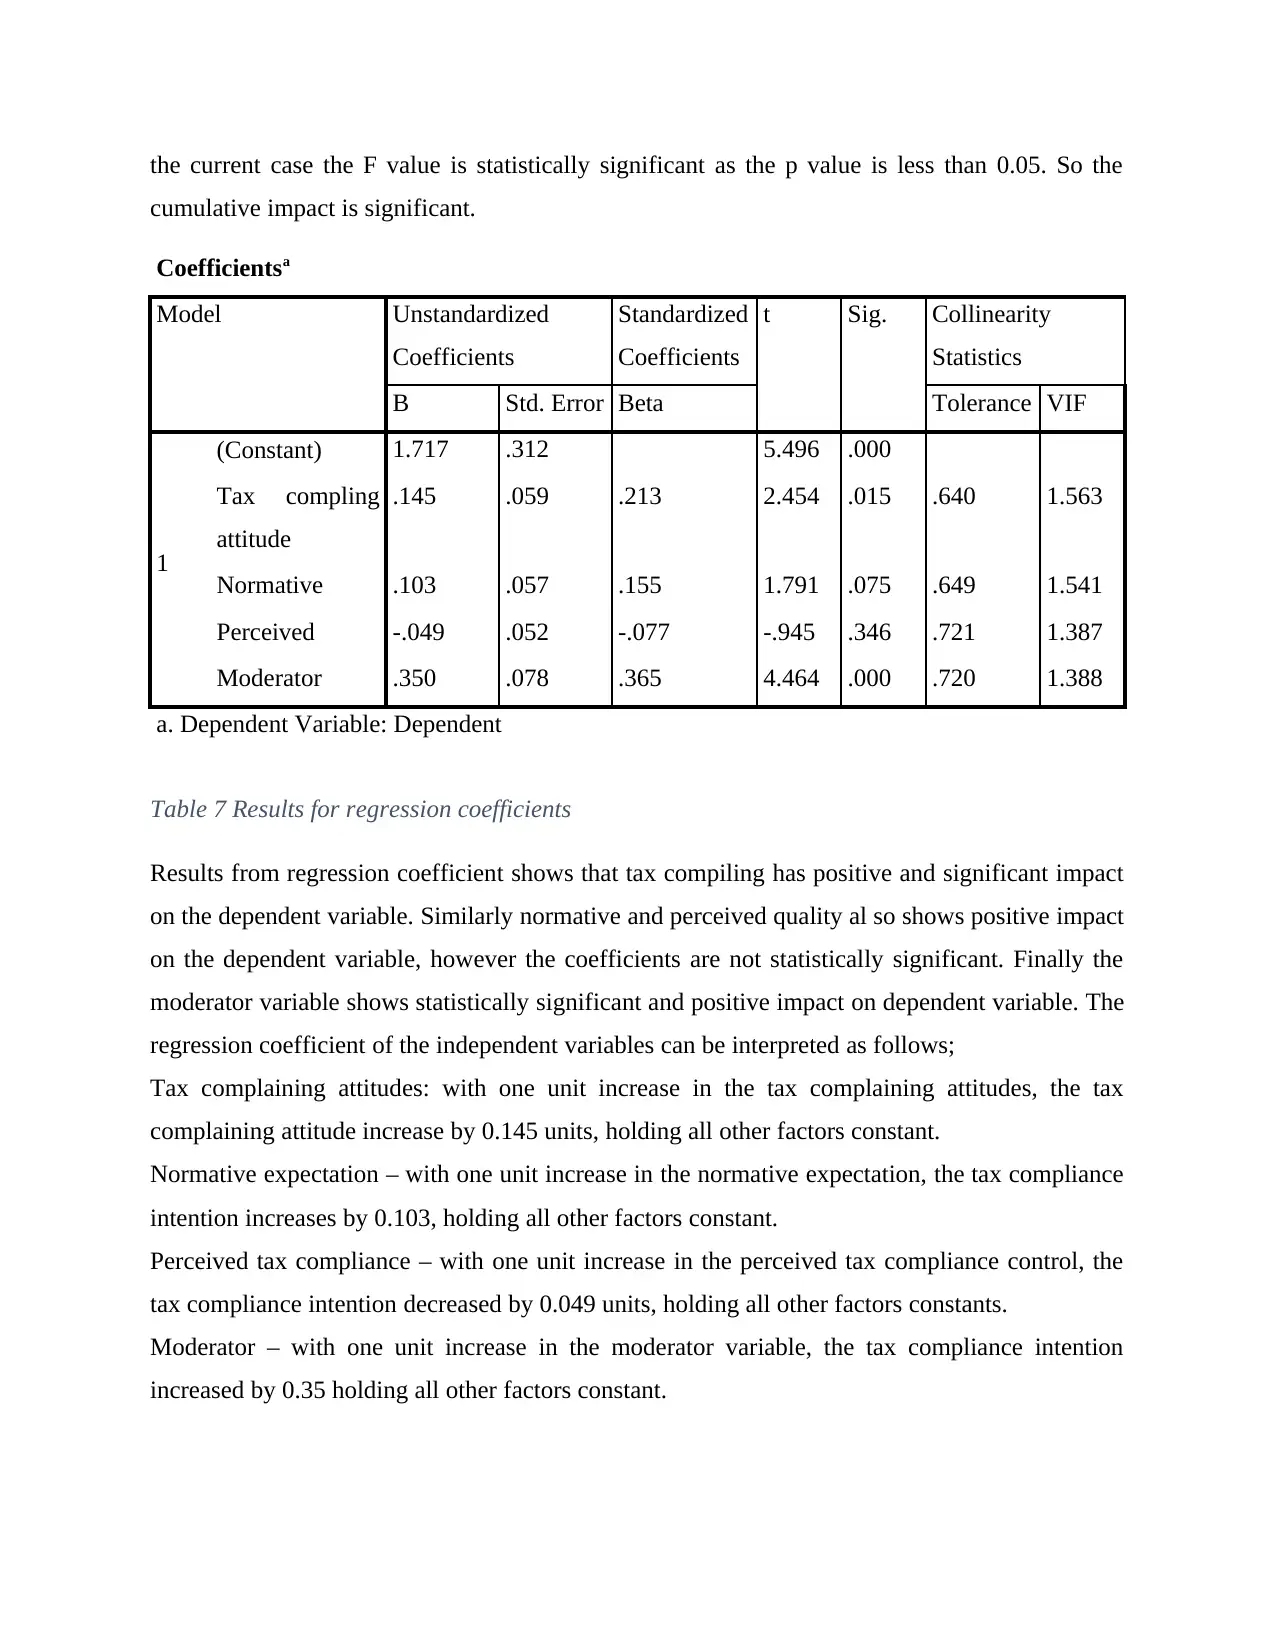
Coefficientsa
Model Unstandardized
Coefficients
Standardized
Coefficients
t Sig. Collinearity
Statistics
B Std. Error Beta Tolerance VIF
1
(Constant) 1.717 .312 5.496 .000
Tax compling
attitude
.145 .059 .213 2.454 .015 .640 1.563
Normative .103 .057 .155 1.791 .075 .649 1.541
Perceived -.049 .052 -.077 -.945 .346 .721 1.387
Moderator .350 .078 .365 4.464 .000 .720 1.388
a. Dependent Variable: Dependent
Table 7 Results for regression coefficients
Results from regression coefficient shows that tax compiling has positive and significant impact
on the dependent variable. Similarly normative and perceived quality al so shows positive impact
on the dependent variable, however the coefficients are not statistically significant. Finally the
moderator variable shows statistically significant and positive impact on dependent variable. The
regression coefficient of the independent variables can be interpreted as follows;
Tax complaining attitudes: with one unit increase in the tax complaining attitudes, the tax
complaining attitude increase by 0.145 units, holding all other factors constant.
Normative expectation – with one unit increase in the normative expectation, the tax compliance
intention increases by 0.103, holding all other factors constant.
Perceived tax compliance – with one unit increase in the perceived tax compliance control, the
tax compliance intention decreased by 0.049 units, holding all other factors constants.
Moderator – with one unit increase in the moderator variable, the tax compliance intention
increased by 0.35 holding all other factors constant.
cumulative impact is significant.
Coefficientsa
Model Unstandardized
Coefficients
Standardized
Coefficients
t Sig. Collinearity
Statistics
B Std. Error Beta Tolerance VIF
1
(Constant) 1.717 .312 5.496 .000
Tax compling
attitude
.145 .059 .213 2.454 .015 .640 1.563
Normative .103 .057 .155 1.791 .075 .649 1.541
Perceived -.049 .052 -.077 -.945 .346 .721 1.387
Moderator .350 .078 .365 4.464 .000 .720 1.388
a. Dependent Variable: Dependent
Table 7 Results for regression coefficients
Results from regression coefficient shows that tax compiling has positive and significant impact
on the dependent variable. Similarly normative and perceived quality al so shows positive impact
on the dependent variable, however the coefficients are not statistically significant. Finally the
moderator variable shows statistically significant and positive impact on dependent variable. The
regression coefficient of the independent variables can be interpreted as follows;
Tax complaining attitudes: with one unit increase in the tax complaining attitudes, the tax
complaining attitude increase by 0.145 units, holding all other factors constant.
Normative expectation – with one unit increase in the normative expectation, the tax compliance
intention increases by 0.103, holding all other factors constant.
Perceived tax compliance – with one unit increase in the perceived tax compliance control, the
tax compliance intention decreased by 0.049 units, holding all other factors constants.
Moderator – with one unit increase in the moderator variable, the tax compliance intention
increased by 0.35 holding all other factors constant.

To examine the existence of the multicollinarity, the VIF test has been performed and the results
from the collinearity statistics shows that the VIF values are between 1 and 10 which indicates
that there is no problem of multicollinarity in the regression equation(Armstrong, 2012; Iaci and
Singh, 2012).
Many previous scholars have also studied the factors affecting the tax compliance intention and
different scholars have identified various factors. A study by (MACHOGU, 2011) have shown
that the factors such as public governance quality, ethinicity and the attitudes affect the tax
compliance. Another study by (Engida and Abera, 2014) identified different factors such as the
economic factors ( benefit and cost of tax evasion, rate of tax, audits), institutional factors ( tax
authority, role of government) , social factors (positive perception, government policies) and
individual factors ( individual finance, awareness, attitude, knowledge). On the other hand
(Remali et al., 2015) analyzed the factors affecting the non-compliance of taxpayers. On the
basis of the results from the primary data authors concluded that the tax morale and the personal
morale are significantly related to the attitude of tax non-compliance. Furthermore the study by
(Marandu, Mbekomize and Ifezue, 2015) review and analyze the factors affecting the taxpayers
compliance. Secondary data was collected for the time period 1985-2012, Results from the study
suggests that the normative, attitudinal and subjective variables are the major factors affecting
the tax compliance. Results from this study are similar to the findings of the current study. This
shows that the current research is in line with the previous researches and can help to fill the gap
in the existing literature.
Furthermore the results from the data analysis also shows that the tax compliance intention is
positively and significantly correlated with tax compliance attitude. Also the relationship
between the normative expectation and the tax compliance intention are also positively and
significantly correlated. This indicates that people with positive normative expectation about the
tax compliance are expected to pay tax. This is may be because the people have positive
expectation, that the paid tax will be used for the betterment of the society which will improve
the overall wellbeing of all the people. Paying tax is also social responsibility so, people with
⊘ This is a preview!⊘
Do you want full access?
Subscribe today to unlock all pages.
Trusted by 1+ million students worldwide
1 out of 47
Related Documents


Your All-in-One AI-Powered Toolkit for Academic Success.
+13062052269
info@desklib.com
Available 24*7 on WhatsApp / Email
![[object Object]](/_next/static/media/star-bottom.7253800d.svg)
Unlock your academic potential
Copyright © 2020–2026 A2Z Services. All Rights Reserved. Developed and managed by ZUCOL.