Analyzing Consumer Behavior: A Survey on Nestle and PepsiCo Products
VerifiedAdded on 2023/06/05
|14
|3031
|76
Report
AI Summary
This report presents a comprehensive analysis of a consumer behavior survey focused on Nestle and PepsiCo products. The survey investigates the influence of factors such as perception, motivation, attitude, family, lifestyle, culture, and individual differences on consumer buying decisions. The methodology involved a questionnaire administered to a diverse group of households and individuals, with data analysis primarily involving the identification of themes and dispersion measurement. Key findings reveal the significance of psychological factors, including perception and motivation, in shaping consumer choices. The report also highlights the impact of personal attitudes, family dynamics, and socio-economic status on product preferences. Ultimately, this research aims to provide valuable insights for students, lecturers, and business entities seeking a customer-oriented approach to marketing, emphasizing the importance of understanding and catering to individual consumer needs to drive sales revenue. Desklib provides solved assignments.

Running head: SURVEY ANALYSIS 1
Survey Analysis
Name
Institutional Affiliation
Survey Analysis
Name
Institutional Affiliation
Paraphrase This Document
Need a fresh take? Get an instant paraphrase of this document with our AI Paraphraser
SURVEY ANALYSIS 2
Survey Analysis
Introduction
The study of consumer behavior is critical for all business entities. Generally, life
revolves around humans consuming services and goods. To achieve a competitive
edge, businesses need to understand the process of a consumer purchase decision
(Chhabra, 2018). The knowledge of the consumer psychology will enable business
organizations to develop competitive strategies that will be advantageous to them.
Organizations need to realize that consumers are different in their personality and
therefore in their preferences too. Consumers are also motivated by various factors to
go for the products and services they choose. A study into consumer behavior among
other market elements is therefore inevitable.
Purpose
Many variable factors influence the consumer buying decision for any product in
the market. Consumers behave differently due to these factors. I carried out a market
survey to investigate the factors influencing the consumer behavior. The goal of this
research was to find out how perception, culture, family and lifestyle, motivation,
attitude, and group and individual differences influence the consumer buying decision.
The survey shows that consumers have different tastes and preferences about nestle
and PepsiCo products. The research process is herein discussed as well the summary
and analysis of how the mentioned factors influence consumer behavior.
SURVEY ANALYSIS 3
Development of Survey Instrument
Foremost, the survey instrument used was a questionnaire which contained the
purpose of the survey on the first page. To measure the influence of the variables above
on consumer behavior, an appropriate survey instrument should provide room for
customer opinion (Jipp & Papenfuss, 2011). Additionally, the sample size is of the
essence in coming up with accurate conclusions about the market (Coombes, 2011).
Taking into account the two factors, I developed a questionnaire to gather data for this
survey. Twenty-five participants accessed this questionnaire and gave their feedback.
The questionnaire consisted of open-ended and closed-ended questions that sought to
find out why the customer preferred a particular product. Closed-ended questions aided
in finding out the family background and lifestyle of participants. Also, they helped to
predict their attitudes. Open-ended questions sought the opinions of the customers
which contributed in a deduction of the motivations, differences, perceptions, and
culture. For the validation of this questionnaire, I presented copies of the survey to the
department responsible for the consumer behavior course. The professors in charge
went through the survey carefully to determine whether it addressed the intended goal
adequately. They suggested the addition of interval questions to find out some
important specific information from the participants.
Administration Processes
Households were a more appropriate target for this survey. A convenient sample
was used to gather data for this survey. However, I sought to reach different
households, that is the high-class, the middle-class, and the low-class. The
questionnaire was administered to twenty families and five individuals. I delivered all
⊘ This is a preview!⊘
Do you want full access?
Subscribe today to unlock all pages.
Trusted by 1+ million students worldwide
SURVEY ANALYSIS 4
questionnaires in person to improve the response rate from the participants. I also
informed each participant of the goal of the survey to find a relevant response from
them. After one day of delivering the questionnaires, I collected the questionnaires back
and recorded a relatively high response rate of 90%. For me to retrieve all the inquiries
back, I sought the helping hand of a friend who helped deliver them and mark the
households. Through this, I managed to retrieve all the questionnaires dispatched.
Data Analysis
In this qualitative research, the primary method of the data analysis was the
identification of themes and dispersion measurement (Grill, 2017). Recording the
responses from the questionnaires marked the process of data analysis. Firstly, I
organized the responses regarding the classes and lifestyle for the households. For the
individuals, the sampling was random, and therefore there was no need to organize
their responses. Secondly, I noted the viewpoints of the respondents concerning each
question. The process if interpretation for these responses took a lot of time because it
is the most critical. A lot of information was extracted from the answer to open-ended
questions. By analyzing the response of participants analytically and logically, I came up
with the themes and trends in consumer behavior. There were similarities in the
responses of individuals and households of the same class. Each household and
individual indicated their lifestyle in their responses.
Notably, the respondents showed that each consumer of any particular product
puts their preferences first even with budget constraints in their purchasing decision.
The research met its goal of seeking a response from individuals as well as households.
No tool of analysis is required for examining the respondent’s opinions. The responses
Paraphrase This Document
Need a fresh take? Get an instant paraphrase of this document with our AI Paraphraser
SURVEY ANALYSIS 5
of the participants were structured in an easy to understand manner which reflected
their feelings as well as their thoughts about Nestle and PepsiCo. Therefore, it was easy
to infer conclusions about their attitudes, perceptions, culture, lifestyle, and motivations.
Furthermore, the responses provided the information needed concerning the goal of the
survey.
Key Findings
Consumers prefer not be generalized but to be treated individually. They
advocate for their tastes and ideas. Most factors influencing consumer buying decision
are psychological. Different aspects influence various people in varied ways. Firstly, the
perception has a critical role in the decision-making of a customer (Dhadhal, 2018). A
consumer must first be exposed to a product or service and then interpret them. There
are various ways by which consumers are exposed to products. After that, their
attention is drawn to the product, and they begin to understand it in their ways. Many
respondents of this survey insinuated that their first encounter with products determined
how they interpreted the product. For example, advertisements structured poorly did not
attract many consumers to a product. Some consumers associated the quality of a
product with its price (Dagher & Itani, 2014). Thus, they preferred some nestle products
to PepsiCo products.
Secondly, motivation emerged as a strong determined of consumer choices
(Foxall, 2015). There are theories put forward to explain human motives for purchasing
products. Human motives are classified from basic to advanced motives. Food is a
human’s primary need. Most respondents admitted that on any day, they shopped for
food more than any other item.
SURVEY ANALYSIS 6
Additionally, other needs after they had satisfied their hunger. The Maslow’s
needs hierarchy presents the categories of requirements for humans in the order of
advancement. Most respondents subscribed to the needs hierarchy (Prakash & Pathak,
2014).
Thirdly, the personal attitude of consumers is of the significant essence in coming
up with marketing strategies for organizations (Gomes, 2016). Attitudes are shaped by
perceptions and even personality. Friends and family can play a crucial role in shaping
the attitude of a potential consumer. Household respondents admitted that their family
members influenced their take on many products. Moreover, consumers have varied
level of commitment to products. It takes time for a consumer to identify with a product
completely.
Moreover, there are differences, group or individual, that influence how
consumers settle for products (Gomes, 2018). In references to responses provided in
the questionnaires, people are different regarding their personality. Members of a family
may exhibit close personalities which led them to prefer certain products. There core
traits that distinguish personalities and they include extroversion, agreeableness,
conscientiousness, openness to experience and instability. Individual respondents
showed that people preferred products which suit their personality. Some people are
more attracted to products that are unique and may not be accessible to many.
Furthermore, family and lifestyle is a strong critical factor in analyzing consumer
behavior (Ramya & Ali, 2016). A difference was noted in the responses of households
considering their socio-economic statuses. High-class families were at liberty to choose
products which best product which satisfied their needs. Middle-class families
⊘ This is a preview!⊘
Do you want full access?
Subscribe today to unlock all pages.
Trusted by 1+ million students worldwide
SURVEY ANALYSIS 7
considered their budget restraint while purchasing some products on the market. On the
other hand, low-class families settled for the cheapest product that would fulfill their
needs. In their view, the durability of a product mattered more than other factors. High-
class families obtained more luxury goods within short periods of time.
Also, culture specially influences consumers. Culture constitutes the education
levels and awareness of individuals (Piacentini & Cui, 2014). Exposure to different ways
of life and environments enable people to to look at products differently. While another
person would look at a product as a luxury, another one would view it as a need. This
was the case for households with different lifestyles. People living in different
environments may value products differently. Education levels affect peoples’ outlook
on life and the products that they need.
Conclusion
This research can help students and lecturers who are studying consumer
behavior and business entities which are focused on the customer-oriented approach to
marketing. It will add on to the knowledge of factors influencing the satisfaction of
consumers. It should be noted that consumers should be treated with care in business
because they drive sales revenue. Business organizations can implement some of the
critical information in this research so that they are to come up with competitive
strategies. To achieve better performance, organizations can implement some of the
critical findings of this research.
Paraphrase This Document
Need a fresh take? Get an instant paraphrase of this document with our AI Paraphraser

SURVEY ANALYSIS 8
SURVEY ANALYSIS 9
References
Chhabra, D. (2018). Factors Affecting Consumer Buying Behaviour and Decision
Making Process towards FMCG Products. Journal of Advances and Scholarly
Researches in Allied Education, 15(6), 131-139. doi:10.29070/15/57735
Coombes, H. (2011). Questionnaires. Research Using IT, 10(1), 123-150.
doi:10.1007/978-1-137-05029-8_6
Dagher, G. K., & Itani, O. (2014). Factors influencing green purchasing behaviour:
Empirical evidence from the Lebanese consumers. Journal of Consumer
Behaviour, 13(3), 188-195. doi:10.1002/cb.1482
Dhadhal, D. C. (2018). Brand Preference of Consumers for Selected Brands of
FMCG Products -A Study of Rajkot City. RA Journal Of Applied Research,
04(05), 1-27. doi:10.31142/rajar/v4i5.06
Foxall, G. R. (2015). Emotions and Consumer Behaviour. The Elgar Companion to
Consumer Research and Economic Psychology, 1(1), 279-348.
doi:10.4337/9781843768708.00038
Gomes, A. M. (2016). Factors Influencing Meat Buying Behaviour among Rural, Semi-
Urban and Urban Households. International Journal of Science and Research
(IJSR), 5(2), 317-318. doi:10.21275/v5i2.nov161132
Gomes, A. M. (2018). Influencing Factors of Consumer Behaviour in Retail Shops.
SSRN Electronic Journal, 3(1), 34-89. doi:10.2139/ssrn.3151879
Grill, C. (2017). Longitudinal Data Analysis, Panel Data Analysis. The International
Encyclopedia of Communication Research Methods, 5(1), 1-9.
doi:10.1002/9781118901731.iecrm0134
⊘ This is a preview!⊘
Do you want full access?
Subscribe today to unlock all pages.
Trusted by 1+ million students worldwide
SURVEY ANALYSIS
10
Jipp, M., & Papenfuss, A. (2011). Reliability and Validity of the SHAPE Teamwork
Questionnaire. PsycEXTRA Dataset, 7(1), 44-90. doi:10.1037/e578902012-
024
Piacentini, M. G., & Cui, C. C. (2014). Multicultural perspectives on customer behavior.
Journal of Marketing Management, 26(11-12), 993-1004.
doi:10.1080/0267257x.2010.508969
Prakash, G., & Pathak, P. (2014). Understanding Rural Buying Behaviour: A Study
with Special Reference to FMCG Products. Indian Journal of Marketing,
44(8), 43. doi:10.17010/ijom/2014/v44/i8/80132
Ramya, N., & Ali, S. M. (2016). Factors affecting consumer buying behavior. Journal of
International Network Center for Fundamental and Applied Research, 7(1), 76-
80. doi:10.13187/jincfar.2016.7
Paraphrase This Document
Need a fresh take? Get an instant paraphrase of this document with our AI Paraphraser
SURVEY ANALYSIS
11
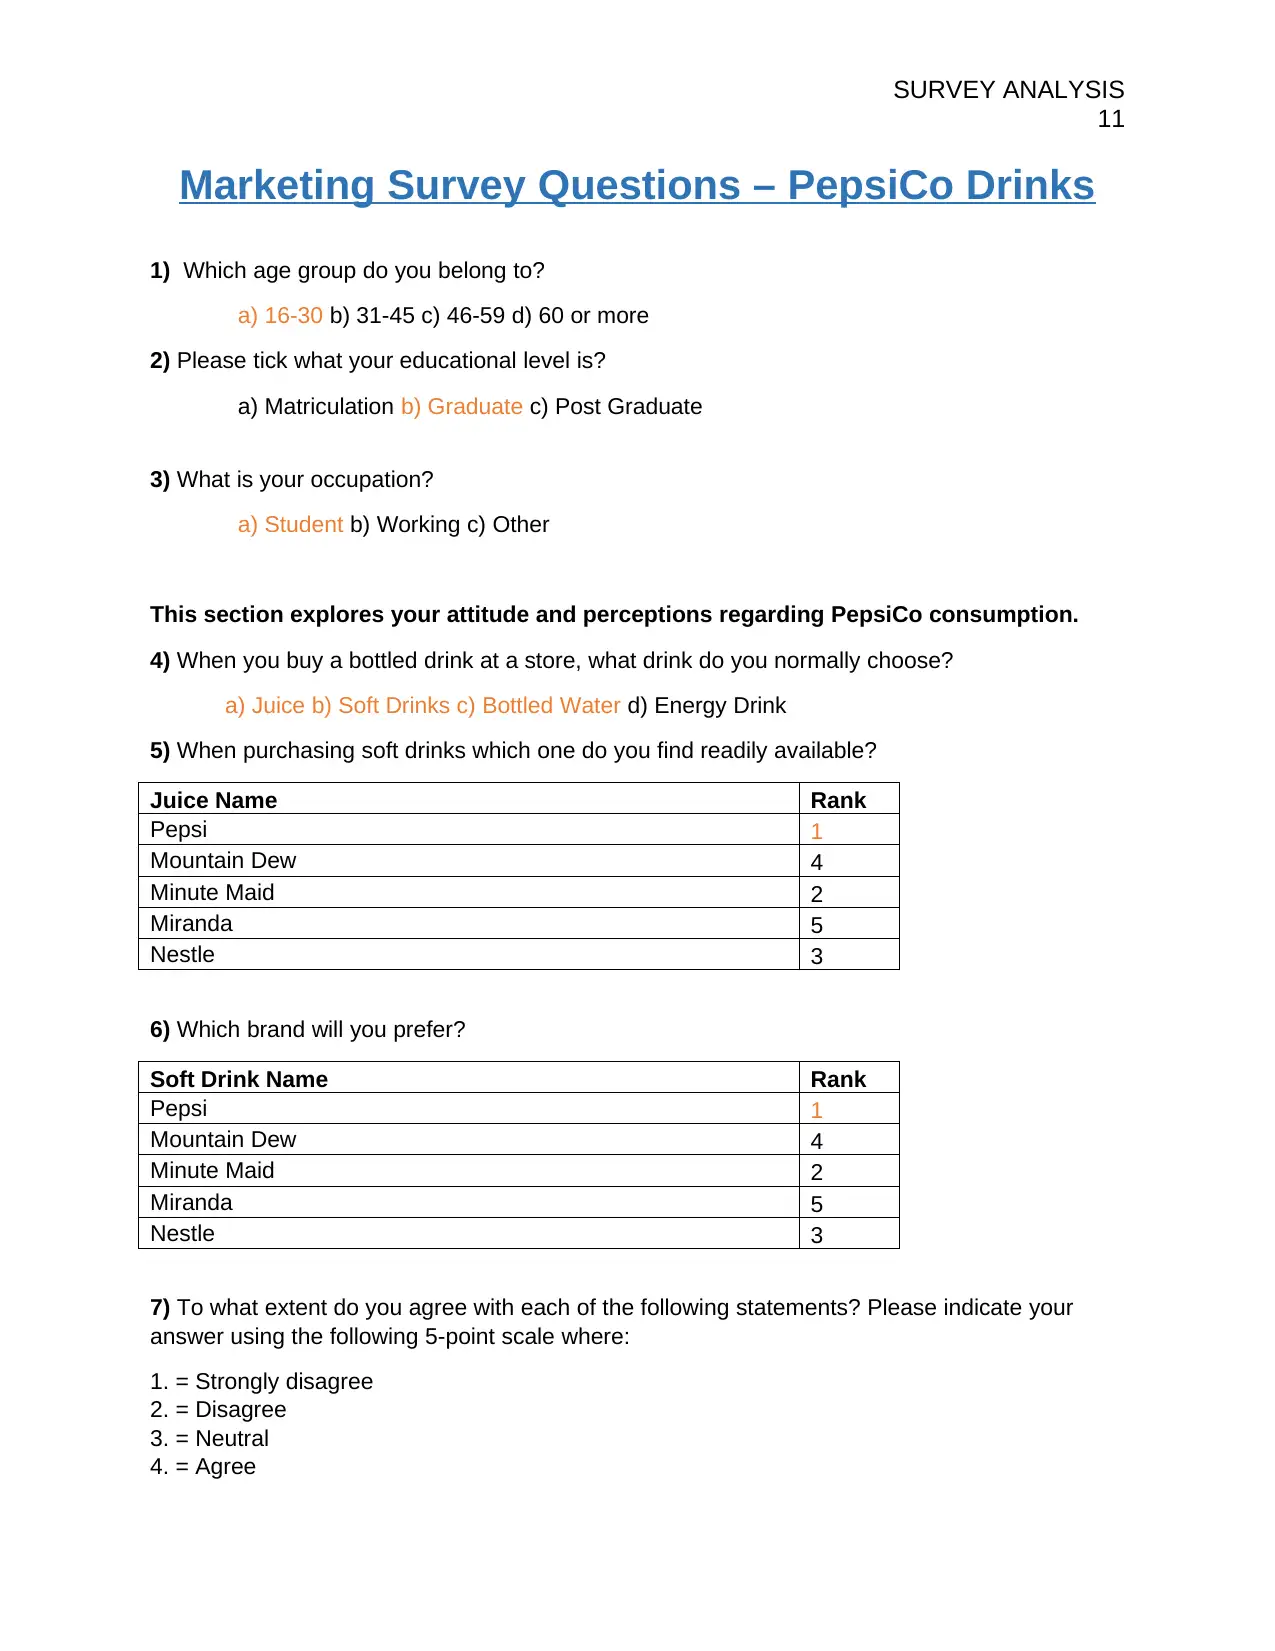
Marketing Survey Questions – PepsiCo Drinks
1) Which age group do you belong to?
a) 16-30 b) 31-45 c) 46-59 d) 60 or more
2) Please tick what your educational level is?
a) Matriculation b) Graduate c) Post Graduate
3) What is your occupation?
a) Student b) Working c) Other
This section explores your attitude and perceptions regarding PepsiCo consumption.
4) When you buy a bottled drink at a store, what drink do you normally choose?
a) Juice b) Soft Drinks c) Bottled Water d) Energy Drink
5) When purchasing soft drinks which one do you find readily available?
Juice Name Rank
Pepsi 1
Mountain Dew 4
Minute Maid 2
Miranda 5
Nestle 3
6) Which brand will you prefer?
Soft Drink Name Rank
Pepsi 1
Mountain Dew 4
Minute Maid 2
Miranda 5
Nestle 3
7) To what extent do you agree with each of the following statements? Please indicate your
answer using the following 5-point scale where:
1. = Strongly disagree
2. = Disagree
3. = Neutral
4. = Agree
11
Marketing Survey Questions – PepsiCo Drinks
1) Which age group do you belong to?
a) 16-30 b) 31-45 c) 46-59 d) 60 or more
2) Please tick what your educational level is?
a) Matriculation b) Graduate c) Post Graduate
3) What is your occupation?
a) Student b) Working c) Other
This section explores your attitude and perceptions regarding PepsiCo consumption.
4) When you buy a bottled drink at a store, what drink do you normally choose?
a) Juice b) Soft Drinks c) Bottled Water d) Energy Drink
5) When purchasing soft drinks which one do you find readily available?
Juice Name Rank
Pepsi 1
Mountain Dew 4
Minute Maid 2
Miranda 5
Nestle 3
6) Which brand will you prefer?
Soft Drink Name Rank
Pepsi 1
Mountain Dew 4
Minute Maid 2
Miranda 5
Nestle 3
7) To what extent do you agree with each of the following statements? Please indicate your
answer using the following 5-point scale where:
1. = Strongly disagree
2. = Disagree
3. = Neutral
4. = Agree
SURVEY ANALYSIS
12
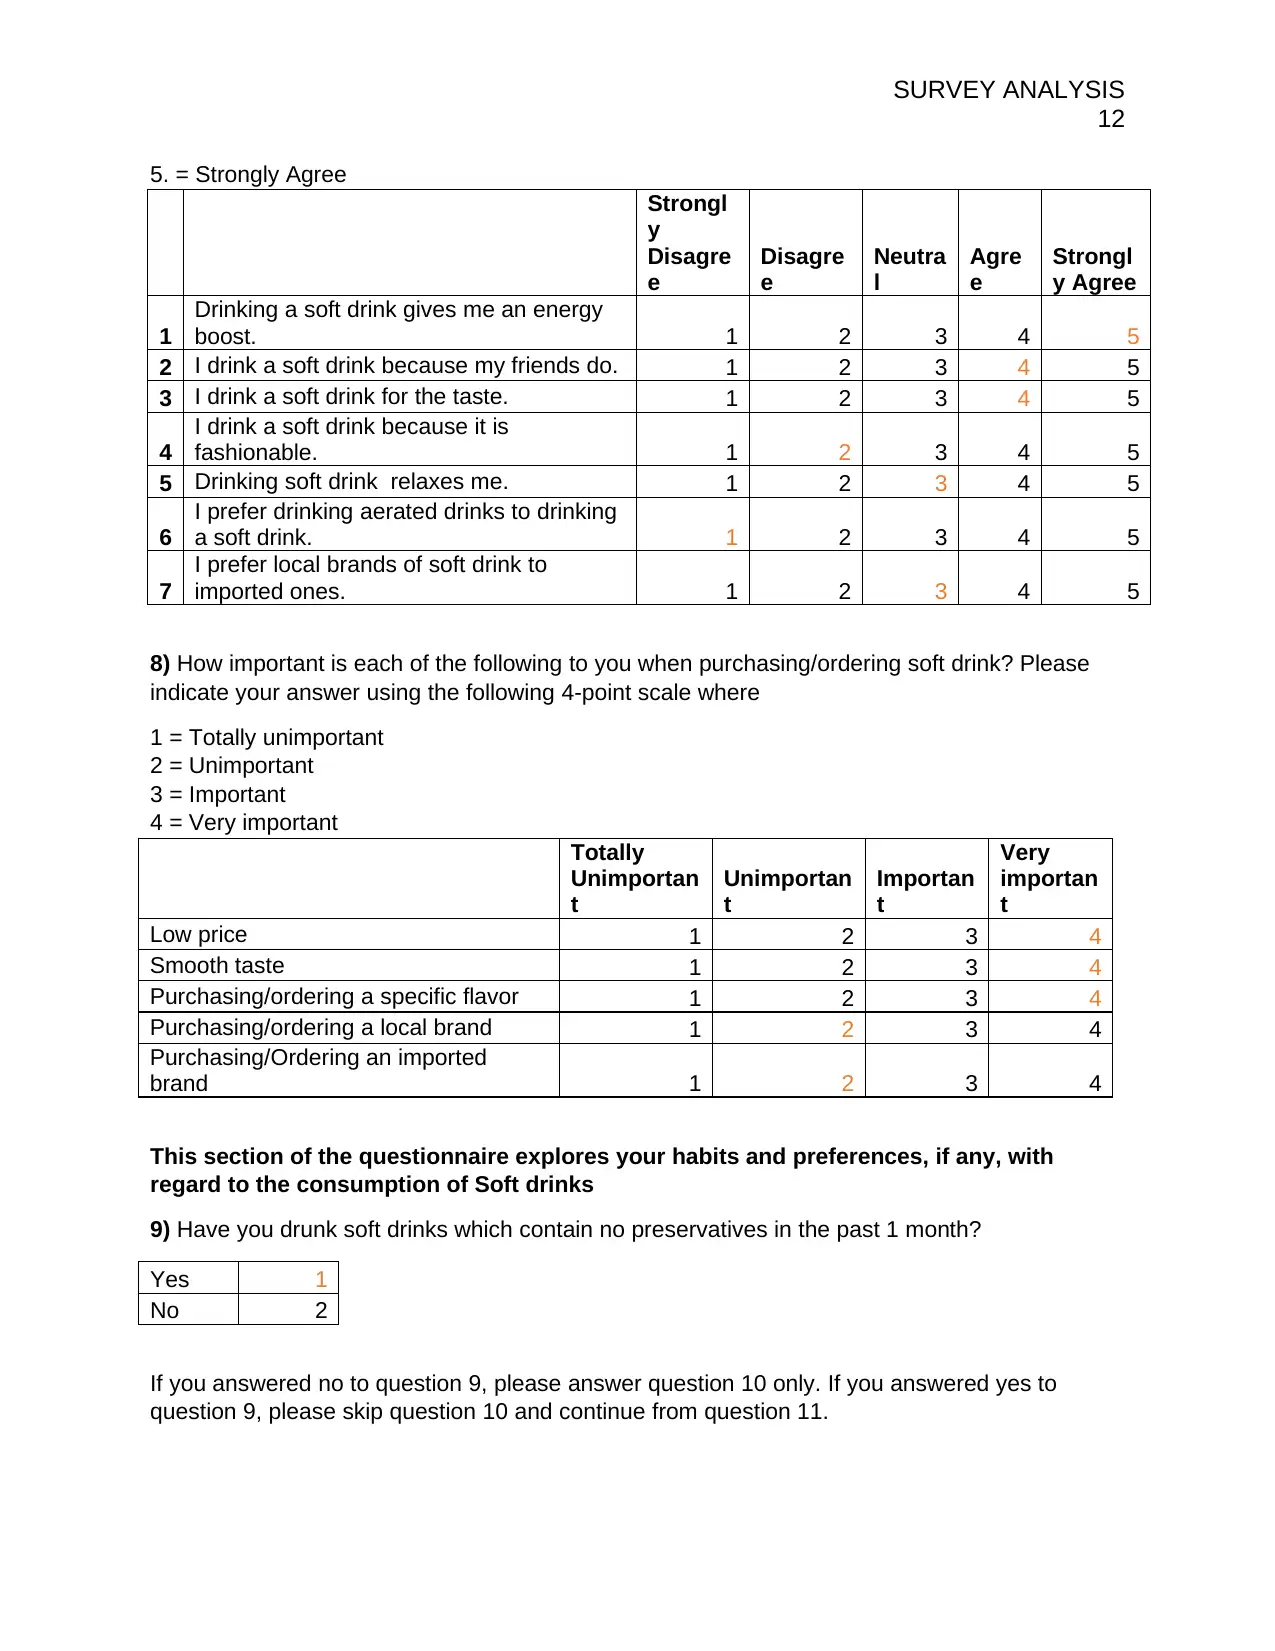
5. = Strongly Agree
Strongl
y
Disagre
e
Disagre
e
Neutra
l
Agre
e
Strongl
y Agree
1
Drinking a soft drink gives me an energy
boost. 1 2 3 4 5
2 I drink a soft drink because my friends do. 1 2 3 4 5
3 I drink a soft drink for the taste. 1 2 3 4 5
4
I drink a soft drink because it is
fashionable. 1 2 3 4 5
5 Drinking soft drink relaxes me. 1 2 3 4 5
6
I prefer drinking aerated drinks to drinking
a soft drink. 1 2 3 4 5
7
I prefer local brands of soft drink to
imported ones. 1 2 3 4 5
8) How important is each of the following to you when purchasing/ordering soft drink? Please
indicate your answer using the following 4-point scale where
1 = Totally unimportant
2 = Unimportant
3 = Important
4 = Very important
Totally
Unimportan
t
Unimportan
t
Importan
t
Very
importan
t
Low price 1 2 3 4
Smooth taste 1 2 3 4
Purchasing/ordering a specific flavor 1 2 3 4
Purchasing/ordering a local brand 1 2 3 4
Purchasing/Ordering an imported
brand 1 2 3 4
This section of the questionnaire explores your habits and preferences, if any, with
regard to the consumption of Soft drinks
9) Have you drunk soft drinks which contain no preservatives in the past 1 month?
Yes 1
No 2
If you answered no to question 9, please answer question 10 only. If you answered yes to
question 9, please skip question 10 and continue from question 11.
12
5. = Strongly Agree
Strongl
y
Disagre
e
Disagre
e
Neutra
l
Agre
e
Strongl
y Agree
1
Drinking a soft drink gives me an energy
boost. 1 2 3 4 5
2 I drink a soft drink because my friends do. 1 2 3 4 5
3 I drink a soft drink for the taste. 1 2 3 4 5
4
I drink a soft drink because it is
fashionable. 1 2 3 4 5
5 Drinking soft drink relaxes me. 1 2 3 4 5
6
I prefer drinking aerated drinks to drinking
a soft drink. 1 2 3 4 5
7
I prefer local brands of soft drink to
imported ones. 1 2 3 4 5
8) How important is each of the following to you when purchasing/ordering soft drink? Please
indicate your answer using the following 4-point scale where
1 = Totally unimportant
2 = Unimportant
3 = Important
4 = Very important
Totally
Unimportan
t
Unimportan
t
Importan
t
Very
importan
t
Low price 1 2 3 4
Smooth taste 1 2 3 4
Purchasing/ordering a specific flavor 1 2 3 4
Purchasing/ordering a local brand 1 2 3 4
Purchasing/Ordering an imported
brand 1 2 3 4
This section of the questionnaire explores your habits and preferences, if any, with
regard to the consumption of Soft drinks
9) Have you drunk soft drinks which contain no preservatives in the past 1 month?
Yes 1
No 2
If you answered no to question 9, please answer question 10 only. If you answered yes to
question 9, please skip question 10 and continue from question 11.
⊘ This is a preview!⊘
Do you want full access?
Subscribe today to unlock all pages.
Trusted by 1+ million students worldwide
1 out of 14
Related Documents


Your All-in-One AI-Powered Toolkit for Academic Success.
+13062052269
info@desklib.com
Available 24*7 on WhatsApp / Email
![[object Object]](/_next/static/media/star-bottom.7253800d.svg)
Unlock your academic potential
Copyright © 2020–2026 A2Z Services. All Rights Reserved. Developed and managed by ZUCOL.