Analysis of Factors Impacting Humanitarian Supply Chain Performance
VerifiedAdded on 2023/01/23
|40
|13283
|66
Report
AI Summary
This report analyzes the factors affecting the performance of humanitarian supply chains, focusing on political, socio-economic, internal organizational, and infrastructural situational factors. The research employs data analysis, including descriptive statistics, to assess quantitative data, presented in tabular and graphical formats. Key findings highlight the impact of political changes, socio-economic conditions, technological advancements, and infrastructural developments on humanitarian logistics. The report also compares disaster impacts across several developing countries, such as Kenya, South Africa, Ethiopia, Ghana, Sudan, and Malawi, using statistical data and descriptive statistics to assess the severity of natural disasters. Appendices include comprehensive economic indicators for these countries, offering a detailed view of their economic status and the challenges they face, particularly in disaster response and resource management. The analysis underscores the importance of government and organizational strategies in improving humanitarian logistics and disaster preparedness.
EXAMINE THE FACTORS THAT
AFFECTING THE HUMANITARIAN
SUPPLY CHAIN PERFORMANCE
AFFECTING THE HUMANITARIAN
SUPPLY CHAIN PERFORMANCE
Paraphrase This Document
Need a fresh take? Get an instant paraphrase of this document with our AI Paraphraser
TABLE OF CONTENTS
CHAPTER 4 RESULTS AND DISCUSSION................................................................................3
4.1 Data collection.......................................................................................................................3
4.3 Analysis and findings...........................................................................................................37
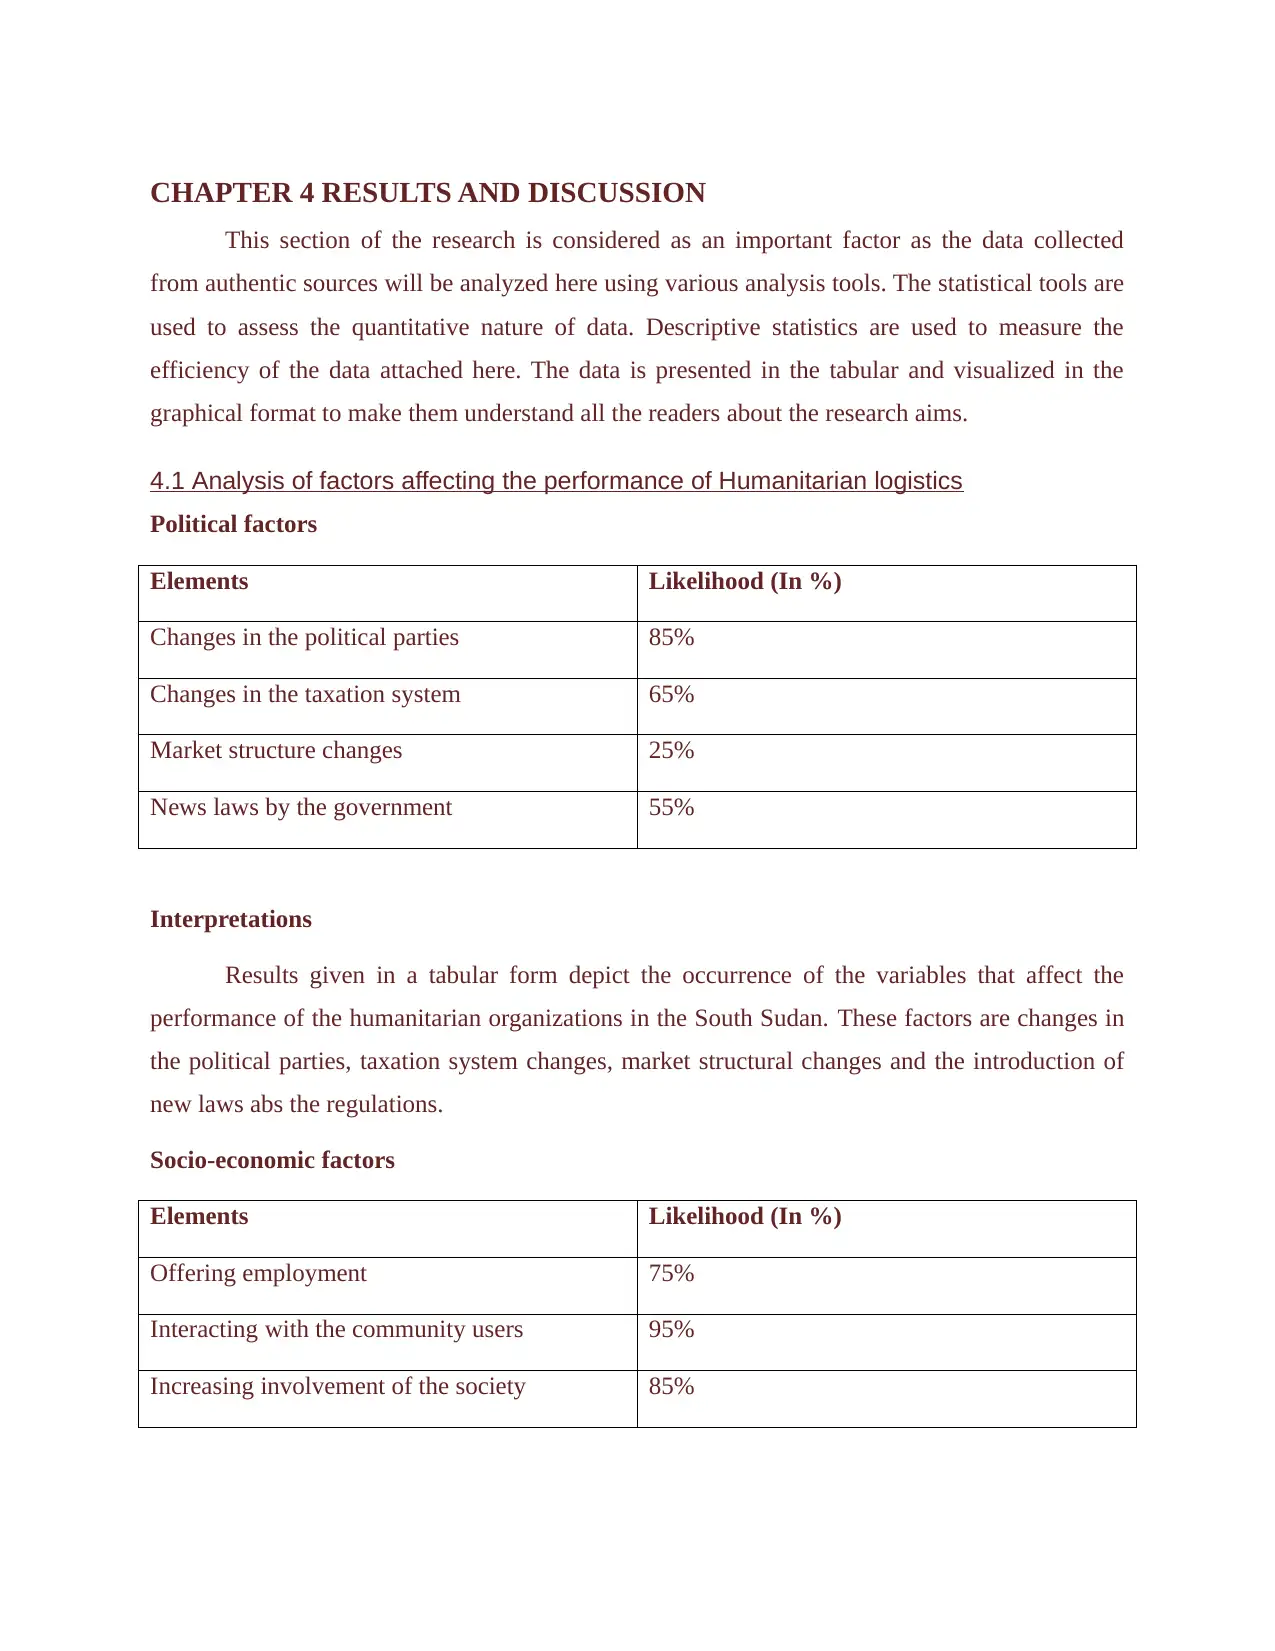
CHAPTER 4 RESULTS AND DISCUSSION
This section of the research is considered as an important factor as the data collected
from authentic sources will be analyzed here using various analysis tools. The statistical tools are
used to assess the quantitative nature of data. Descriptive statistics are used to measure the
efficiency of the data attached here. The data is presented in the tabular and visualized in the
graphical format to make them understand all the readers about the research aims.
4.1 Analysis of factors affecting the performance of Humanitarian logistics
Political factors
Elements Likelihood (In %)
Changes in the political parties 85%
Changes in the taxation system 65%
Market structure changes 25%
News laws by the government 55%
Interpretations
Results given in a tabular form depict the occurrence of the variables that affect the
performance of the humanitarian organizations in the South Sudan. These factors are changes in
the political parties, taxation system changes, market structural changes and the introduction of
new laws abs the regulations.
Socio-economic factors
Elements Likelihood (In %)
Offering employment 75%
Interacting with the community users 95%
Increasing involvement of the society 85%
⊘ This is a preview!⊘
Do you want full access?
Subscribe today to unlock all pages.
Trusted by 1+ million students worldwide
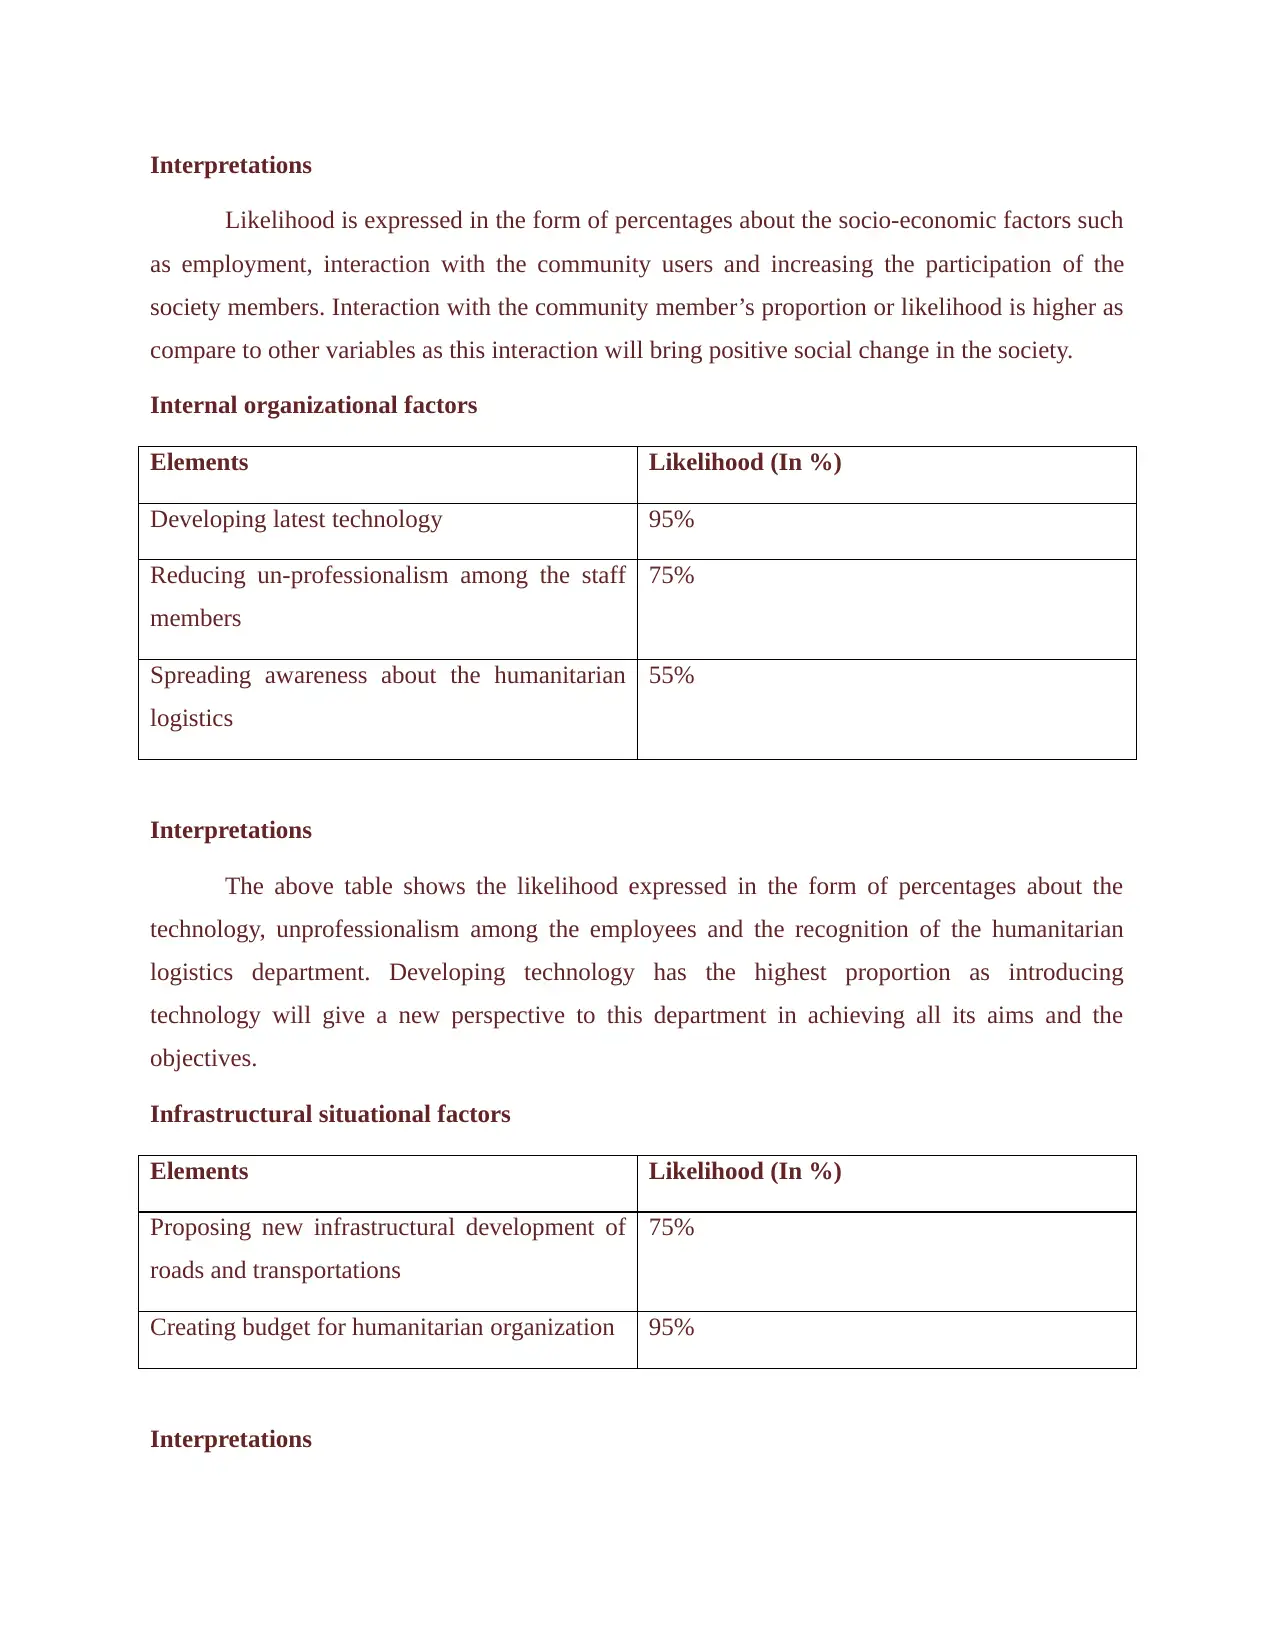
Interpretations
Likelihood is expressed in the form of percentages about the socio-economic factors such
as employment, interaction with the community users and increasing the participation of the
society members. Interaction with the community member’s proportion or likelihood is higher as
compare to other variables as this interaction will bring positive social change in the society.
Internal organizational factors
Elements Likelihood (In %)
Developing latest technology 95%
Reducing un-professionalism among the staff
members
75%
Spreading awareness about the humanitarian
logistics
55%
Interpretations
The above table shows the likelihood expressed in the form of percentages about the
technology, unprofessionalism among the employees and the recognition of the humanitarian
logistics department. Developing technology has the highest proportion as introducing
technology will give a new perspective to this department in achieving all its aims and the
objectives.
Infrastructural situational factors
Elements Likelihood (In %)
Proposing new infrastructural development of
roads and transportations
75%
Creating budget for humanitarian organization 95%
Interpretations
Paraphrase This Document
Need a fresh take? Get an instant paraphrase of this document with our AI Paraphraser
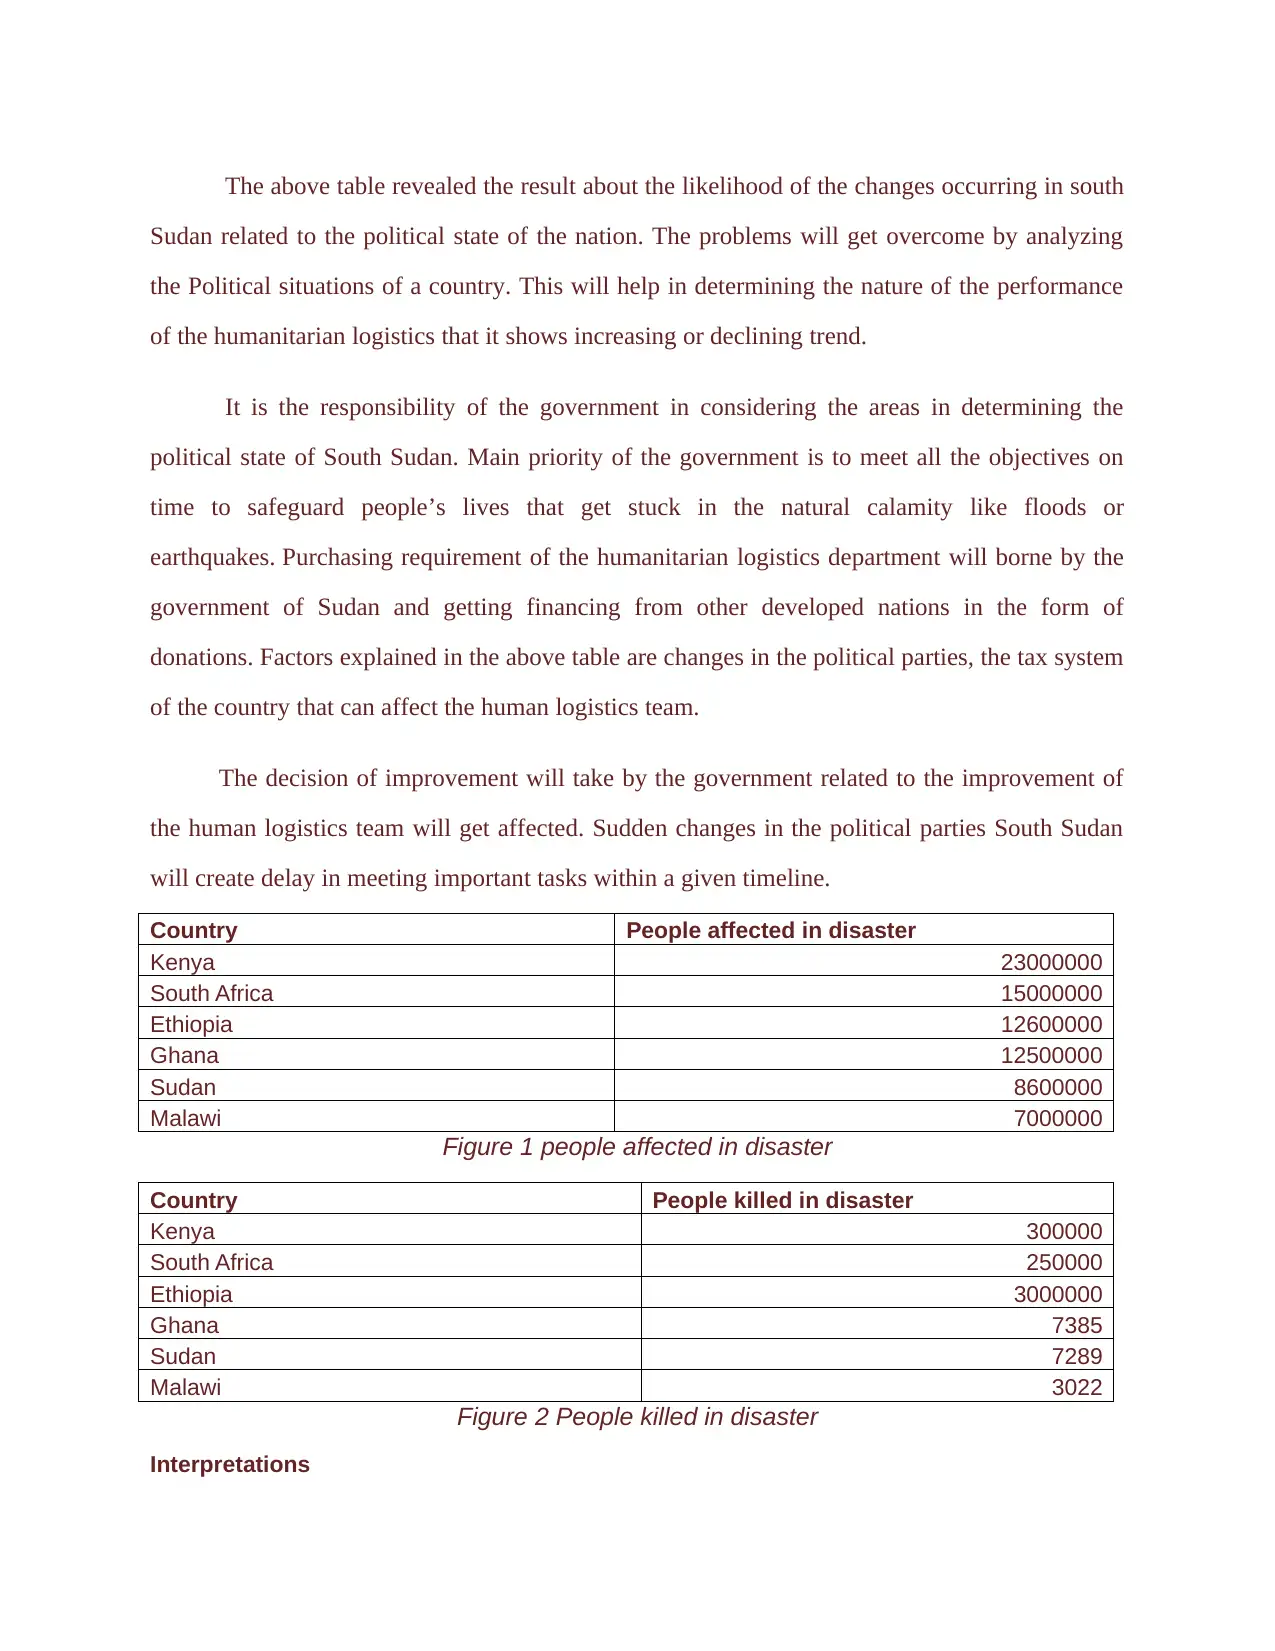
The above table revealed the result about the likelihood of the changes occurring in south
Sudan related to the political state of the nation. The problems will get overcome by analyzing
the Political situations of a country. This will help in determining the nature of the performance
of the humanitarian logistics that it shows increasing or declining trend.
It is the responsibility of the government in considering the areas in determining the
political state of South Sudan. Main priority of the government is to meet all the objectives on
time to safeguard people’s lives that get stuck in the natural calamity like floods or
earthquakes. Purchasing requirement of the humanitarian logistics department will borne by the
government of Sudan and getting financing from other developed nations in the form of
donations. Factors explained in the above table are changes in the political parties, the tax system
of the country that can affect the human logistics team.
The decision of improvement will take by the government related to the improvement of
the human logistics team will get affected. Sudden changes in the political parties South Sudan
will create delay in meeting important tasks within a given timeline.
Country People affected in disaster
Kenya 23000000
South Africa 15000000
Ethiopia 12600000
Ghana 12500000
Sudan 8600000
Malawi 7000000
Figure 1 people affected in disaster
Country People killed in disaster
Kenya 300000
South Africa 250000
Ethiopia 3000000
Ghana 7385
Sudan 7289
Malawi 3022
Figure 2 People killed in disaster
Interpretations
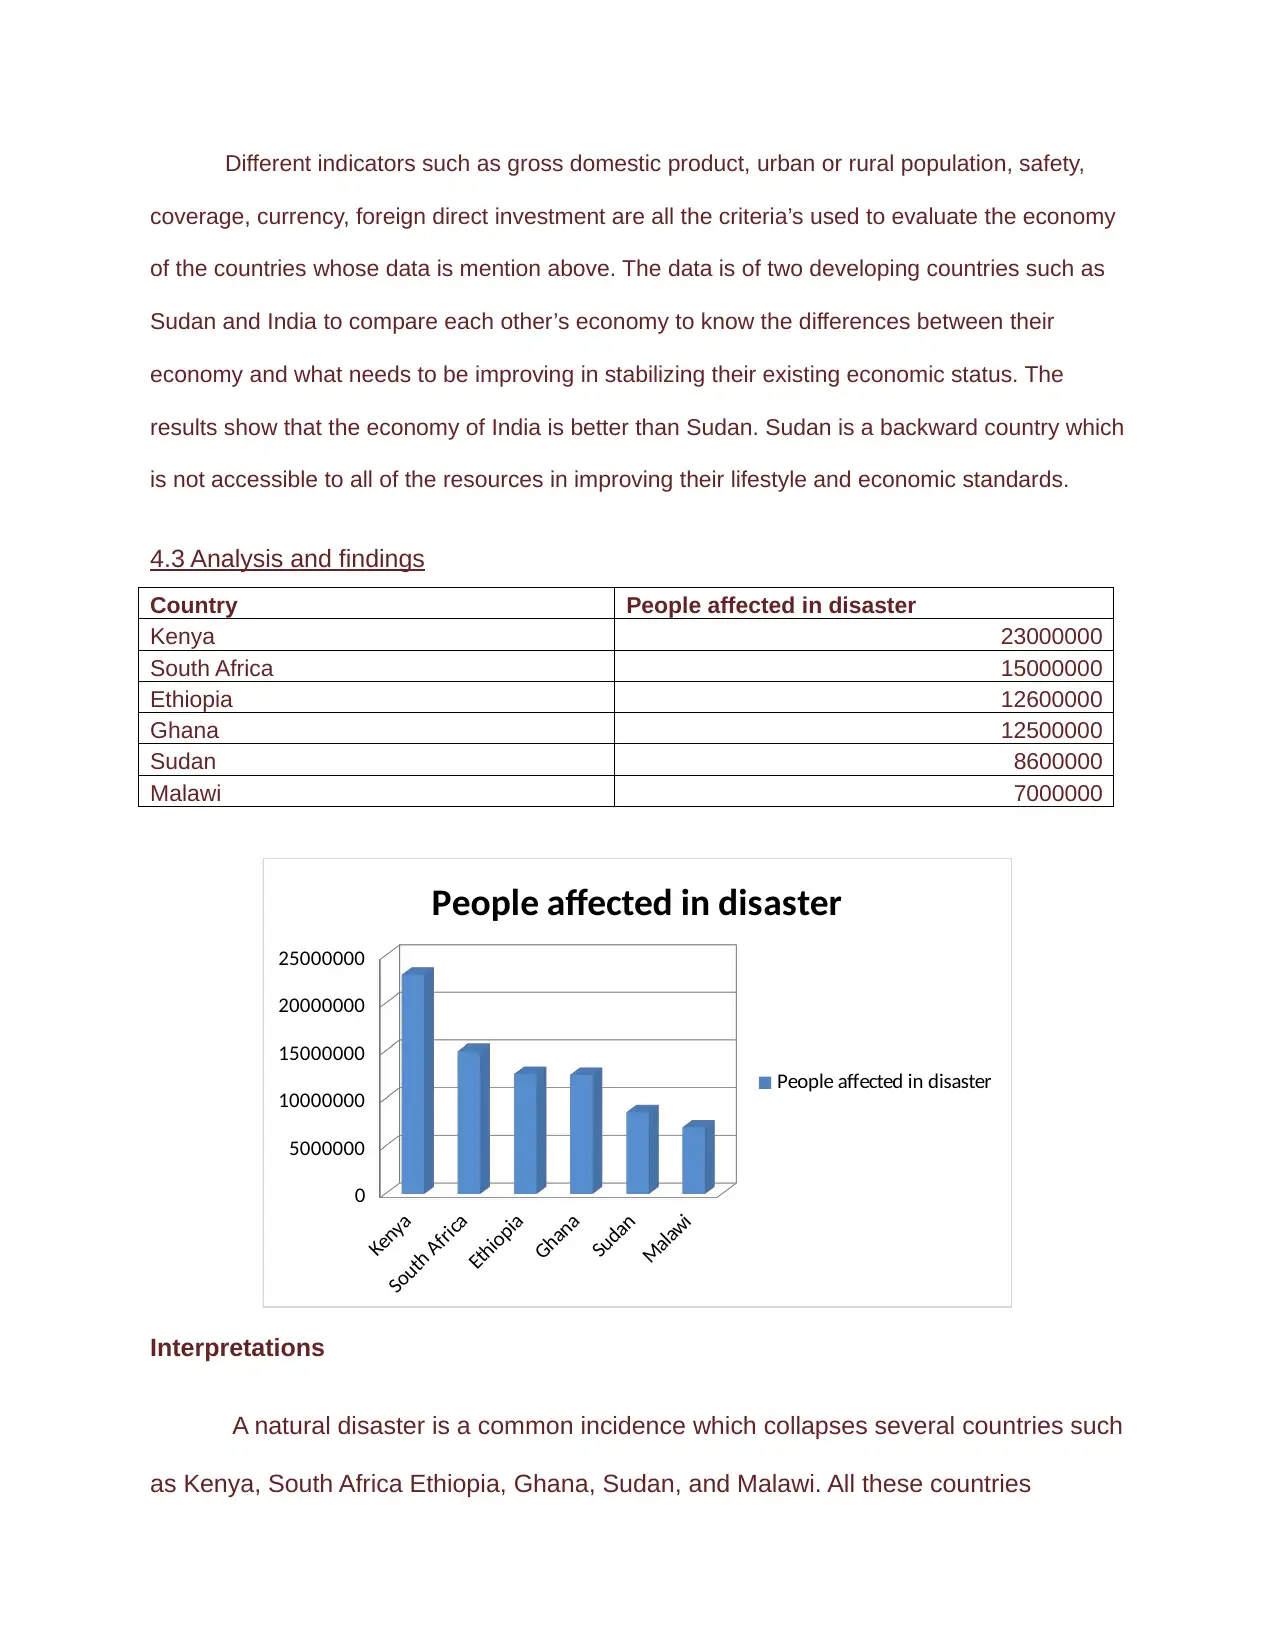
Different indicators such as gross domestic product, urban or rural population, safety,
coverage, currency, foreign direct investment are all the criteria’s used to evaluate the economy
of the countries whose data is mention above. The data is of two developing countries such as
Sudan and India to compare each other’s economy to know the differences between their
economy and what needs to be improving in stabilizing their existing economic status. The
results show that the economy of India is better than Sudan. Sudan is a backward country which
is not accessible to all of the resources in improving their lifestyle and economic standards.
4.3 Analysis and findings
Country People affected in disaster
Kenya 23000000
South Africa 15000000
Ethiopia 12600000
Ghana 12500000
Sudan 8600000
Malawi 7000000
Kenya
South Africa
Ethiopia
Ghana
Sudan
Malawi
0
5000000
10000000
15000000
20000000
25000000
People affected in disaster
People affected in disaster
Interpretations
A natural disaster is a common incidence which collapses several countries such
as Kenya, South Africa Ethiopia, Ghana, Sudan, and Malawi. All these countries
⊘ This is a preview!⊘
Do you want full access?
Subscribe today to unlock all pages.
Trusted by 1+ million students worldwide
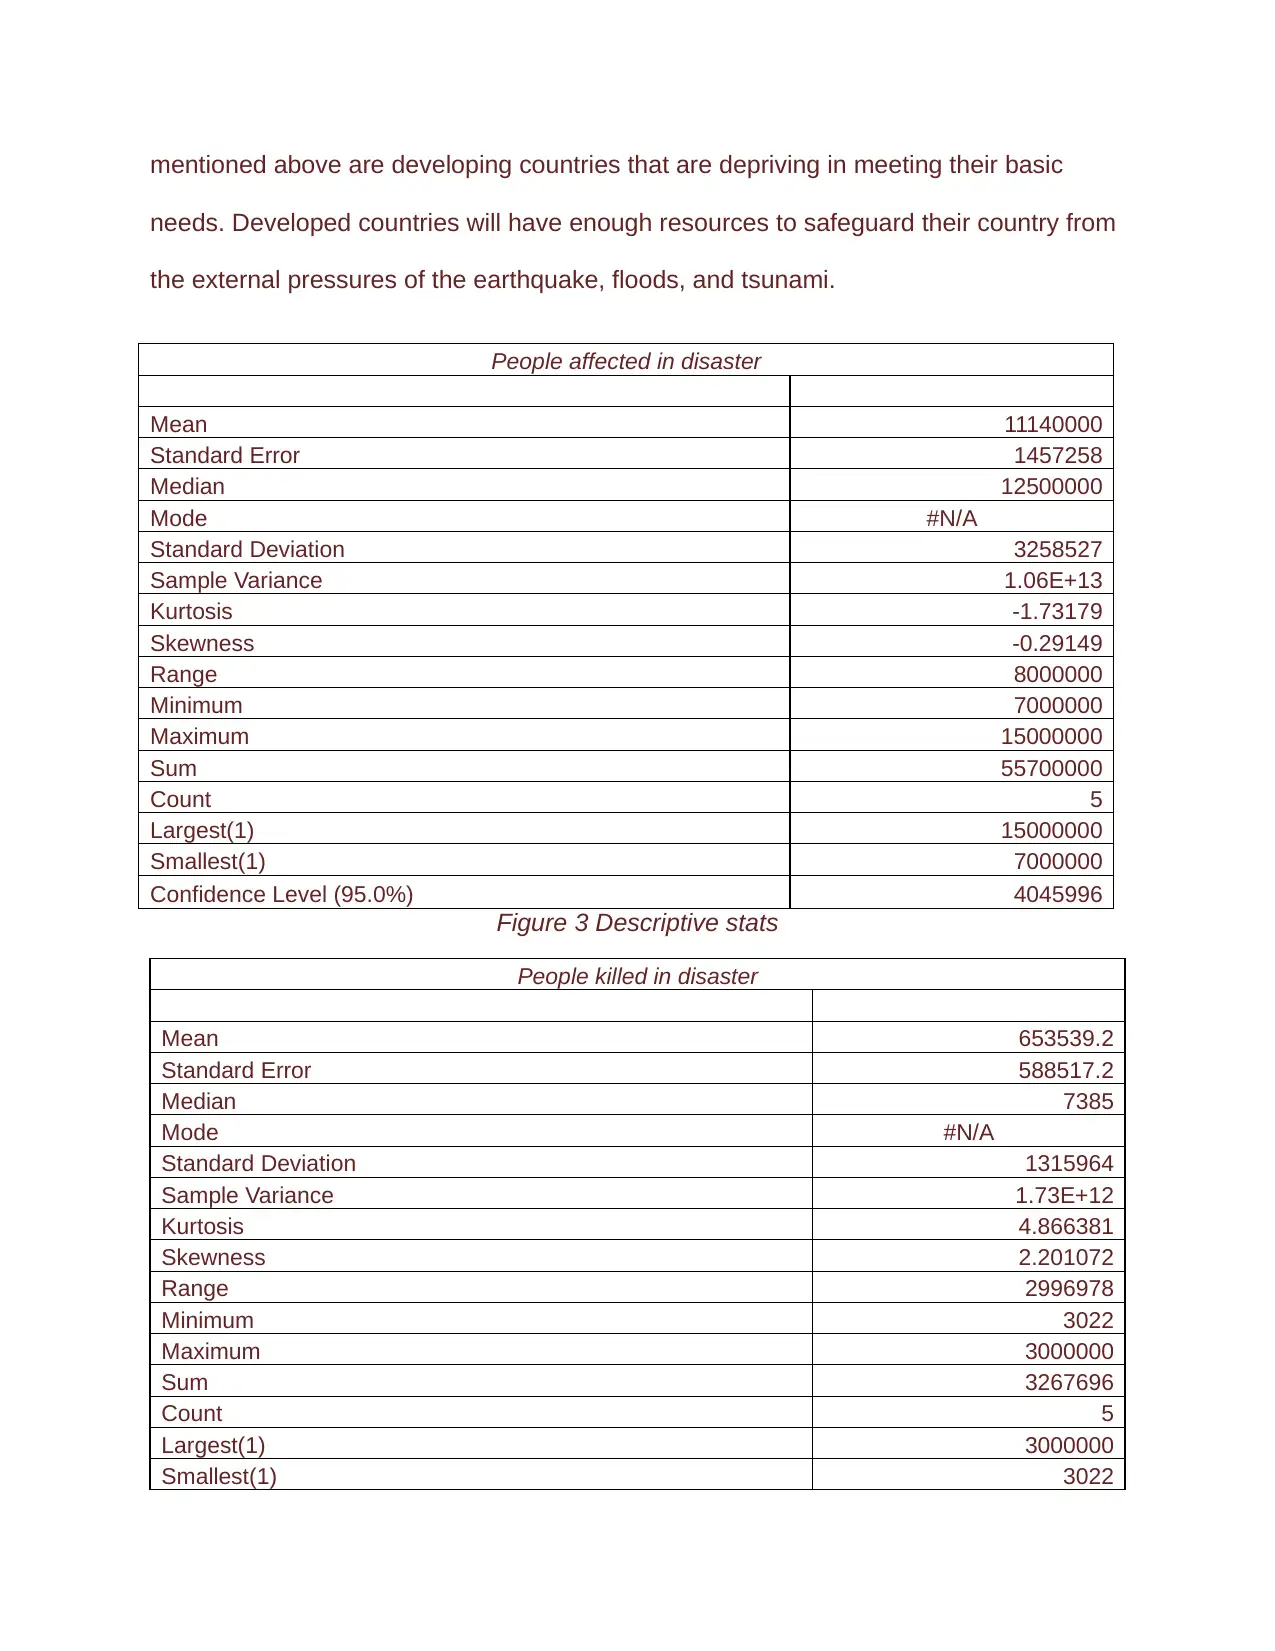
mentioned above are developing countries that are depriving in meeting their basic
needs. Developed countries will have enough resources to safeguard their country from
the external pressures of the earthquake, floods, and tsunami.
People affected in disaster
Mean 11140000
Standard Error 1457258
Median 12500000
Mode #N/A
Standard Deviation 3258527
Sample Variance 1.06E+13
Kurtosis -1.73179
Skewness -0.29149
Range 8000000
Minimum 7000000
Maximum 15000000
Sum 55700000
Count 5
Largest(1) 15000000
Smallest(1) 7000000
Confidence Level (95.0%) 4045996
Figure 3 Descriptive stats
People killed in disaster
Mean 653539.2
Standard Error 588517.2
Median 7385
Mode #N/A
Standard Deviation 1315964
Sample Variance 1.73E+12
Kurtosis 4.866381
Skewness 2.201072
Range 2996978
Minimum 3022
Maximum 3000000
Sum 3267696
Count 5
Largest(1) 3000000
Smallest(1) 3022
Paraphrase This Document
Need a fresh take? Get an instant paraphrase of this document with our AI Paraphraser
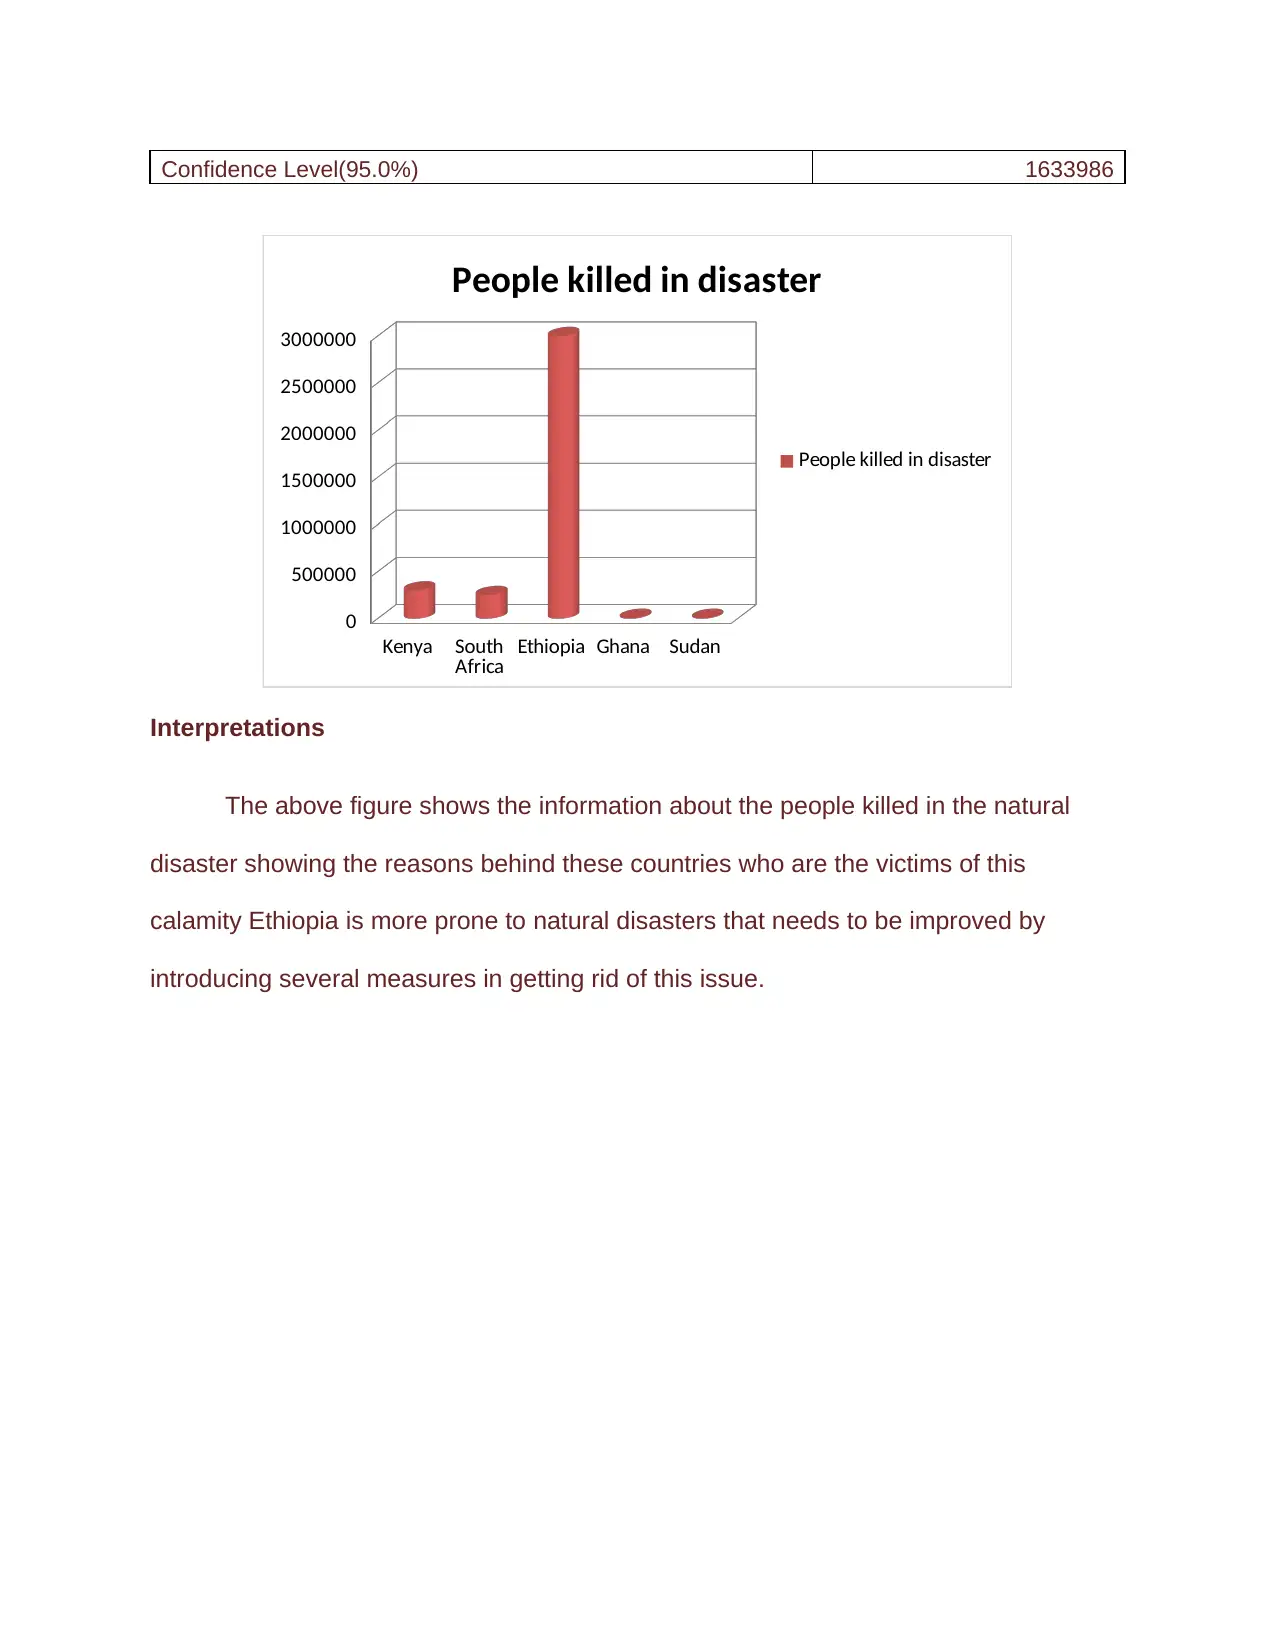
Confidence Level(95.0%) 1633986
Kenya South
Africa Ethiopia Ghana Sudan
0
500000
1000000
1500000
2000000
2500000
3000000
People killed in disaster
People killed in disaster
Interpretations
The above figure shows the information about the people killed in the natural
disaster showing the reasons behind these countries who are the victims of this
calamity Ethiopia is more prone to natural disasters that needs to be improved by
introducing several measures in getting rid of this issue.
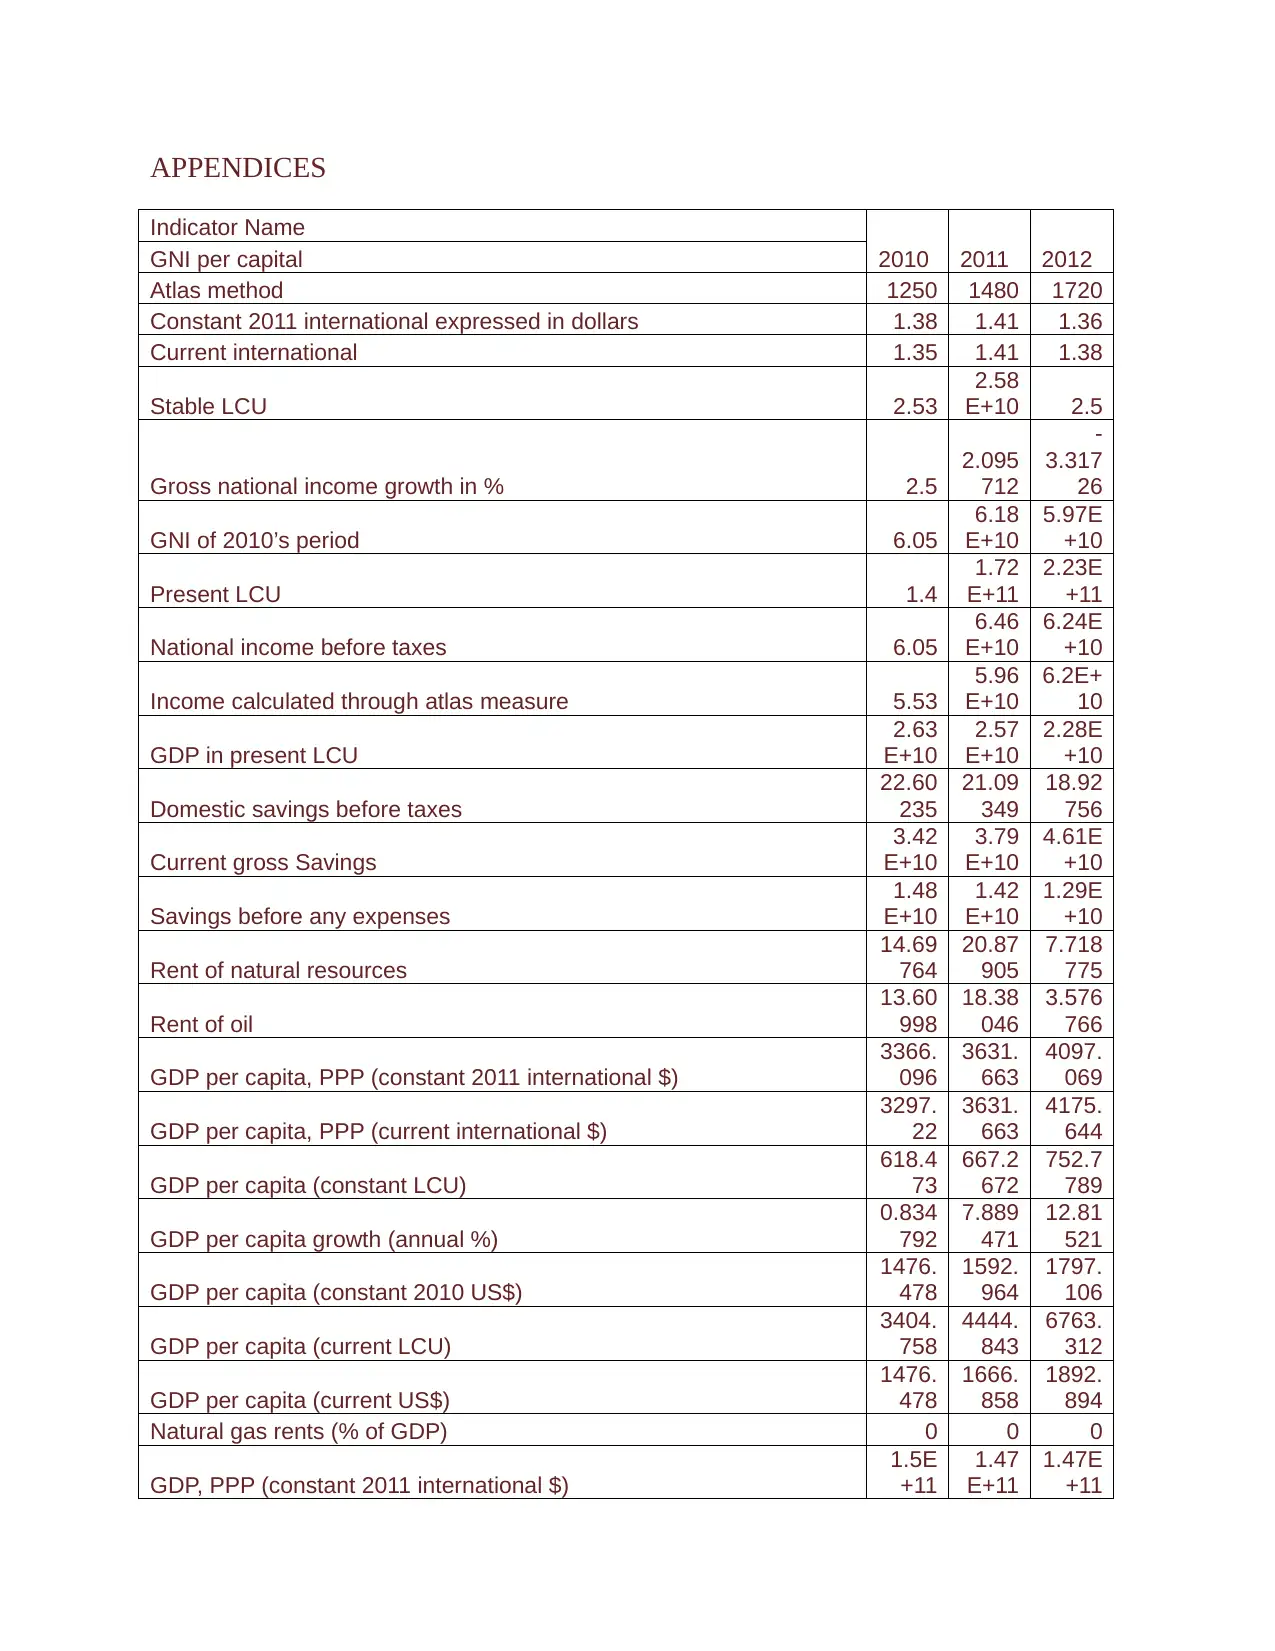
APPENDICES
Indicator Name
2010 2011 2012GNI per capital
Atlas method 1250 1480 1720
Constant 2011 international expressed in dollars 1.38 1.41 1.36
Current international 1.35 1.41 1.38
Stable LCU 2.53
2.58
E+10 2.5
Gross national income growth in % 2.5
2.095
712
-
3.317
26
GNI of 2010’s period 6.05
6.18
E+10
5.97E
+10
Present LCU 1.4
1.72
E+11
2.23E
+11
National income before taxes 6.05
6.46
E+10
6.24E
+10
Income calculated through atlas measure 5.53
5.96
E+10
6.2E+
10
GDP in present LCU
2.63
E+10
2.57
E+10
2.28E
+10
Domestic savings before taxes
22.60
235
21.09
349
18.92
756
Current gross Savings
3.42
E+10
3.79
E+10
4.61E
+10
Savings before any expenses
1.48
E+10
1.42
E+10
1.29E
+10
Rent of natural resources
14.69
764
20.87
905
7.718
775
Rent of oil
13.60
998
18.38
046
3.576
766
GDP per capita, PPP (constant 2011 international $)
3366.
096
3631.
663
4097.
069
GDP per capita, PPP (current international $)
3297.
22
3631.
663
4175.
644
GDP per capita (constant LCU)
618.4
73
667.2
672
752.7
789
GDP per capita growth (annual %)
0.834
792
7.889
471
12.81
521
GDP per capita (constant 2010 US$)
1476.
478
1592.
964
1797.
106
GDP per capita (current LCU)
3404.
758
4444.
843
6763.
312
GDP per capita (current US$)
1476.
478
1666.
858
1892.
894
Natural gas rents (% of GDP) 0 0 0
GDP, PPP (constant 2011 international $)
1.5E
+11
1.47
E+11
1.47E
+11
⊘ This is a preview!⊘
Do you want full access?
Subscribe today to unlock all pages.
Trusted by 1+ million students worldwide
GDP, PPP (current international $)
1.47
E+11
1.47
E+11
1.5E+
11
GDP (constant LCU)
2.75
E+10
2.7E
+10
2.71E
+10
GDP growth (annual %)
3.469
335
-
1.967
73
0.521
559
GDP (constant 2010 US$)
6.56
E+10
6.43
E+10
6.47E
+10
GDP: linked series (current LCU)
1.51
E+11
1.8E
+11
2.43E
+11
GDP (current LCU)
1.51
E+11
1.8E
+11
2.43E
+11
GDP (current US$)
6.56
E+10
6.73
E+10
6.81E
+10
Mineral rents (% of GDP)
1.087
662
1.279
921
2.720
916
Forest rents (% of GDP) 0
1.218
666
1.421
093
Gross value added at basic prices (GVA) (constant LCU)
2.55
E+10
2.6E
+10
2.66E
+10
Gross value added at basic prices (GVA) (constant 2010 US$)
6.22
E+10
6.34
E+10
6.51E
+10
Gross value added at basic prices (GVA) (current LCU)
1.43
E+11
1.72
E+11
1.99E
+11
Gross value added at basic prices (GVA) (current US$)
6.22
E+10
6.45
E+10
5.56E
+10
Discrepancy in expenditure estimate of GDP (constant LCU)
-
2.9E
+09
-
2.8E
+09
-
1.8E+
09
Discrepancy in expenditure estimate of GDP (current LCU)
-
4.5E
+09
-
4.5E
+09
1.48E
+10
GDP deflator: linked series (base year varies by country)
550.5
105
666.1
264
898.4
46
GDP deflator (base year varies by country)
550.5
105
666.1
264
898.4
46
Inflation, GDP deflator: linked series (annual %)
19.58
075
21.00
158
34.87
62
Inflation, GDP deflator (annual %)
19.58
075
21.00
158
34.87
62
Coal rents (% of GDP) 0 0 0
Exports as a capacity to import (constant LCU)
6.94
E+09
6.63
E+09
1.32E
+09
Adjusted net savings, excluding particulate emission damage (% of
GNI)
4.879
931 0.814833
Adjusted net savings, excluding particulate emission damage (current
US$)
3.15
E+09
5.09E+0
8
Adjusted net savings, including particulate emission damage (% of
GNI)
3.110
504 -0.98253
1.47
E+11
1.47
E+11
1.5E+
11
GDP (constant LCU)
2.75
E+10
2.7E
+10
2.71E
+10
GDP growth (annual %)
3.469
335
-
1.967
73
0.521
559
GDP (constant 2010 US$)
6.56
E+10
6.43
E+10
6.47E
+10
GDP: linked series (current LCU)
1.51
E+11
1.8E
+11
2.43E
+11
GDP (current LCU)
1.51
E+11
1.8E
+11
2.43E
+11
GDP (current US$)
6.56
E+10
6.73
E+10
6.81E
+10
Mineral rents (% of GDP)
1.087
662
1.279
921
2.720
916
Forest rents (% of GDP) 0
1.218
666
1.421
093
Gross value added at basic prices (GVA) (constant LCU)
2.55
E+10
2.6E
+10
2.66E
+10
Gross value added at basic prices (GVA) (constant 2010 US$)
6.22
E+10
6.34
E+10
6.51E
+10
Gross value added at basic prices (GVA) (current LCU)
1.43
E+11
1.72
E+11
1.99E
+11
Gross value added at basic prices (GVA) (current US$)
6.22
E+10
6.45
E+10
5.56E
+10
Discrepancy in expenditure estimate of GDP (constant LCU)
-
2.9E
+09
-
2.8E
+09
-
1.8E+
09
Discrepancy in expenditure estimate of GDP (current LCU)
-
4.5E
+09
-
4.5E
+09
1.48E
+10
GDP deflator: linked series (base year varies by country)
550.5
105
666.1
264
898.4
46
GDP deflator (base year varies by country)
550.5
105
666.1
264
898.4
46
Inflation, GDP deflator: linked series (annual %)
19.58
075
21.00
158
34.87
62
Inflation, GDP deflator (annual %)
19.58
075
21.00
158
34.87
62
Coal rents (% of GDP) 0 0 0
Exports as a capacity to import (constant LCU)
6.94
E+09
6.63
E+09
1.32E
+09
Adjusted net savings, excluding particulate emission damage (% of
GNI)
4.879
931 0.814833
Adjusted net savings, excluding particulate emission damage (current
US$)
3.15
E+09
5.09E+0
8
Adjusted net savings, including particulate emission damage (% of
GNI)
3.110
504 -0.98253
Paraphrase This Document
Need a fresh take? Get an instant paraphrase of this document with our AI Paraphraser
Adjusted net savings, including particulate emission damage (current
US$)
2.01
E+09 -6.1E+08
Adjusted net national income per capita (annual % growth) 1.564371
Adjusted net national income per capita (constant 2010 US$)
Adjusted net national income per capita (current US$)
1340.
204 1497.461
Adjusted net national income (annual % growth) -9.50325
Adjusted net national income (constant 2010 US$)
Adjusted net national income (current US$)
5.41
E+10
5.39E+1
0
Adjusted savings: net national savings (% of GNI)
18.05
381
16.21
119
2.770
22
Adjusted savings: net national savings (current US$)
1.09
E+10
1.05
E+10
1.73E
+09
Adjusted savings: gross savings (% of GNI)
19.62
512
19.46
634
12.90
932
Adjusted savings: natural resources depletion (% of GNI)
12.90
104 3.516256
External debt stocks, private nonguaranteed (PNG) (DOD, current
US$) 0 0 0
External debt stocks, long-term (DOD, current US$)
1.45
E+10
1.51
E+10
1.57E
+10
Use of IMF credit (DOD, current US$)
6.64
E+08
6.51
E+08
6.45E
+08
External debt stocks (% of GNI)
36.89
322
32.80
581
34.96
641
External debt stocks (% of exports of goods, services and primary
income)
189.4
174
191.8
603
424.6
466
Total change in external debt stocks (current US$)
1.21
E+09
-
1.1E
+09
6.44E
+08
External debt stocks, total (DOD, current US$)
2.23
E+10
2.12
E+10
2.18E
+10
PPG, bilateral concessional (DOD, current US$)
4.99
E+09
5.3E
+09
5.33E
+09
PPG, bilateral (DOD, current US$)
8.47
E+09
7.86
E+09
7.9E+
09
Concessional debt (% of total external debt)
36.58
61
40.76
69
39.68
25
External debt stocks, concessional (DOD, current US$)
8.17
E+09
8.63
E+09
8.66E
+09
PPG, private creditors (DIS, current US$) 0 0 0
PPG, other private creditors (DIS, current US$) 0 0 0
PNG, commercial banks and other creditors (DIS, current US$) 0 0 0
PNG, bonds (DIS, current US$) 0 0 0
PPG, commercial banks (DIS, current US$) 0 0 0
PPG, bonds (DIS, current US$) 0 0 0
PPG, official creditors (DIS, current US$)
9.35
E+08
7.93
E+08
3.19E
+08
PPG, multilateral concessional (DIS, current US$)
1.31
E+08
2.21
E+08
1.06E
+08
PPG, multilateral (DIS, current US$)
1.33
E+08
2.22
E+08
1.06E
+08
PPG, IDA (DIS, current US$) 0 0 0
PPG, IBRD (DIS, current US$) 0 0 0
IDA grants (current US$) 0 0 0
Disbursements on external debt, public and publicly guaranteed
(PPG) (DIS, current US$)
9.35
E+08
7.93
E+08
3.19E
+08
Disbursements on external debt, private nonguaranteed (PNG) (DIS,
current US$) 0 0 0
Disbursements on external debt, long-term (DIS, current US$)
9.35
E+08
7.93
E+08
3.19E
+08
Disbursements on external debt, long-term + IMF (DIS, current US$)
9.35
E+08
7.93
E+08
3.19E
+08
IMF purchases (DIS, current US$) 0 0 0
PPG, bilateral concessional (DIS, current US$)
7.49
E+08
5.63
E+08
1.93E
+08
PPG, bilateral (DIS, current US$)
8.02
E+08
5.71
E+08
2.12E
+08
Debt forgiveness or reduction (current US$) 0
-
8E+0
8
-
7629
930
Currency composition of PPG debt, U.S. dollars (%)
50.68
36
51.81
77
53.22
49
Currency composition of PPG debt, Pound sterling (%)
2.128
2
2.017
9
1.971
7
Currency composition of PPG debt, Swiss franc (%)
14.93
49
14.27
84
14.09
76
Currency composition of PPG debt, SDR (%)
1.076
7
1.050
6 0.951
Currency composition of PPG debt, all other currencies (%)
20.23
85
20.72
62
20.08
47
Currency composition of PPG debt, Multiple currencies (%)
0.962
9
0.928
9
0.874
3
Currency composition of PPG debt, Japanese yen (%)
0.690
3
0.692
6
0.571
3
Currency composition of PPG debt, French franc (%) 0 0 0
Currency composition of PPG debt, Euro (%)
9.284
9
8.487
7
8.224
5
Currency composition of PPG debt, Deutsche mark (%) 0 0 0
Commitments, private creditors (COM, current US$) 0 1000 0
Commitments, official creditors (COM, current US$)
8.47
E+08
5.57
E+08
1.83E
+08
⊘ This is a preview!⊘
Do you want full access?
Subscribe today to unlock all pages.
Trusted by 1+ million students worldwide
1 out of 40


Your All-in-One AI-Powered Toolkit for Academic Success.
+13062052269
info@desklib.com
Available 24*7 on WhatsApp / Email
![[object Object]](/_next/static/media/star-bottom.7253800d.svg)
Unlock your academic potential
Copyright © 2020–2026 A2Z Services. All Rights Reserved. Developed and managed by ZUCOL.