Multiple Regression Analysis: Identifying Key Unemployment Factors

Verified

Added on  2023/05/31

|5
|656
|347
Report
AI Summary
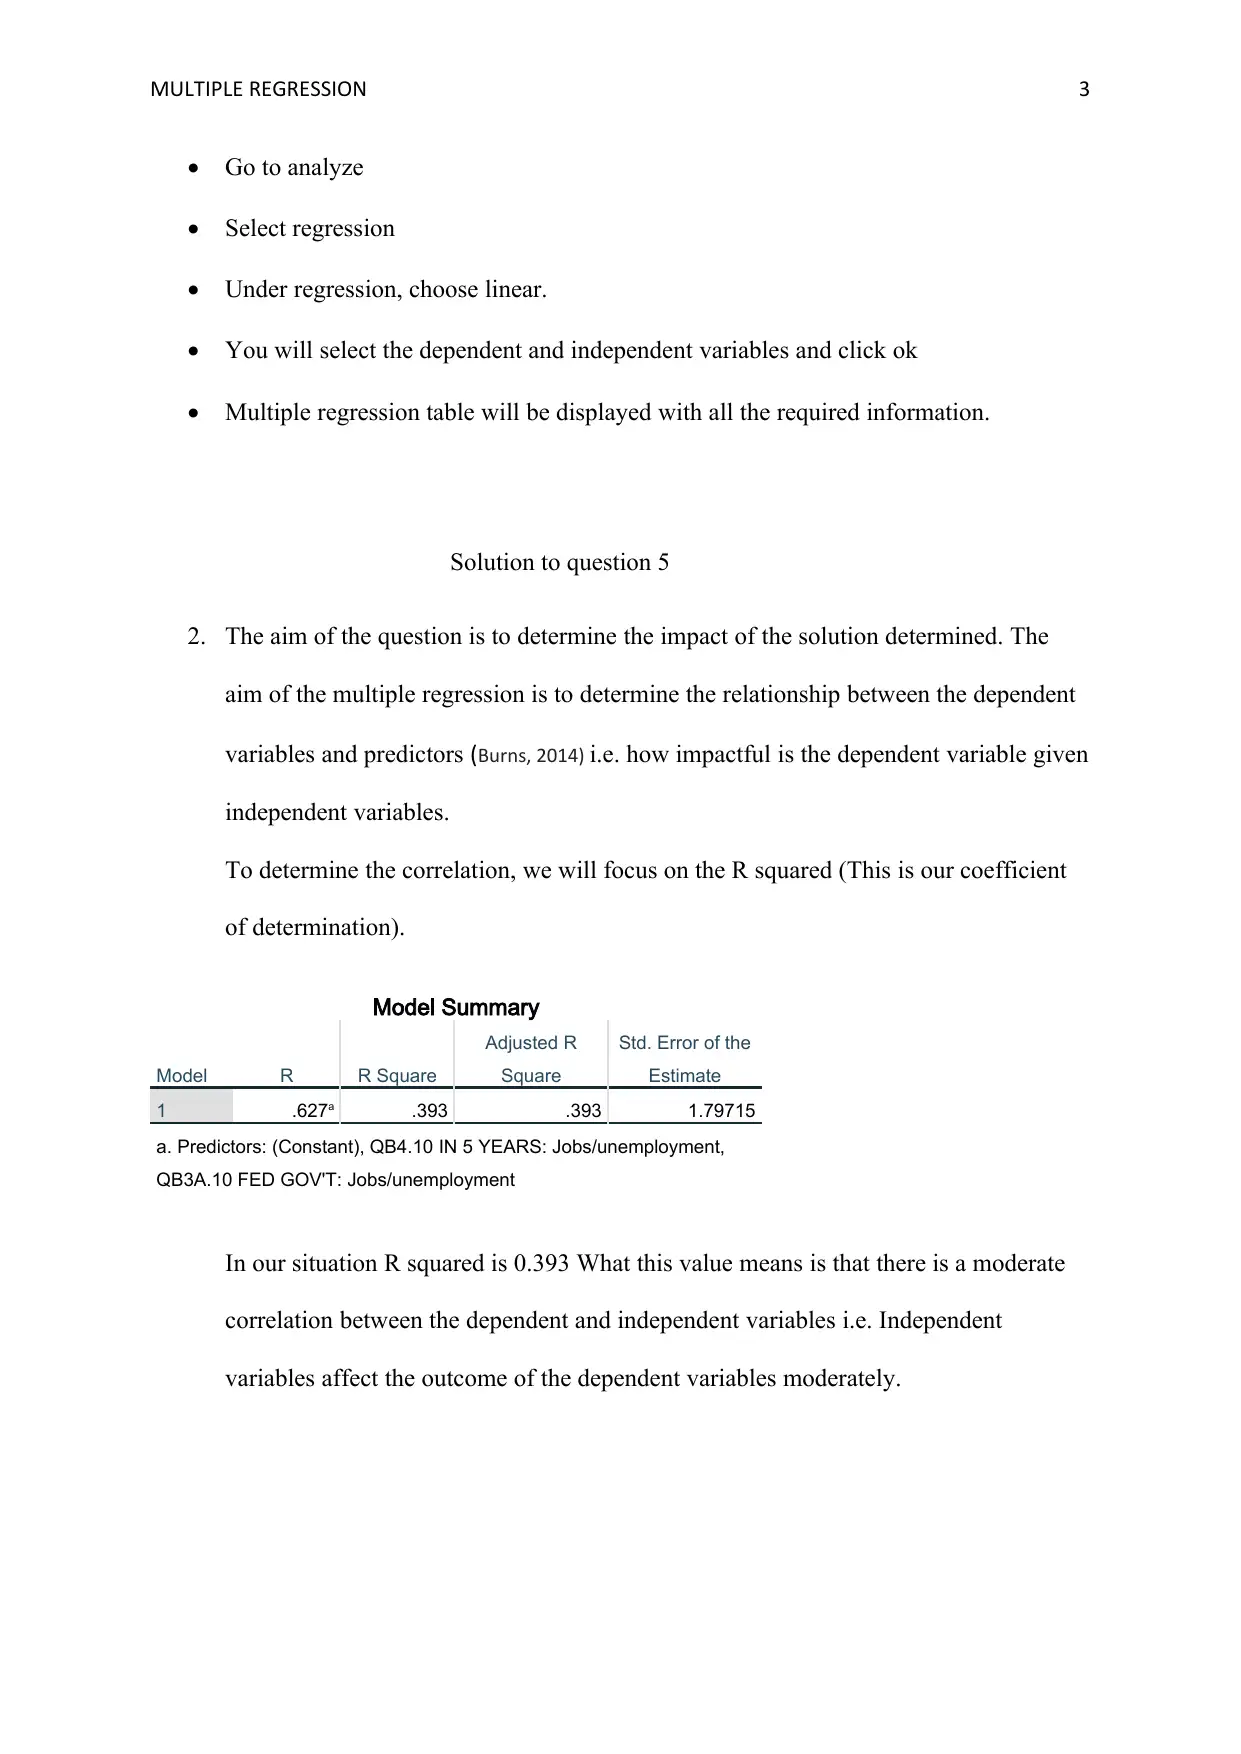
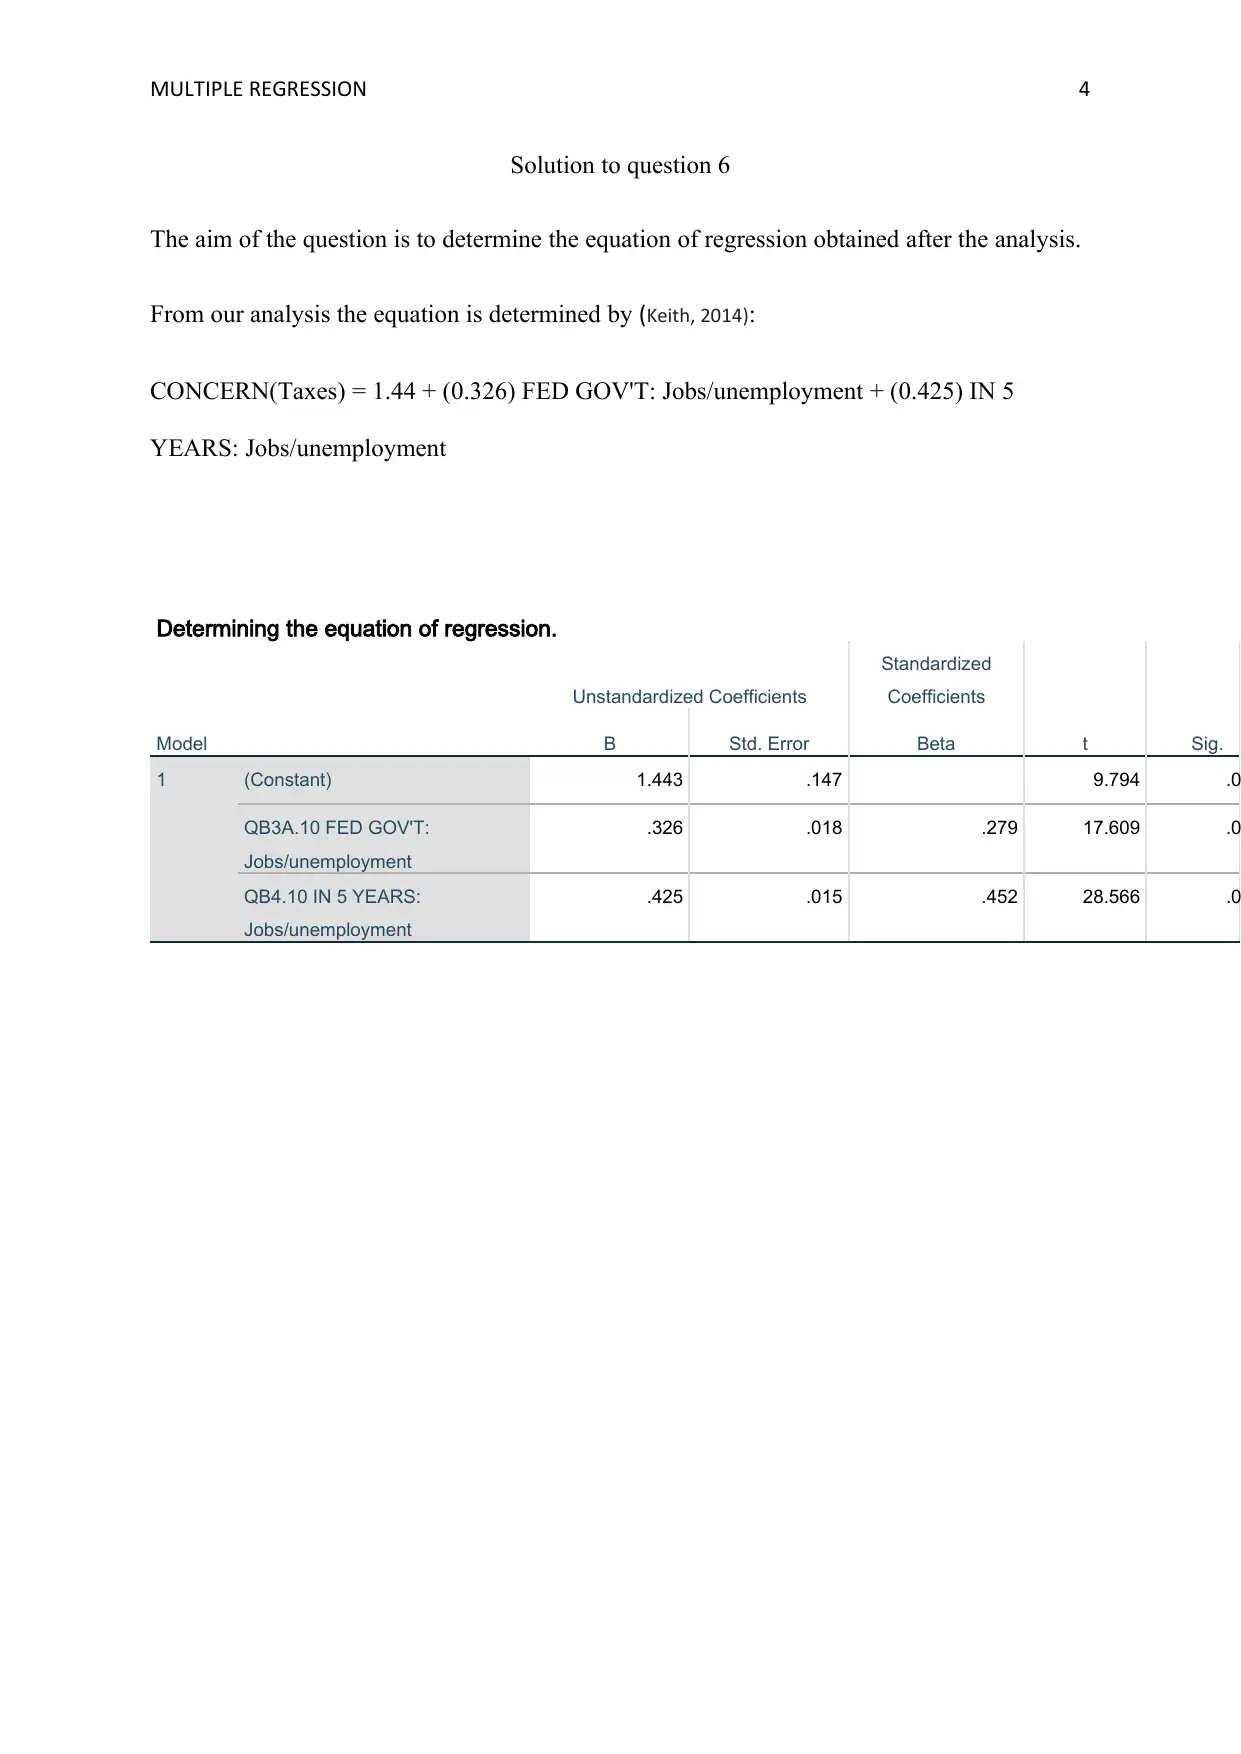
This report presents a multiple regression analysis examining the factors influencing public concern about unemployment. The dependent variable is the level of concern regarding jobs and unemployment, while independent variables include perceptions of the federal government's role in addressing unemployment and expectations about the job market in the next five years. The analysis, conducted using SPSS, reveals a moderate correlation between the independent and dependent variables, with the regression equation indicating the specific impact of each predictor on the level of concern. The R-squared value suggests that the independent variables explain a substantial portion of the variance in unemployment concern. The report details the methodology, results, and interpretation of the regression analysis, providing insights into the key drivers of public sentiment regarding unemployment.
Document Page
Running head: MULTIPLE REGRESSION 1
Multiple Regression
Student Name
Institution Affiliation
tabler-icon-diamond-filled.svg

Paraphrase This Document

Need a fresh take? Get an instant paraphrase of this document with our AI Paraphraser
Document Page
MULTIPLE REGRESSION 2
Solution to question 1
The aim of the question is to determine the dependent variable using the given data. The data given
has several columns. I decided to focus on the unemployment columns. My dependent variable is
given by:
1. Our dependent variable is (QB2.10) CONCERN: Jobs/unemployment, that is the
column titles QB2.10 on the data set.
Solution to question 2
The aim of the solution is to determine the research question. To come up with the research
question, you check the dependent variable and figure out the research question. From the
dependent variable is given by:
1. Research question:
The factors that influence the level of concern on unemployment
Solution to question 3
The aim of the question is to determine the independent variables that seem related to the
dependent variable we chose from the data. I chose the following to be our independent
variables. That is, the column titles QB3A and QB4.10
Independent variables to be included in the regression
a) QB3A.10 FED GOV'T: Jobs/unemployment
b) QB4.10 IN 5 YEARS: Jobs/unemployment
Solution to question 4
The aim of the question is to determine the multiple regression of the dependent and
independent variables. The question is done in SPSS software. This is the procedure of how
to do it (Lorenzo-Seva, 2010):
Document Page
MULTIPLE REGRESSION 3
Go to analyze
Select regression
Under regression, choose linear.
You will select the dependent and independent variables and click ok
Multiple regression table will be displayed with all the required information.
Solution to question 5
2. The aim of the question is to determine the impact of the solution determined. The
aim of the multiple regression is to determine the relationship between the dependent
variables and predictors (Burns, 2014) i.e. how impactful is the dependent variable given
independent variables.
To determine the correlation, we will focus on the R squared (This is our coefficient
of determination).
Model Summary
Model R R Square
Adjusted R
Square
Std. Error of the
Estimate
1 .627a .393 .393 1.79715
a. Predictors: (Constant), QB4.10 IN 5 YEARS: Jobs/unemployment,
QB3A.10 FED GOV'T: Jobs/unemployment
In our situation R squared is 0.393 What this value means is that there is a moderate
correlation between the dependent and independent variables i.e. Independent
variables affect the outcome of the dependent variables moderately.
Document Page
MULTIPLE REGRESSION 4
Solution to question 6
The aim of the question is to determine the equation of regression obtained after the analysis.
From our analysis the equation is determined by (Keith, 2014):
CONCERN(Taxes) = 1.44 + (0.326) FED GOV'T: Jobs/unemployment + (0.425) IN 5
YEARS: Jobs/unemployment
Determining the equation of regression.
Model
Unstandardized Coefficients
Standardized
Coefficients
t Sig.B Std. Error Beta
1 (Constant) 1.443 .147 9.794 .0
QB3A.10 FED GOV'T:
Jobs/unemployment
.326 .018 .279 17.609 .0
QB4.10 IN 5 YEARS:
Jobs/unemployment
.425 .015 .452 28.566 .0
tabler-icon-diamond-filled.svg

Paraphrase This Document

Need a fresh take? Get an instant paraphrase of this document with our AI Paraphraser
Document Page
MULTIPLE REGRESSION 5
Reference
Lorenzo-Seva, U., Ferrando, P. J., & Chico, E. (2010). Two SPSS programs for interpreting
multiple regression results. Behavior research methods, 42(1), 29-35.
Burns, A. C., Bush, R. F., & Sinha, N. (2014). Marketing research (Vol. 7). Harlow: Pearson.
Keith, T. Z. (2014). Multiple regression and beyond: An introduction to multiple regression
and structural equation modeling. Routledge.
chevron_up_icon
1 out of 5
circle_padding
hide_on_mobile
zoom_out_icon
[object Object]