Relationship of Nursing Job Satisfaction Factors: A Detailed Report
VerifiedAdded on 2022/08/13
|9
|1660
|51
Report
AI Summary
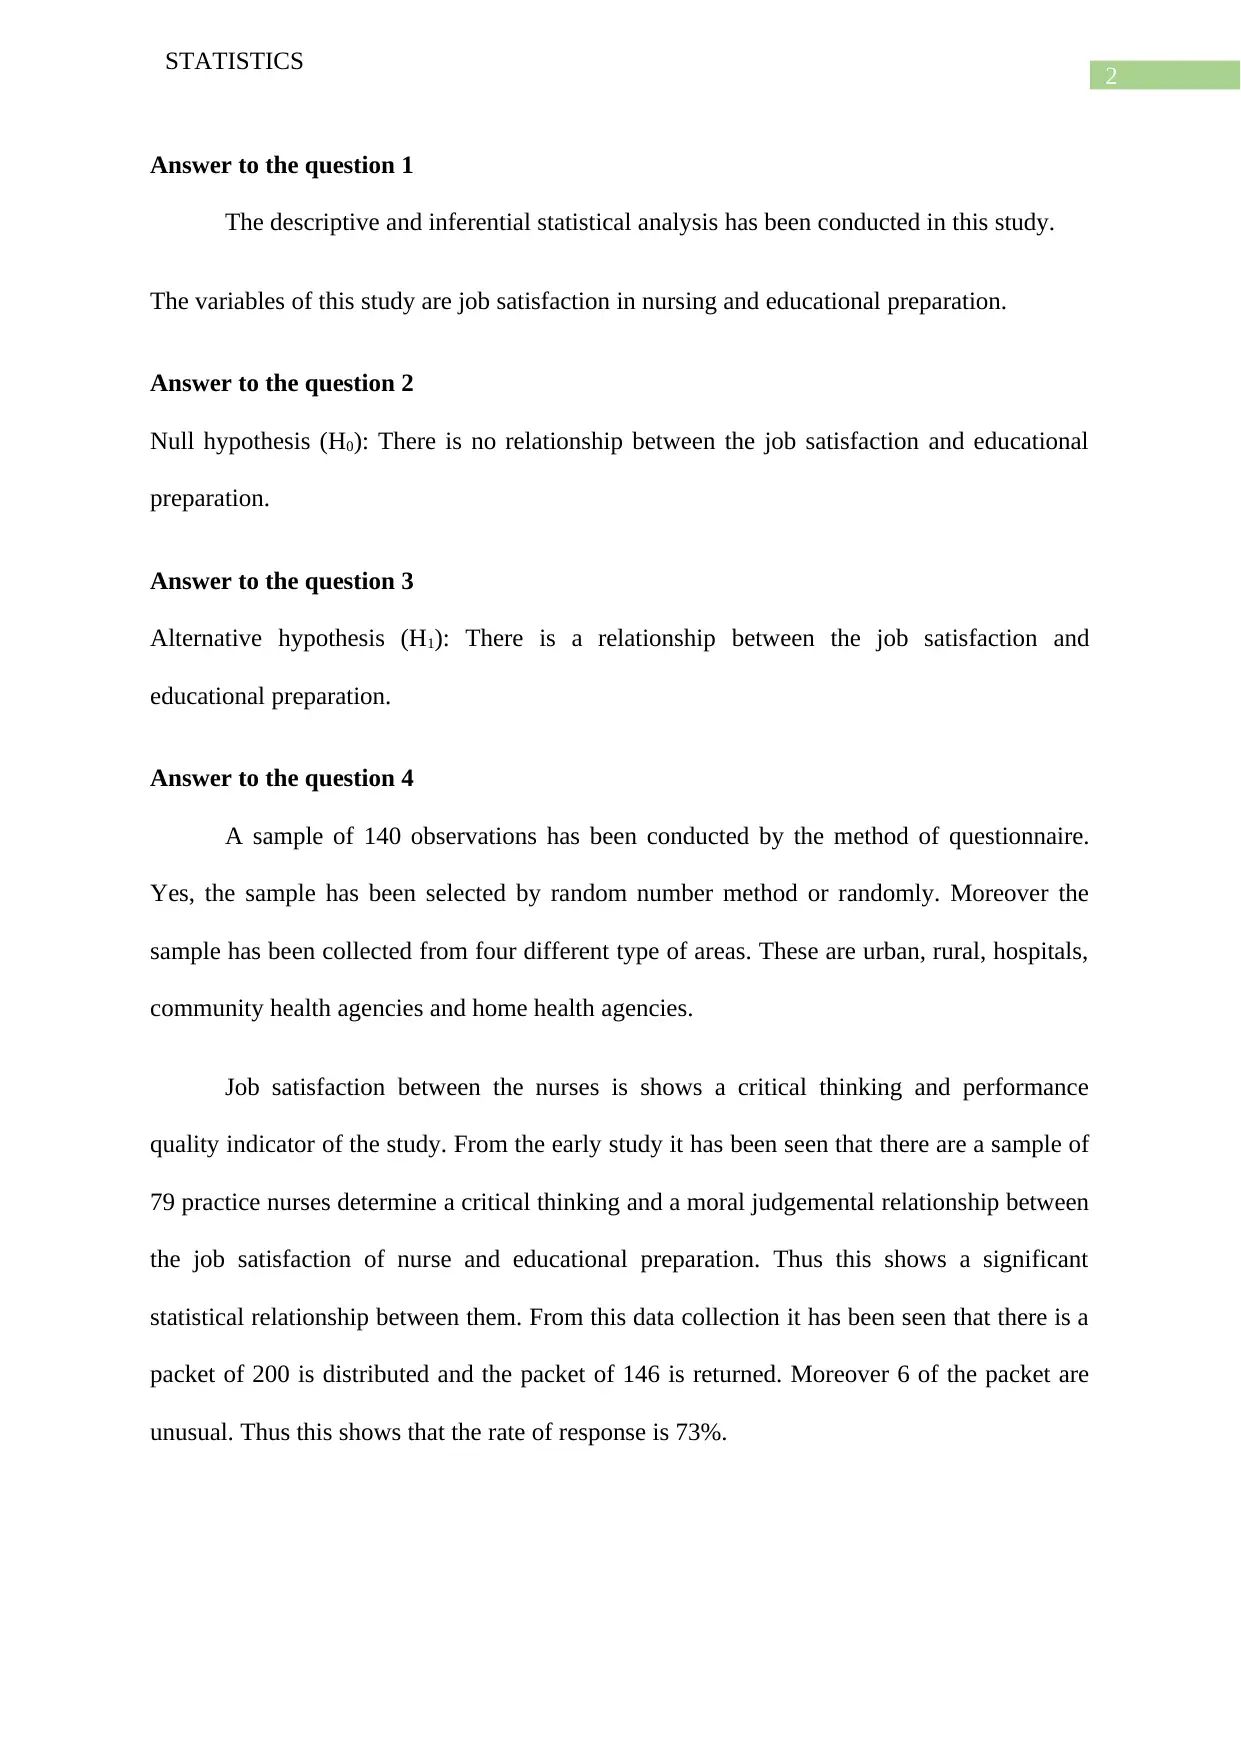
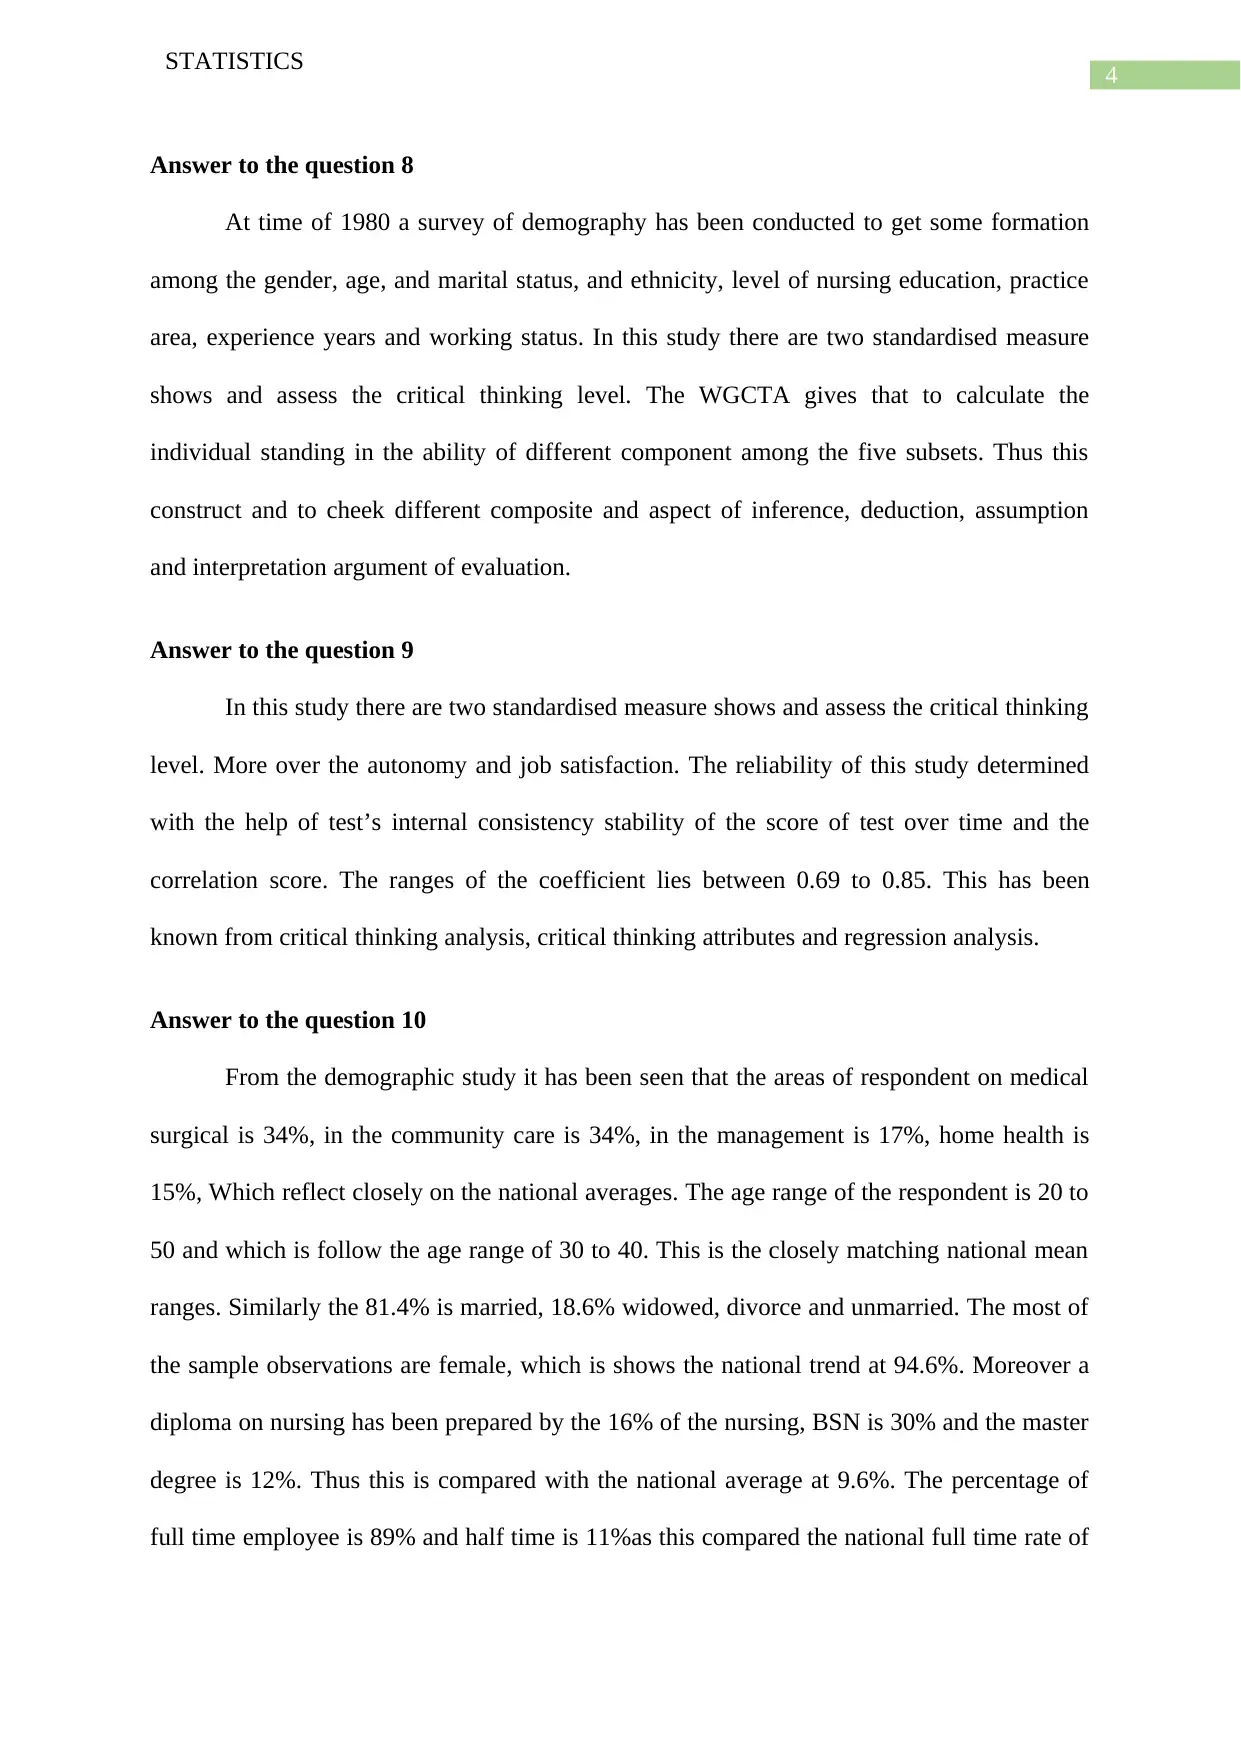
This report presents a descriptive correlational study examining factors influencing job satisfaction in nursing. The study investigates the relationships between educational preparation, autonomy, and critical thinking and their impact on job satisfaction among registered nurses. A sample of 140 nurses from various specialities completed questionnaires and standardized assessments. The study employed correlation and regression analyses to determine the relationships between variables and their influence on job satisfaction. Key findings revealed positive correlations between job satisfaction and autonomy, critical thinking, and educational preparation, while negative correlations were observed between job dissatisfiers and overall job satisfaction. The report emphasizes the importance of understanding these factors for staff retention and suggests the need for further research to enhance these elements in the nursing profession. The study also discusses the methodologies used, including the Watson-Glaser Critical Thinking Appraisal and Minnesota Satisfaction Questionnaire.

Running head: STATISTICS
Statistics
Name of the Student:
Name of the University:
Author note:
Statistics
Name of the Student:
Name of the University:
Author note:
Secure Best Marks with AI Grader
Need help grading? Try our AI Grader for instant feedback on your assignments.

1
STATISTICS
Table of Contents
Answer to the question 1............................................................................................................2
Answer to the question 2............................................................................................................2
Answer to the question 3............................................................................................................2
Answer to the question 4............................................................................................................2
Answer to the question 5............................................................................................................2
Answer to the question 6............................................................................................................3
Answer to the question 7............................................................................................................3
Answer to the question 8............................................................................................................3
Answer to the question 9............................................................................................................4
Answer to the question 10..........................................................................................................4
Answer to the question 11..........................................................................................................4
Answer to the question 12..........................................................................................................5
Answer to the question 13..........................................................................................................5
Answer to the question 14..........................................................................................................5
Answer to the question 15..........................................................................................................6
Answer to the question 16..........................................................................................................6
Bibliography...............................................................................................................................7

2
STATISTICS
Answer to the question 1
The descriptive and inferential statistical analysis has been conducted in this study.
The variables of this study are job satisfaction in nursing and educational preparation.
Answer to the question 2
Null hypothesis (H0): There is no relationship between the job satisfaction and educational
preparation.
Answer to the question 3
Alternative hypothesis (H1): There is a relationship between the job satisfaction and
educational preparation.
Answer to the question 4
A sample of 140 observations has been conducted by the method of questionnaire.
Yes, the sample has been selected by random number method or randomly. Moreover the
sample has been collected from four different type of areas. These are urban, rural, hospitals,
community health agencies and home health agencies.
Job satisfaction between the nurses is shows a critical thinking and performance
quality indicator of the study. From the early study it has been seen that there are a sample of
79 practice nurses determine a critical thinking and a moral judgemental relationship between
the job satisfaction of nurse and educational preparation. Thus this shows a significant
statistical relationship between them. From this data collection it has been seen that there is a
packet of 200 is distributed and the packet of 146 is returned. Moreover 6 of the packet are
unusual. Thus this shows that the rate of response is 73%.

3
STATISTICS
Answer to the question 5
The correlation analysis has been conducted in the pure positive sample of random
numbers. The criteria of inclusion of this study are current and registered nurses licensure,
getting a graduation degree from an accredited program of nursing this is either diploma and
or associate, baccalaureate, master degree of nursing, health care facility in employment, job
on the floor of nurse, manager, supervisor and director. This are the group which eliminate
from the analysis.
The result shows that there is a 34% respondent is medical surgical, 34% community
care, 17% management and 15% home health. Moreover the different education group shows
that there is no difference between them. The employment status shows the same. The
different education of nurses shows a non-significant result. Thus this result shows among the
ADN, BSN, diploma and master degree of nurses.
Answer to the question 6
The MSQ has been applied to determine the measure of autonomy and job
satisfaction. It is clear from this study that the MSQ is a 20 facet tool of job satisfaction.
There are more areas of pertinent includes the 20 subscales on achievement, advancement,
compensation, creativity, independence, recognitions and the condition of work. Thus this
can be measured with the help of likert scale.
Answer to the question 7
The measurement level on the total score of WGC- TA is an independent variable
critical thinking. The multiple regression analysis has been conducted to determine the
relationship among the single interval scale dependent variable and three independent
variables.
Secure Best Marks with AI Grader
Need help grading? Try our AI Grader for instant feedback on your assignments.

4
STATISTICS
Answer to the question 8
At time of 1980 a survey of demography has been conducted to get some formation
among the gender, age, and marital status, and ethnicity, level of nursing education, practice
area, experience years and working status. In this study there are two standardised measure
shows and assess the critical thinking level. The WGCTA gives that to calculate the
individual standing in the ability of different component among the five subsets. Thus this
construct and to cheek different composite and aspect of inference, deduction, assumption
and interpretation argument of evaluation.
Answer to the question 9
In this study there are two standardised measure shows and assess the critical thinking
level. More over the autonomy and job satisfaction. The reliability of this study determined
with the help of test’s internal consistency stability of the score of test over time and the
correlation score. The ranges of the coefficient lies between 0.69 to 0.85. This has been
known from critical thinking analysis, critical thinking attributes and regression analysis.
Answer to the question 10
From the demographic study it has been seen that the areas of respondent on medical
surgical is 34%, in the community care is 34%, in the management is 17%, home health is
15%, Which reflect closely on the national averages. The age range of the respondent is 20 to
50 and which is follow the age range of 30 to 40. This is the closely matching national mean
ranges. Similarly the 81.4% is married, 18.6% widowed, divorce and unmarried. The most of
the sample observations are female, which is shows the national trend at 94.6%. Moreover a
diploma on nursing has been prepared by the 16% of the nursing, BSN is 30% and the master
degree is 12%. Thus this is compared with the national average at 9.6%. The percentage of
full time employee is 89% and half time is 11%as this compared the national full time rate of

5
STATISTICS
employment is 80%. Hence this is conclude that the age data, experience years, gender,
marital status, ethnicity, education there is no differences among the different demographics’
group and the age factor.
Answer to the question 11
The study illustrate the autonomy, education and the critical thinking which is relate
significantly to the nurse job or work. This can be analysed with the help of multiple
regression model. Moreover the critical thinking shows that the contribution of job work
which is related to the education level and autonomy.
Answer to the question 12
A diploma on nursing has been prepared by the 16% of the nursing respondents, BSN
is 30% and the nurse which is master degree is 12%. Thus this is compared with the national
average at 9.6%. It has been seen that the difference on the specific practice areas which is
necessities on the advanced degree. Hence this is conclude that the age data, experience
years, gender, marital status, ethnicity, education there is no differences among the different
demographics’ group and the age factor. The analysis of Post-hoc Bonferroni has been
applied to correlate the indicated variables. The chi-square test shows that there is no
difference among the different level of education.
Answer to the question 13
To determine the relation between autonomy and job satisfaction Pearson moment
correlation has been applied. Moreover a multiple regression analysis has been performed to
determine relationship among a single interval scale dependent variable and the three
independent variable. The forward step wise multiple regression has been applied if the
independent variable is combined and this explain the variance of job satisfaction.

6
STATISTICS
Answer to the question 14
Null hypothesis: There is no relationship between the autonomy and the job satisfaction.
Alternative hypothesis: There is a relationship between the autonomy and the job satisfaction.
To determine the relationship between these two variable ANOVA test has been
conducted. From this test it has been seen that the Value of the P is 0.000 and the alpha has
been taken at 5%. Thus the value of the P is lesser than the alpha. Therefore the null
hypothesis of the test is rejected and at the same time the alternative hypothesis is accepted.
Thus this may be summarised that there is a relationship between the autonomy and the job
satisfaction.
Answer to the question 15
The correlation coefficient between the autonomy and job satisfaction is 0.538.
The correlation coefficient between the critical thinking and job satisfaction is 0.442.
The correlation coefficient between the education level and job satisfaction is 0896.
Answer to the question 16
The strongest relationship has been shown by the education level and job satisfaction,
because the correlation between these two variables is 0.89. This is too strong and positive.
Paraphrase This Document
Need a fresh take? Get an instant paraphrase of this document with our AI Paraphraser

7
STATISTICS
Bibliography
Al Maqbali, M.A., 2015. Factors that influence nurses’ job satisfaction: a literature review.
Nursing management, 22(2).
Cameron, A.C. and Trivedi, P.K., 2013. Regression analysis of count data (Vol. 53).
Cambridge university press.
Chatterjee, S. and Hadi, A.S., 2015. Regression analysis by example. John Wiley & Sons.
Feather, R., 2015. Tools assessing nurse manager behaviours and RN job satisfaction: a
review of the literature. Journal of Nursing Management, 23(6), pp.726-735.
Nassaji, H., 2015. Qualitative and descriptive research: Data type versus data analysis.

8
STATISTICS
STATISTICS
1 out of 9
Related Documents

Your All-in-One AI-Powered Toolkit for Academic Success.
+13062052269
info@desklib.com
Available 24*7 on WhatsApp / Email
Unlock your academic potential
© 2024 | Zucol Services PVT LTD | All rights reserved.