Determining Factors for Real Estate Business Growth in West England
VerifiedAdded on 2023/01/19
|18
|4523
|34
Report
AI Summary
This report investigates the factors influencing the thriving of the real estate business in the West of England. The study aimed to determine the effect of advertisement on house prices and to construct a model to predict selling prices. The research employed a stratified sampling technique, surveying experienced and non-experienced real estate professionals. Data analysis utilized Pearson’s correlation and multiple linear regression. The findings revealed a correlation between advertising expenditure and both selling and marked prices. Furthermore, a predictive model was developed, with the number of bathrooms and marked price identified as key predictors of selling price. The report provides a detailed analysis of the real estate market in the West of England, offering valuable insights into the factors that drive business success.

Determining factors affecting thriving of real estate business in West of England
Paraphrase This Document
Need a fresh take? Get an instant paraphrase of this document with our AI Paraphraser

Abstract
The main purpose of this study was to determine the factors affecting growth of real estate
business in the West of England. For the aforementioned objective to be met, the following
specific objectives were developed i.e. to assess the effect of advertisement on price of a house
and to construct a model that best predict the price of a house in West of England. The study
targeted experienced and non-experienced business personnel in real estate industry. Stratified
sampling technique was employed in the selection of thirty participants who participated in data
collection process. Pearson’s correlation and multiple linear regression were employed in the
analysis of data. Advertising expenditure was found to be correlated with both selling price and
marked price of a house. Additionally, the study constructed a model that could be used to best
predict the selling price of a house in West of England with the effective predictor variables
being number of bathrooms and the marked price.

Introduction
Real estate business is a lucrative business that many business investors dream of investing in, it
involves sale of land and buildings constructed on a particular piece of land1. The idea of
growing the real estate industry is being fulfilled by the partisans who heavily invest into it to
ensure that they maximize their profits in return. Despite some of the challenges faced in the
industry just like other industries, the industry is still of value and hence to the economy at
large2. Countries and states across the world get their revenues from real estate industry which
help in the sustenance and growth of economies3. In most cases, products in housing market such
as piece of land have had its value appreciating with time which attracted many investors into it
with the expectations that the value of their capital will increase with time. A number of factors
need to be put into consideration when venturing into real estate business which are not far from
factors considered when getting into any other businesses. Negotiation skills is the foremost
factor that the investors need to have since it will be used more often in bargaining the prices
with the willing and capable buyers. The seller is supposed to be moderate in his pricing so that
he does not overstate or understate the price and end up selling at a loss. Investors also consider
the population and the geographical location of the pieces of land and buildings. Densely
populated areas are believed to have positive effect in business performance and therefore those
getting into the industry should put their focus geographical location with relatively good
population4. This may not hold for all the prospective buyers as some particularly those looking
for residential places would prefer having their mansions in a less populated neighborhood for
their own reasons as opposed commercially based ones. Such preferences help in balancing the
business ecosystem in the industry to avoid congestion in one place. This study is then aimed at
⊘ This is a preview!⊘
Do you want full access?
Subscribe today to unlock all pages.
Trusted by 1+ million students worldwide

evaluating the possible factors that could be affecting the growth of real estate business in the
West of England.
Project Objectives
This study was guided and designed to help in determining factors affecting the thriving of real
estate business and thus had the following specific objectives to achieve at the end:
1. To assess the effect of advertisement on selling price of a house in West of England
2. To construct a model that best predict the selling price of a house in West of England
Project questions
This study was guided by a general question “what are the factors affecting the thriving of real
estate business in West of England?” This question was answered through the following specific
research questions:
1. What is the effect of advertisement on the price of a house in West of England?
2. How the constructed model best predicts the price of a house in West of England?
1234
1 Haslam and others "Real Estate Investment Trusts (REITS): defined real estate as dream of investors
that involves buying and selling of land and buildings. Accounting Forum 2015. Vol. 39. At p 4.
2 Squires and others, International approaches to real estate development. Routledge 2014. They stated
that real estate has value to the economy despite the challenges (2014) p 42.
3 Vanags, and others, they stated that real estate industry contribute to the growth of economies.
Procedia Engineering 57 (2013) p 1223-1229.
4 Sahut and others. Small Business Economics 42.4 (2014): p 663-668.
Paraphrase This Document
Need a fresh take? Get an instant paraphrase of this document with our AI Paraphraser
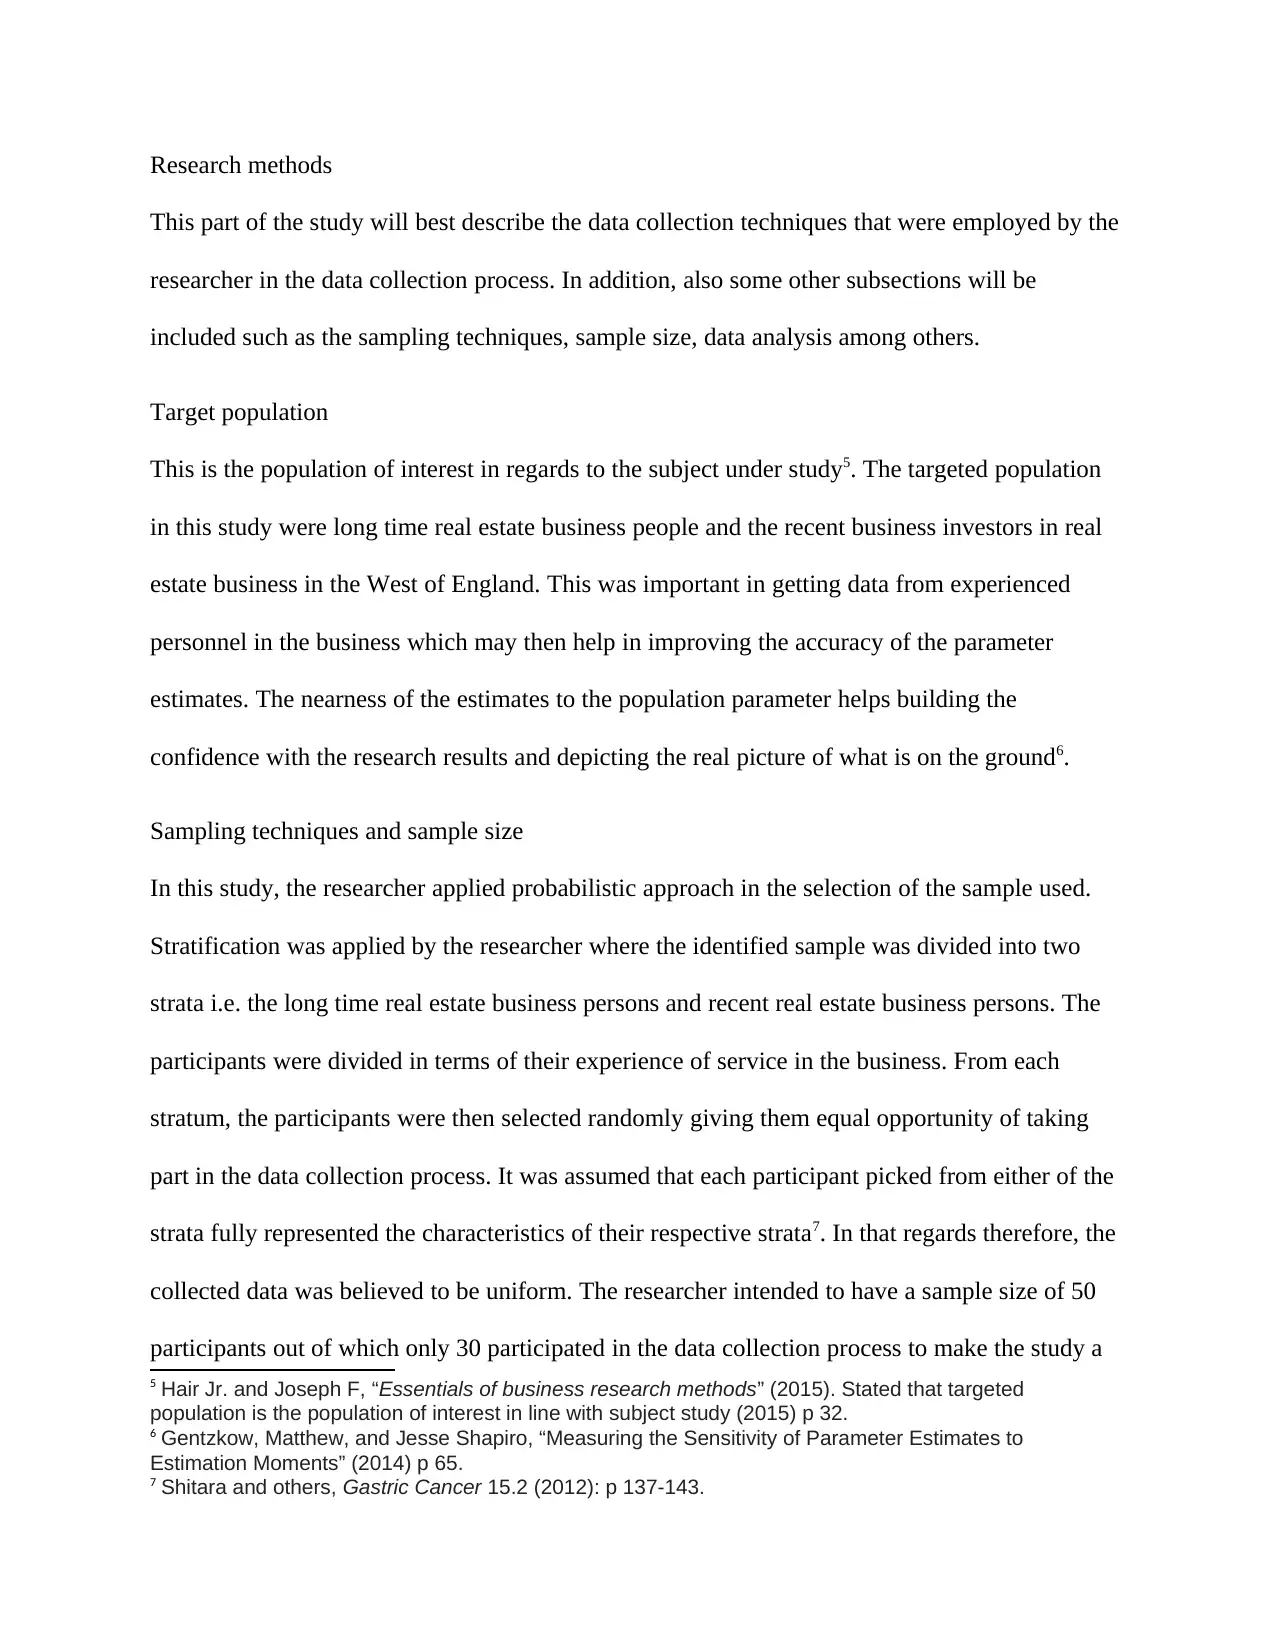
Research methods
This part of the study will best describe the data collection techniques that were employed by the
researcher in the data collection process. In addition, also some other subsections will be
included such as the sampling techniques, sample size, data analysis among others.
Target population
This is the population of interest in regards to the subject under study5. The targeted population
in this study were long time real estate business people and the recent business investors in real
estate business in the West of England. This was important in getting data from experienced
personnel in the business which may then help in improving the accuracy of the parameter
estimates. The nearness of the estimates to the population parameter helps building the
confidence with the research results and depicting the real picture of what is on the ground6.
Sampling techniques and sample size
In this study, the researcher applied probabilistic approach in the selection of the sample used.
Stratification was applied by the researcher where the identified sample was divided into two
strata i.e. the long time real estate business persons and recent real estate business persons. The
participants were divided in terms of their experience of service in the business. From each
stratum, the participants were then selected randomly giving them equal opportunity of taking
part in the data collection process. It was assumed that each participant picked from either of the
strata fully represented the characteristics of their respective strata7. In that regards therefore, the
collected data was believed to be uniform. The researcher intended to have a sample size of 50
participants out of which only 30 participated in the data collection process to make the study a
5 Hair Jr. and Joseph F, “Essentials of business research methods” (2015). Stated that targeted
population is the population of interest in line with subject study (2015) p 32.
6 Gentzkow, Matthew, and Jesse Shapiro, “Measuring the Sensitivity of Parameter Estimates to
Estimation Moments” (2014) p 65.
7 Shitara and others, Gastric Cancer 15.2 (2012): p 137-143.
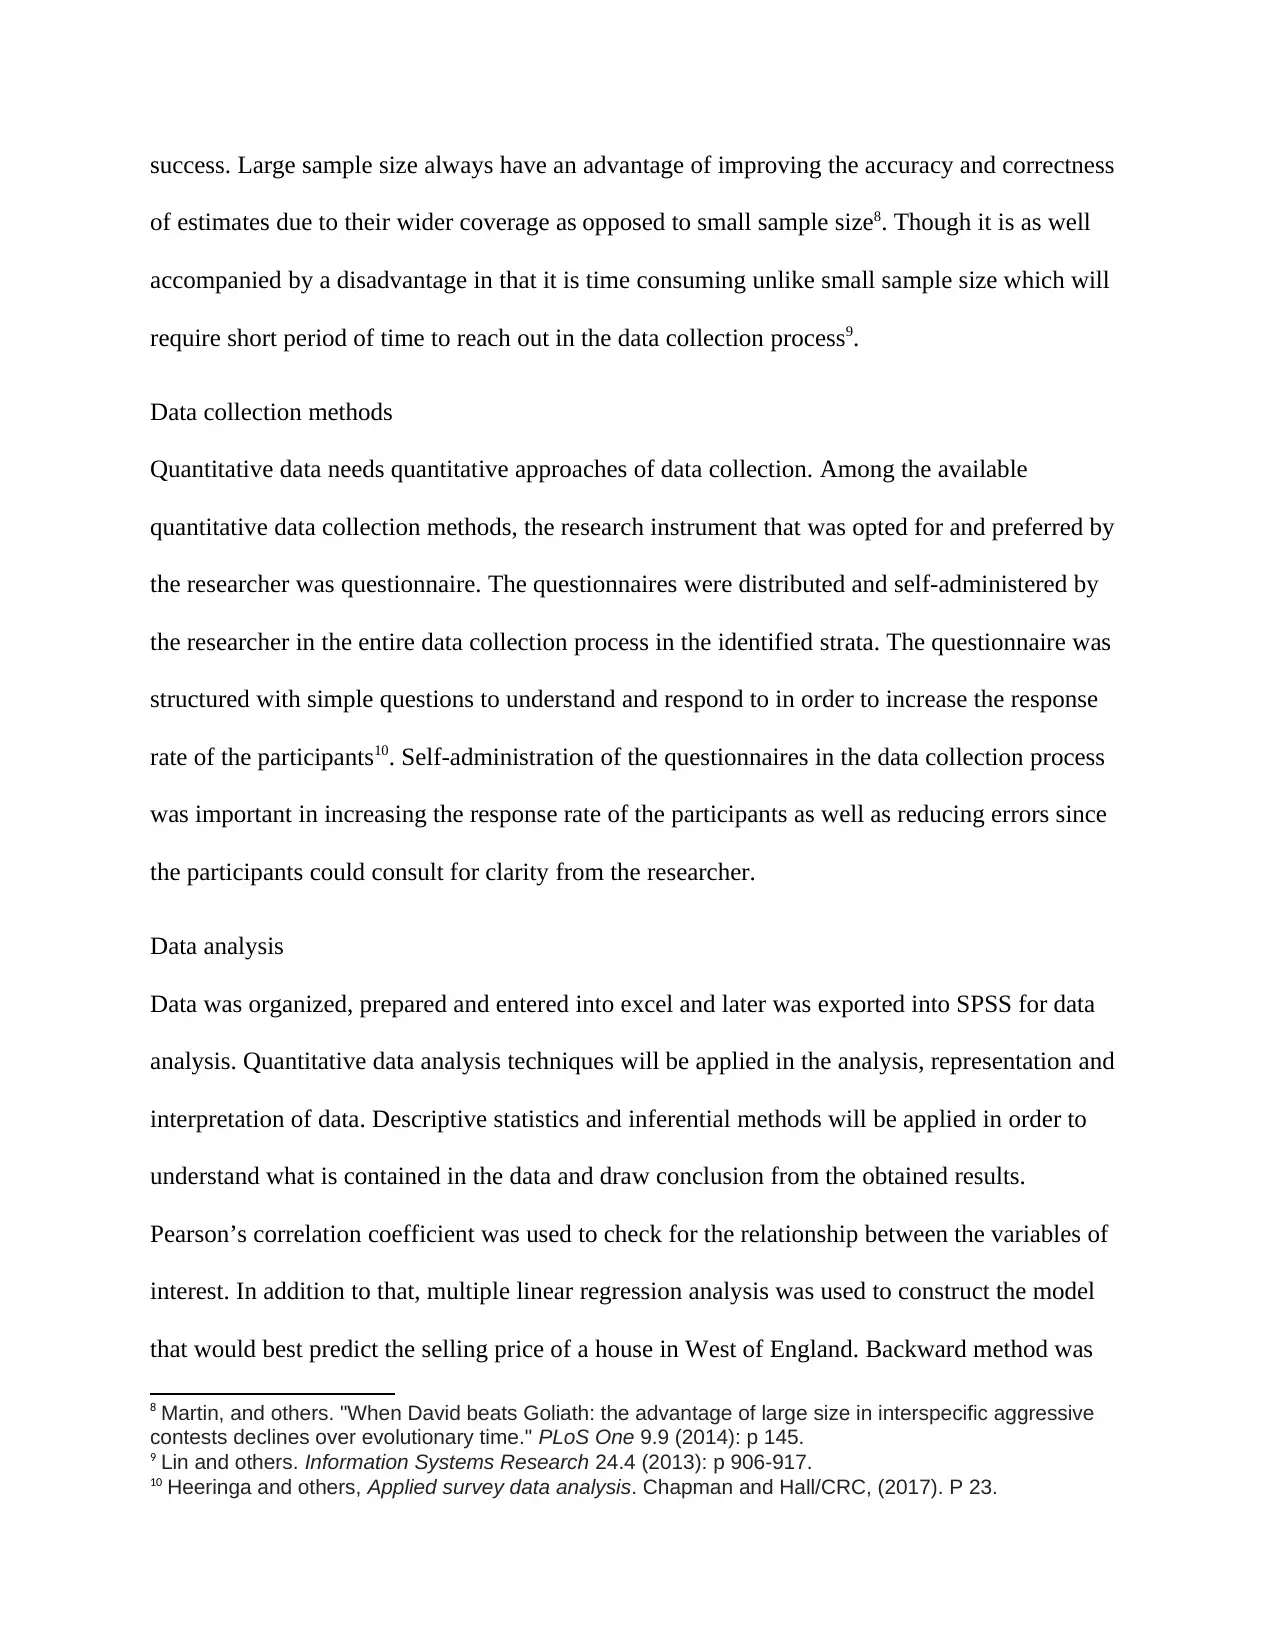
success. Large sample size always have an advantage of improving the accuracy and correctness
of estimates due to their wider coverage as opposed to small sample size8. Though it is as well
accompanied by a disadvantage in that it is time consuming unlike small sample size which will
require short period of time to reach out in the data collection process9.
Data collection methods
Quantitative data needs quantitative approaches of data collection. Among the available
quantitative data collection methods, the research instrument that was opted for and preferred by
the researcher was questionnaire. The questionnaires were distributed and self-administered by
the researcher in the entire data collection process in the identified strata. The questionnaire was
structured with simple questions to understand and respond to in order to increase the response
rate of the participants10. Self-administration of the questionnaires in the data collection process
was important in increasing the response rate of the participants as well as reducing errors since
the participants could consult for clarity from the researcher.
Data analysis
Data was organized, prepared and entered into excel and later was exported into SPSS for data
analysis. Quantitative data analysis techniques will be applied in the analysis, representation and
interpretation of data. Descriptive statistics and inferential methods will be applied in order to
understand what is contained in the data and draw conclusion from the obtained results.
Pearson’s correlation coefficient was used to check for the relationship between the variables of
interest. In addition to that, multiple linear regression analysis was used to construct the model
that would best predict the selling price of a house in West of England. Backward method was
8 Martin, and others. "When David beats Goliath: the advantage of large size in interspecific aggressive
contests declines over evolutionary time." PLoS One 9.9 (2014): p 145.
9 Lin and others. Information Systems Research 24.4 (2013): p 906-917.
10 Heeringa and others, Applied survey data analysis. Chapman and Hall/CRC, (2017). P 23.
⊘ This is a preview!⊘
Do you want full access?
Subscribe today to unlock all pages.
Trusted by 1+ million students worldwide
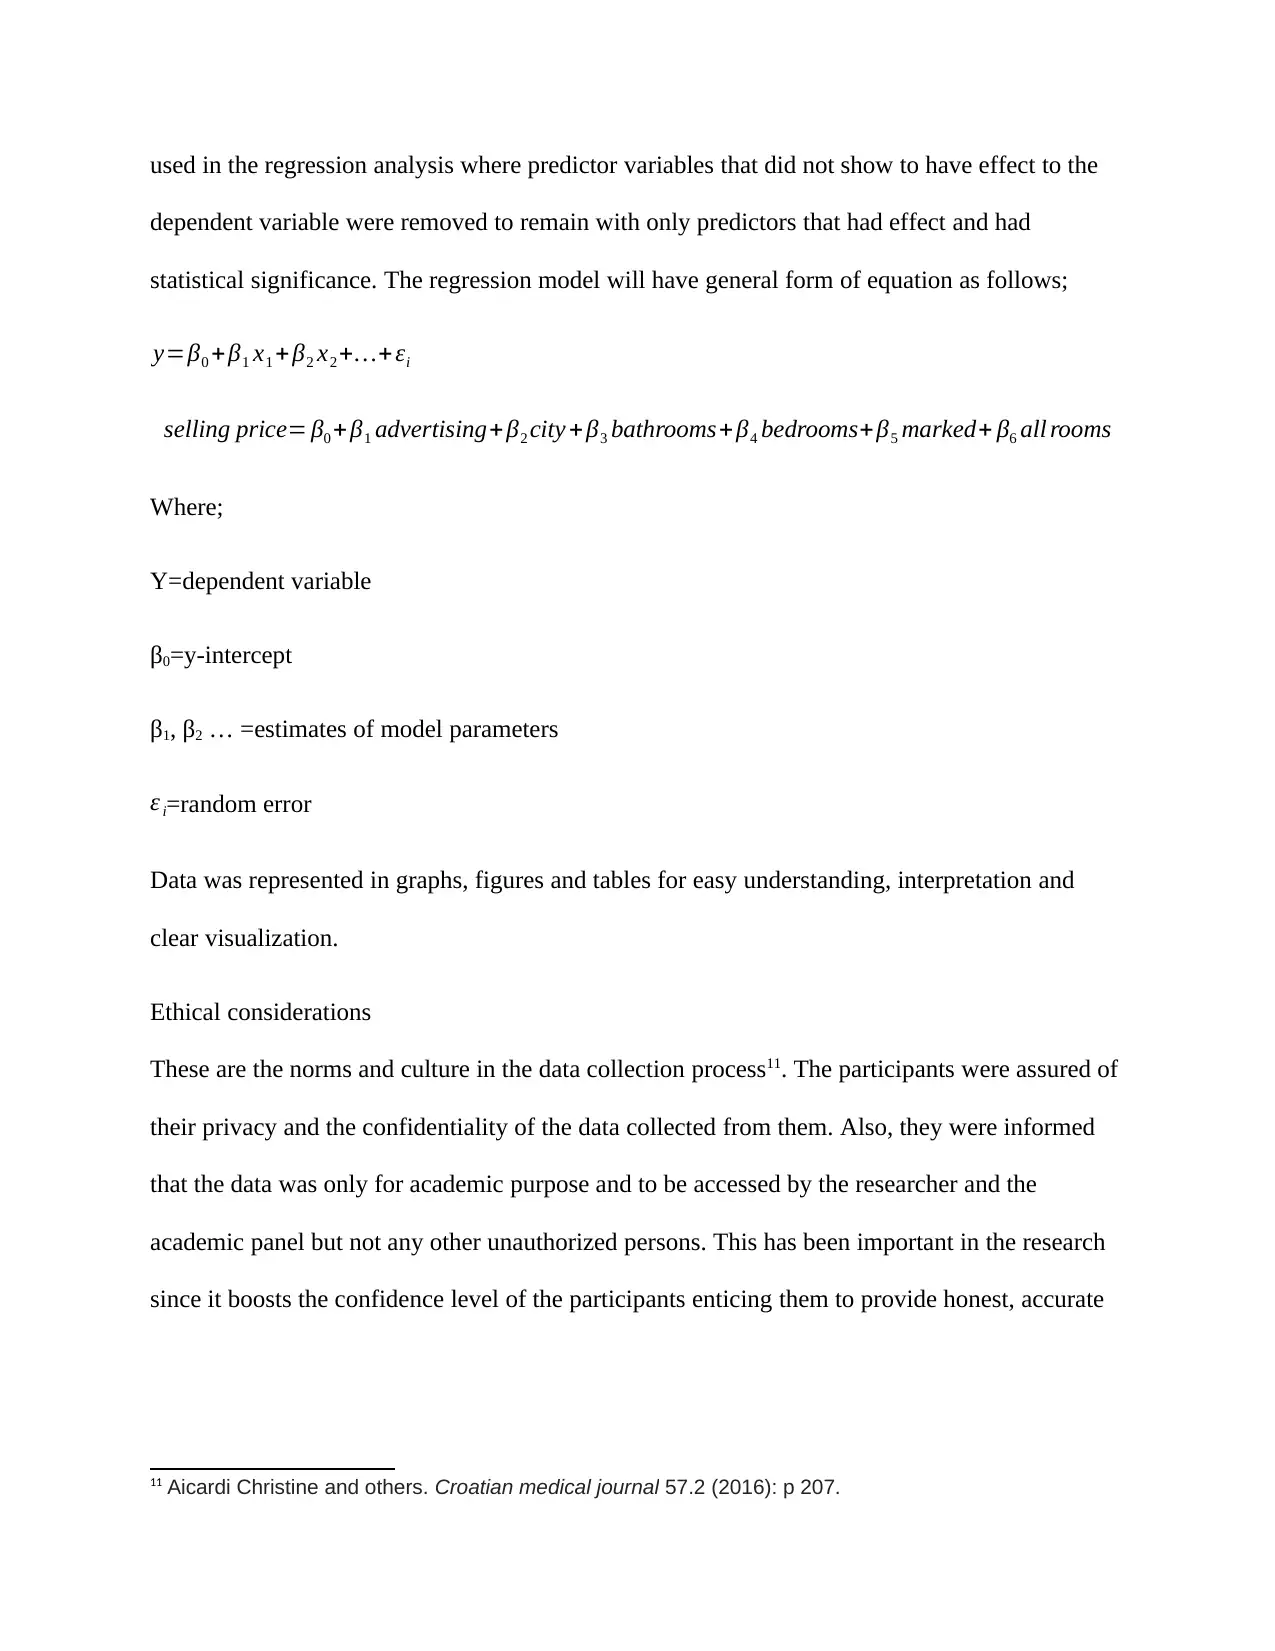
used in the regression analysis where predictor variables that did not show to have effect to the
dependent variable were removed to remain with only predictors that had effect and had
statistical significance. The regression model will have general form of equation as follows;
y=β0 +β1 x1 + β2 x2 +…+ εi
selling price= β0 + β1 advertising+ β2 city + β3 bathrooms+ β4 bedrooms+β5 marked+ β6 all rooms
Where;
Y=dependent variable
β0=y-intercept
β1, β2 … =estimates of model parameters
ε i=random error
Data was represented in graphs, figures and tables for easy understanding, interpretation and
clear visualization.
Ethical considerations
These are the norms and culture in the data collection process11. The participants were assured of
their privacy and the confidentiality of the data collected from them. Also, they were informed
that the data was only for academic purpose and to be accessed by the researcher and the
academic panel but not any other unauthorized persons. This has been important in the research
since it boosts the confidence level of the participants enticing them to provide honest, accurate
11 Aicardi Christine and others. Croatian medical journal 57.2 (2016): p 207.
Paraphrase This Document
Need a fresh take? Get an instant paraphrase of this document with our AI Paraphraser

and reliable data that will help in obtaining results that were dependable for the success of the
project12.
Results and discussion
This is one of the most fundamental parts of research project as it provide values and figures that
support the research work done13. In this section, the collected data will be represented in tables
and figures and also discussed and interpreted to draw the hidden meaning from the data. This
research project was developed to assess the effect of advertisement on price of a house in West
of England and to construct a model that best predict the price of a house in West of England.
Data was collected in regards to meeting the aforementioned objectives for the success and to
uphold the value of the study project.
Assessing the effect of advertisement on the price of a house
In order to meet the above objective, the following hypotheses were formulated to test for the
relationship between advertising expenditure and marked price of the house and finally the
selling price of the house.
Hypothesis
H0: There is no relationship between advertising expenditure and the selling price and market
price of a house in West of England.
12 Sekaran, Uma, and Roger Bougie. Research methods for business: A skill building approach (2016). P
87
13 Elo and others. "Qualitative content analysis: A focus on trustworthiness." SAGE open 4.1 (2014); p 30
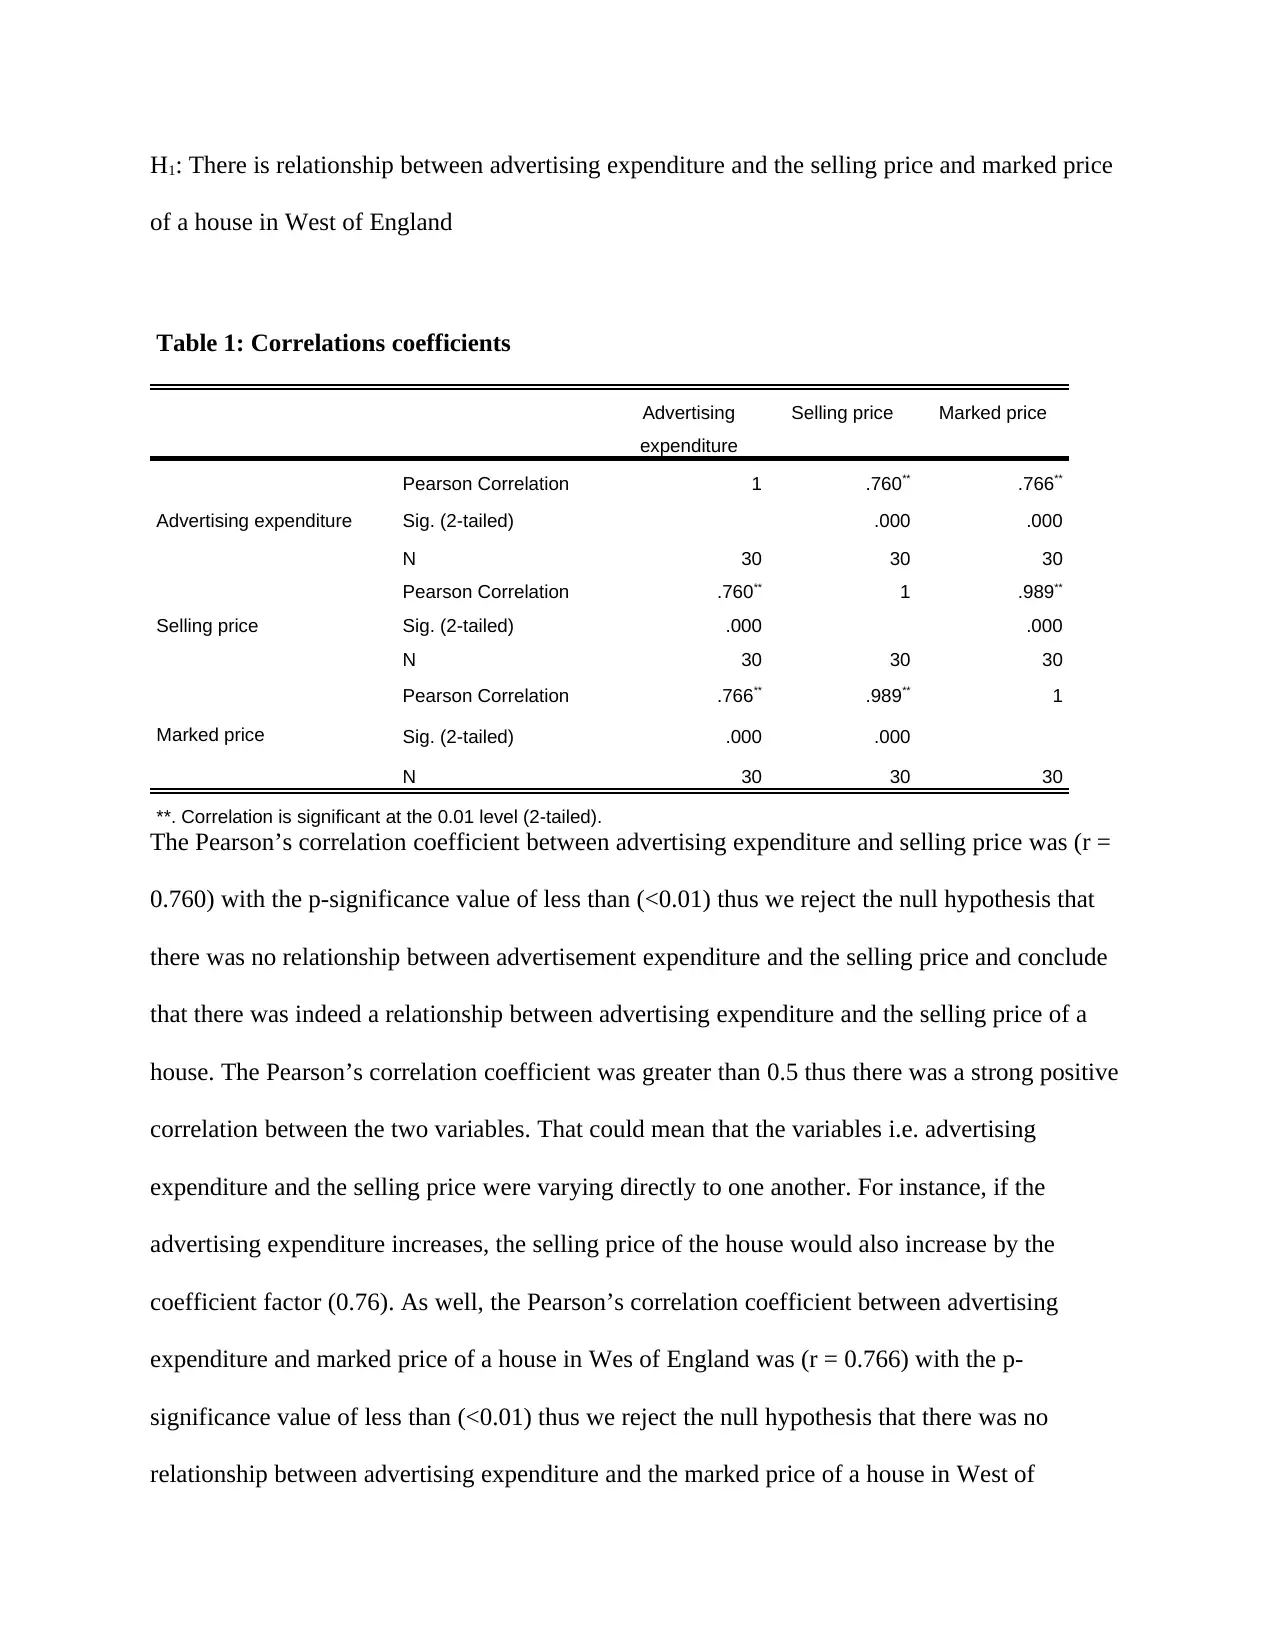
H1: There is relationship between advertising expenditure and the selling price and marked price
of a house in West of England
Table 1: Correlations coefficients
Advertising
expenditure
Selling price Marked price
Advertising expenditure
Pearson Correlation 1 .760** .766**
Sig. (2-tailed) .000 .000
N 30 30 30
Selling price
Pearson Correlation .760** 1 .989**
Sig. (2-tailed) .000 .000
N 30 30 30
Marked price
Pearson Correlation .766** .989** 1
Sig. (2-tailed) .000 .000
N 30 30 30
**. Correlation is significant at the 0.01 level (2-tailed).
The Pearson’s correlation coefficient between advertising expenditure and selling price was (r =
0.760) with the p-significance value of less than (<0.01) thus we reject the null hypothesis that
there was no relationship between advertisement expenditure and the selling price and conclude
that there was indeed a relationship between advertising expenditure and the selling price of a
house. The Pearson’s correlation coefficient was greater than 0.5 thus there was a strong positive
correlation between the two variables. That could mean that the variables i.e. advertising
expenditure and the selling price were varying directly to one another. For instance, if the
advertising expenditure increases, the selling price of the house would also increase by the
coefficient factor (0.76). As well, the Pearson’s correlation coefficient between advertising
expenditure and marked price of a house in Wes of England was (r = 0.766) with the p-
significance value of less than (<0.01) thus we reject the null hypothesis that there was no
relationship between advertising expenditure and the marked price of a house in West of
⊘ This is a preview!⊘
Do you want full access?
Subscribe today to unlock all pages.
Trusted by 1+ million students worldwide
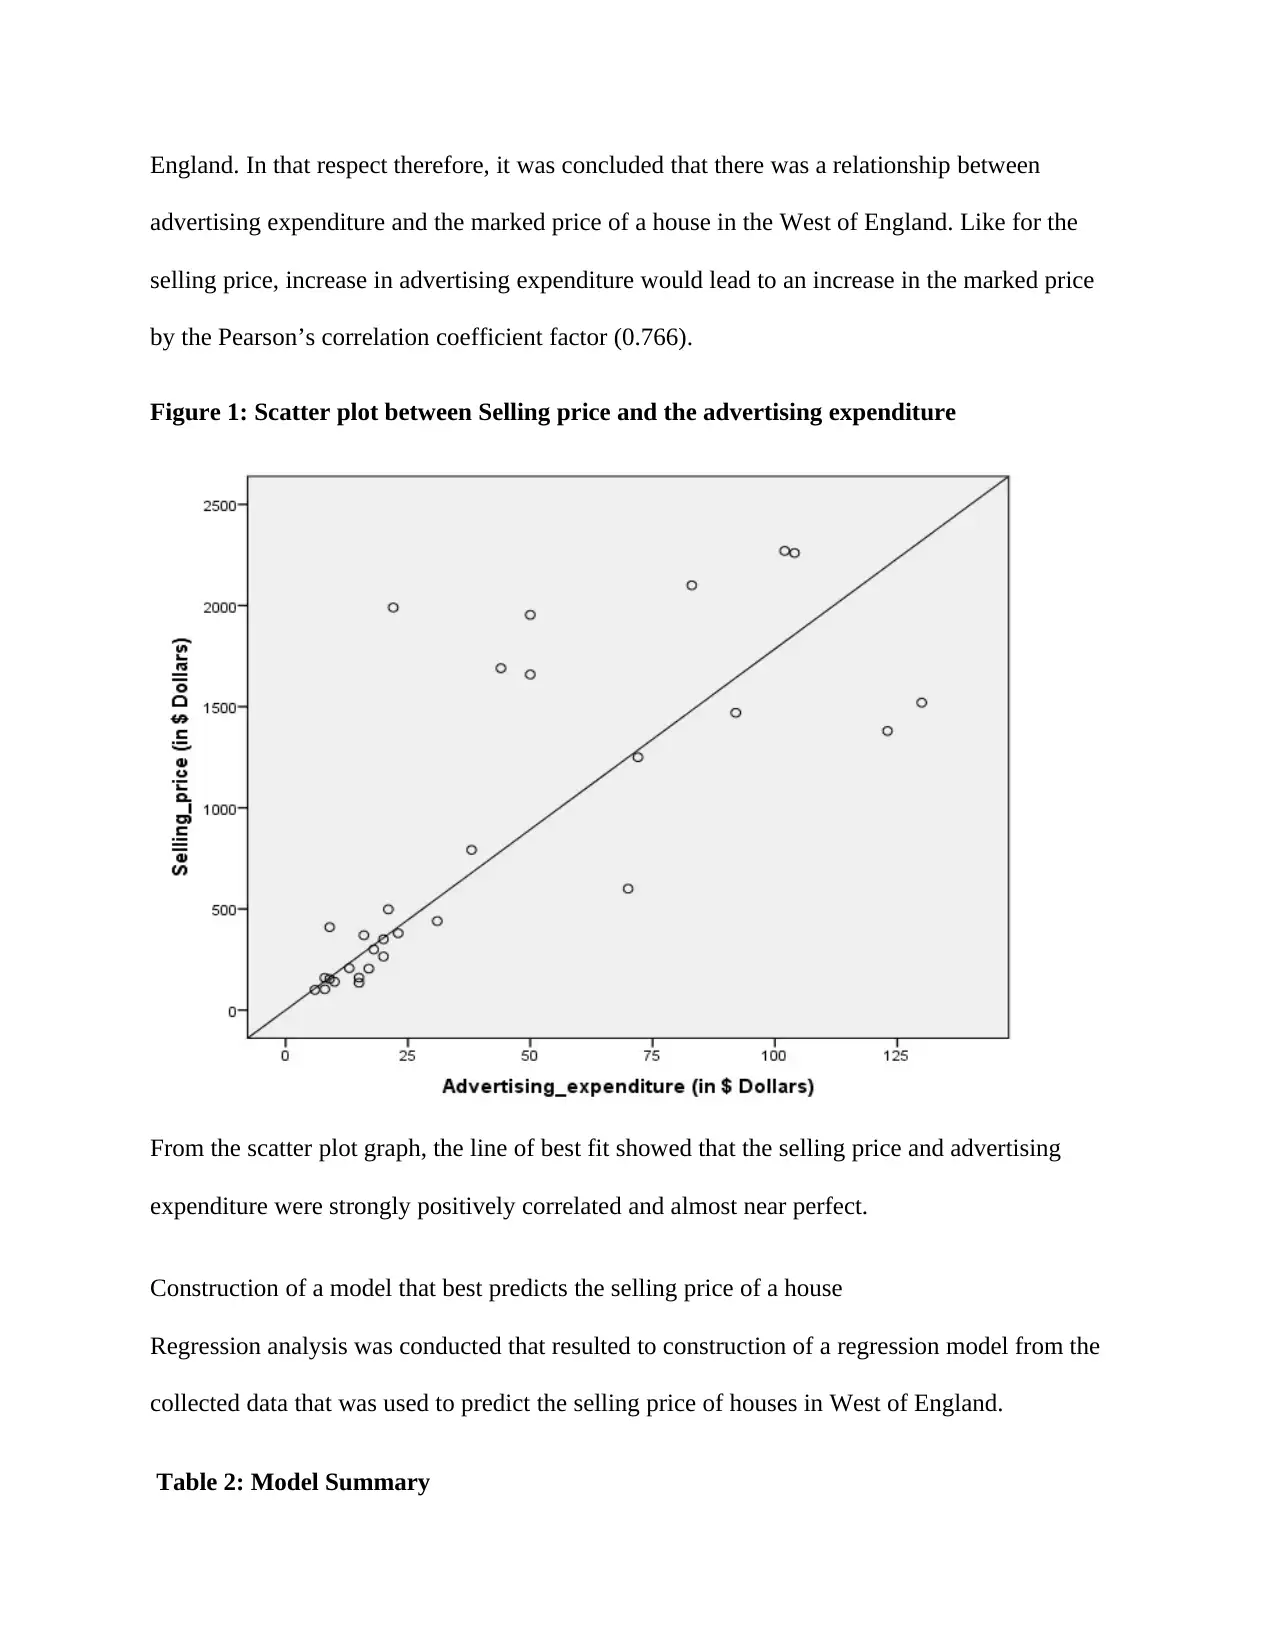
England. In that respect therefore, it was concluded that there was a relationship between
advertising expenditure and the marked price of a house in the West of England. Like for the
selling price, increase in advertising expenditure would lead to an increase in the marked price
by the Pearson’s correlation coefficient factor (0.766).
Figure 1: Scatter plot between Selling price and the advertising expenditure
From the scatter plot graph, the line of best fit showed that the selling price and advertising
expenditure were strongly positively correlated and almost near perfect.
Construction of a model that best predicts the selling price of a house
Regression analysis was conducted that resulted to construction of a regression model from the
collected data that was used to predict the selling price of houses in West of England.
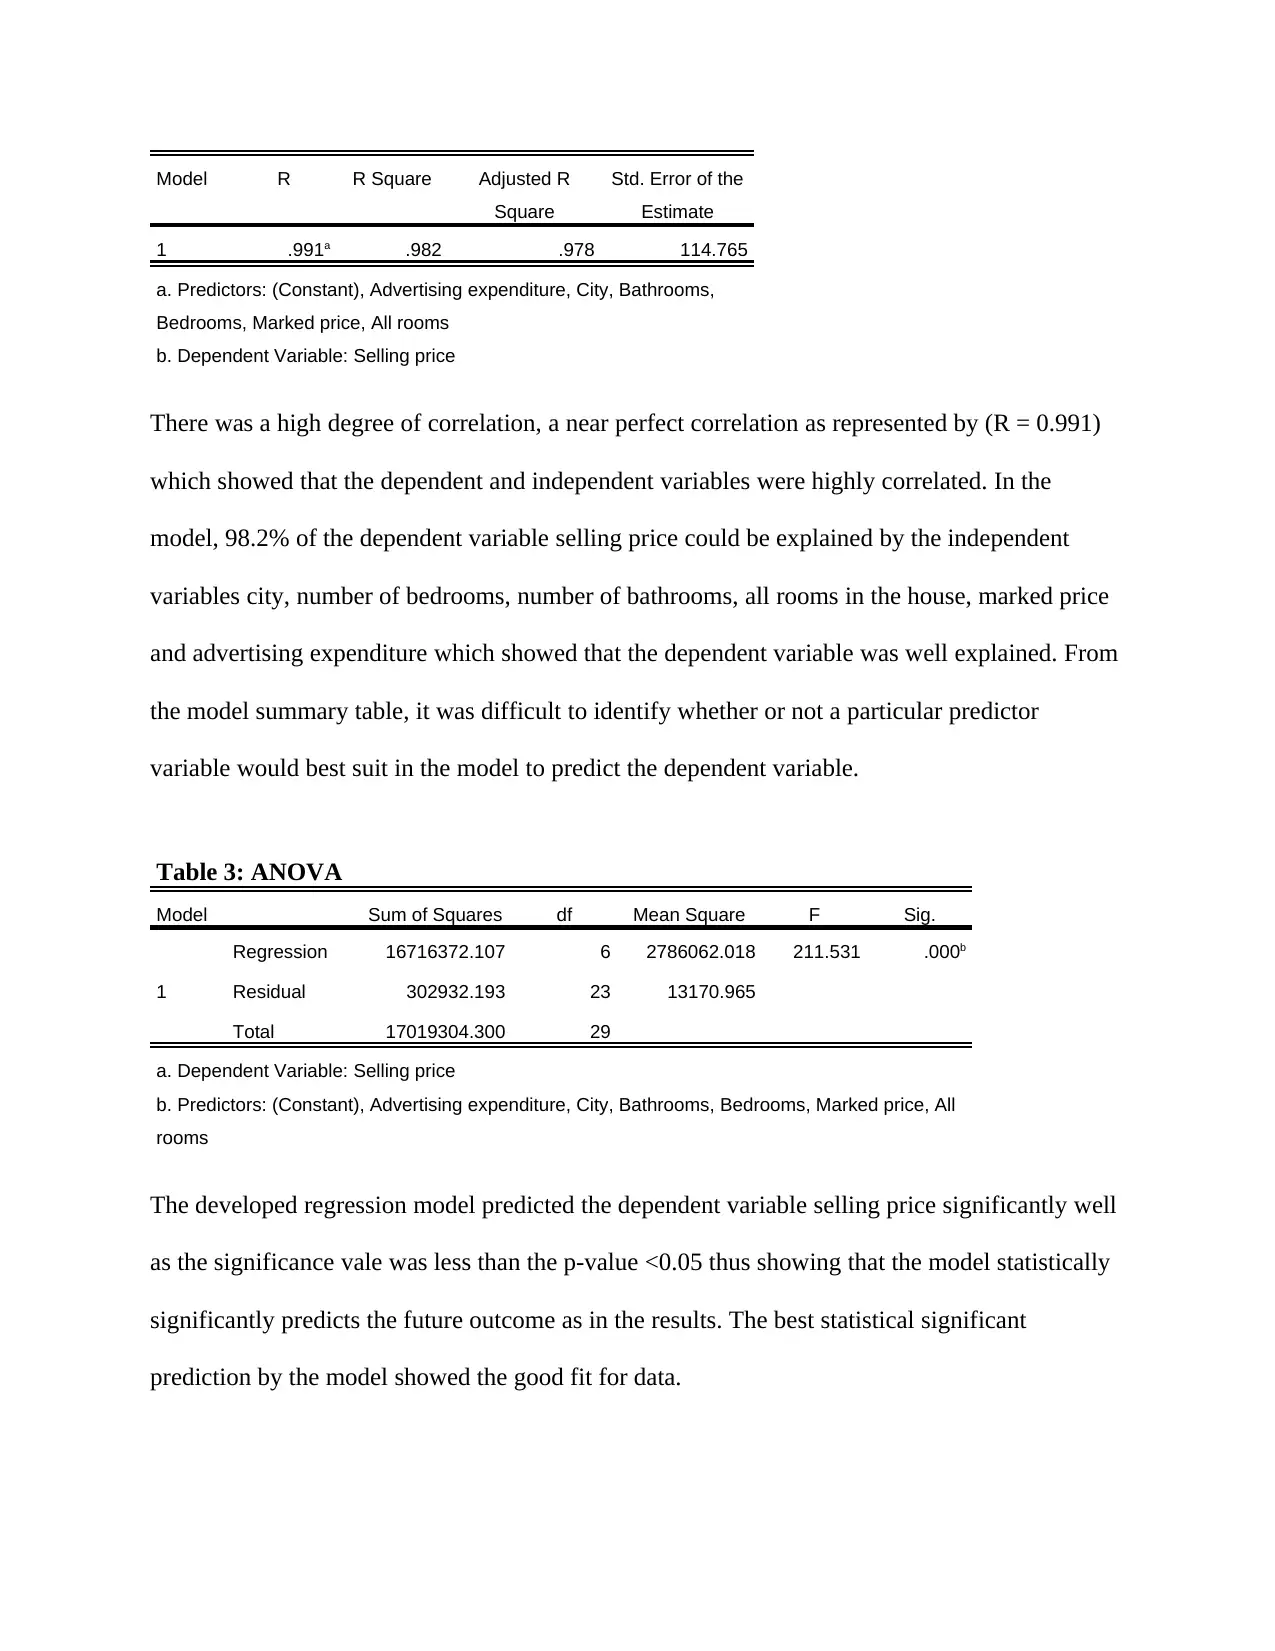
Table 2: Model Summary
advertising expenditure and the marked price of a house in the West of England. Like for the
selling price, increase in advertising expenditure would lead to an increase in the marked price
by the Pearson’s correlation coefficient factor (0.766).
Figure 1: Scatter plot between Selling price and the advertising expenditure
From the scatter plot graph, the line of best fit showed that the selling price and advertising
expenditure were strongly positively correlated and almost near perfect.
Construction of a model that best predicts the selling price of a house
Regression analysis was conducted that resulted to construction of a regression model from the
collected data that was used to predict the selling price of houses in West of England.
Table 2: Model Summary
Paraphrase This Document
Need a fresh take? Get an instant paraphrase of this document with our AI Paraphraser
Model R R Square Adjusted R
Square
Std. Error of the
Estimate
1 .991a .982 .978 114.765
a. Predictors: (Constant), Advertising expenditure, City, Bathrooms,
Bedrooms, Marked price, All rooms
b. Dependent Variable: Selling price
There was a high degree of correlation, a near perfect correlation as represented by (R = 0.991)
which showed that the dependent and independent variables were highly correlated. In the
model, 98.2% of the dependent variable selling price could be explained by the independent
variables city, number of bedrooms, number of bathrooms, all rooms in the house, marked price
and advertising expenditure which showed that the dependent variable was well explained. From
the model summary table, it was difficult to identify whether or not a particular predictor
variable would best suit in the model to predict the dependent variable.
Table 3: ANOVA
Model Sum of Squares df Mean Square F Sig.
1
Regression 16716372.107 6 2786062.018 211.531 .000b
Residual 302932.193 23 13170.965
Total 17019304.300 29
a. Dependent Variable: Selling price
b. Predictors: (Constant), Advertising expenditure, City, Bathrooms, Bedrooms, Marked price, All
rooms
The developed regression model predicted the dependent variable selling price significantly well
as the significance vale was less than the p-value <0.05 thus showing that the model statistically
significantly predicts the future outcome as in the results. The best statistical significant
prediction by the model showed the good fit for data.
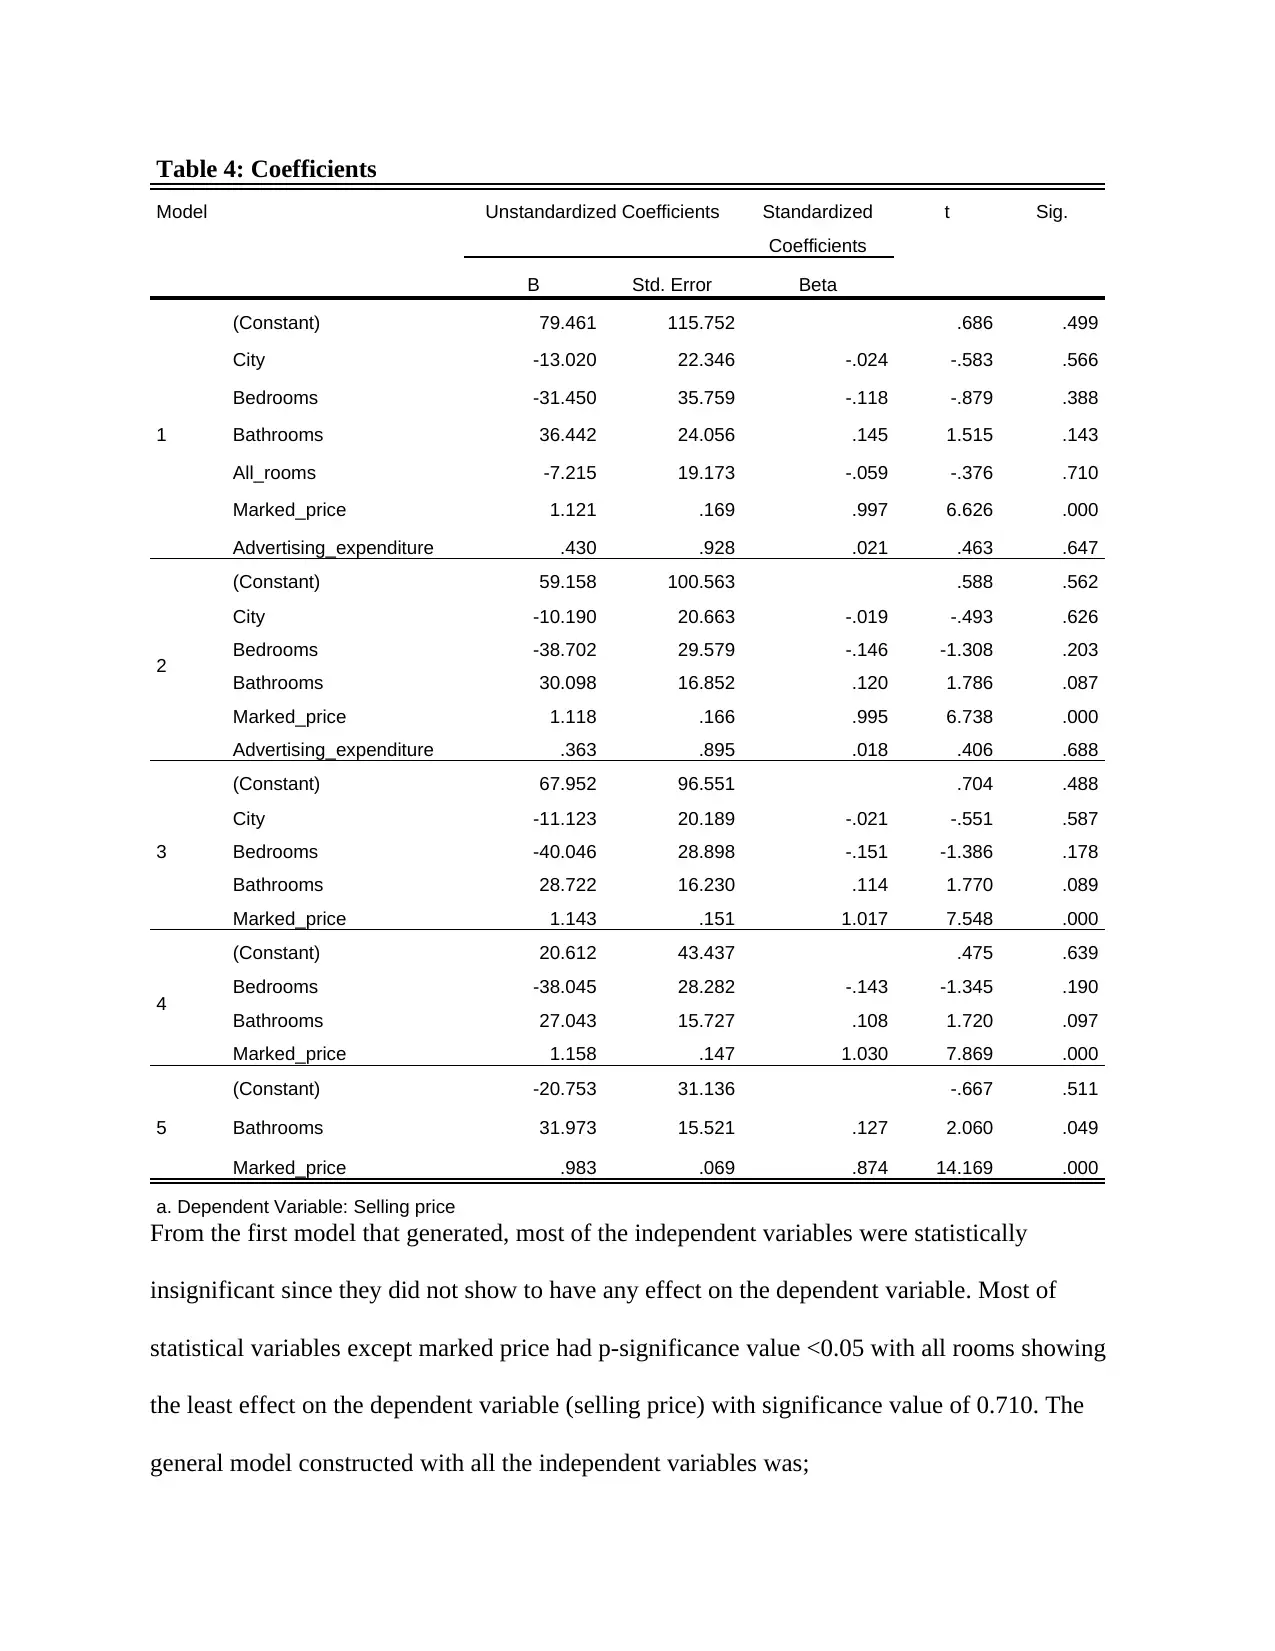
Table 4: Coefficients
Model Unstandardized Coefficients Standardized
Coefficients
t Sig.
B Std. Error Beta
1
(Constant) 79.461 115.752 .686 .499
City -13.020 22.346 -.024 -.583 .566
Bedrooms -31.450 35.759 -.118 -.879 .388
Bathrooms 36.442 24.056 .145 1.515 .143
All_rooms -7.215 19.173 -.059 -.376 .710
Marked_price 1.121 .169 .997 6.626 .000
Advertising_expenditure .430 .928 .021 .463 .647
2
(Constant) 59.158 100.563 .588 .562
City -10.190 20.663 -.019 -.493 .626
Bedrooms -38.702 29.579 -.146 -1.308 .203
Bathrooms 30.098 16.852 .120 1.786 .087
Marked_price 1.118 .166 .995 6.738 .000
Advertising_expenditure .363 .895 .018 .406 .688
3
(Constant) 67.952 96.551 .704 .488
City -11.123 20.189 -.021 -.551 .587
Bedrooms -40.046 28.898 -.151 -1.386 .178
Bathrooms 28.722 16.230 .114 1.770 .089
Marked_price 1.143 .151 1.017 7.548 .000
4
(Constant) 20.612 43.437 .475 .639
Bedrooms -38.045 28.282 -.143 -1.345 .190
Bathrooms 27.043 15.727 .108 1.720 .097
Marked_price 1.158 .147 1.030 7.869 .000
5
(Constant) -20.753 31.136 -.667 .511
Bathrooms 31.973 15.521 .127 2.060 .049
Marked_price .983 .069 .874 14.169 .000
a. Dependent Variable: Selling price
From the first model that generated, most of the independent variables were statistically
insignificant since they did not show to have any effect on the dependent variable. Most of
statistical variables except marked price had p-significance value <0.05 with all rooms showing
the least effect on the dependent variable (selling price) with significance value of 0.710. The
general model constructed with all the independent variables was;
⊘ This is a preview!⊘
Do you want full access?
Subscribe today to unlock all pages.
Trusted by 1+ million students worldwide
1 out of 18
Related Documents


Your All-in-One AI-Powered Toolkit for Academic Success.
+13062052269
info@desklib.com
Available 24*7 on WhatsApp / Email
![[object Object]](/_next/static/media/star-bottom.7253800d.svg)
Unlock your academic potential
Copyright © 2020–2026 A2Z Services. All Rights Reserved. Developed and managed by ZUCOL.