Factors Affecting Commercial Property Prices in the UK: An Analysis
VerifiedAdded on 2023/01/10
|15
|2972
|78
Report
AI Summary
This report examines the economic factors influencing the price of commercial properties in the UK. It begins with an introduction to business economics and the application of economic principles to commercial real estate. The main body analyzes the effects of demand and supply, illustrating these concepts with curves and discussing price elasticity. The report then delves into specific factors affecting property prices, including interest rates, taxation (specifically stamp duty), and the impact of new commercial property construction. The analysis covers the effects of interest rates and mortgage payments, the impact of stamp duty changes, and the decline in rental growth in different sectors, such as retail and office spaces, post-Brexit. The report uses figures and graphs to explain complex concepts, providing a comprehensive overview of the economic forces shaping the UK commercial property market.

Economics for Business
Paraphrase This Document
Need a fresh take? Get an instant paraphrase of this document with our AI Paraphraser
INTRODUCTION...........................................................................................................................1
MAIN BODY..................................................................................................................................1
1. Determined the factors which affect the price of commercial properties in UK.....................1
CONCLUSION..............................................................................................................................12
REFERENCES..............................................................................................................................13
INTRODUCTION
Business economics seems to be a area of applied economics is the application companies'
political, managerial, business and environmental problems. Economic analysis and quantitative
approaches form the foundation of analyses on issues that impact companies such as
organizational administration, management, growth and policy (Economics, 2020). "Commercial
property contributes to real property that used during industry. It typically refers to facilities that
contain enterprises, but may also apply to land that are meant to make a income, as well as
broader private rental houses. This essay is based on commercial properties in the UK is based
on supply and demand theory and economic concepts to the market. Study of supply and demand
helps one to analyze and recognize business working.
MAIN BODY
1. Determined the factors which affect the price of commercial properties in UK
There are several factors which affect the price of commercial properties in the UK, for the
better understanding of this concept, demand and supply analysis is essential to evaluate before
considering the determinants of commercial properties. These are as follow:
Law of demand: In the corporate world, acknowledging and applying demand concept is one of
the most critical concepts for organizations (Law of Demand, 2020). This refers to the
unfavourable or the opposite relation between price and quantity demanded for a product. This
states that consumers are consuming more often when prices drop while buying less as prices go
up. Higher price of commercial properties will contribute to reduced demanded quantity of
properties in the UK. Through the other side, a decline in prices of commercial properties
increases the demand in the market. With the help of this analyzes below, citizens of the UK
can better understand the property market's supply and demand trends.
1
⊘ This is a preview!⊘
Do you want full access?
Subscribe today to unlock all pages.
Trusted by 1+ million students worldwide
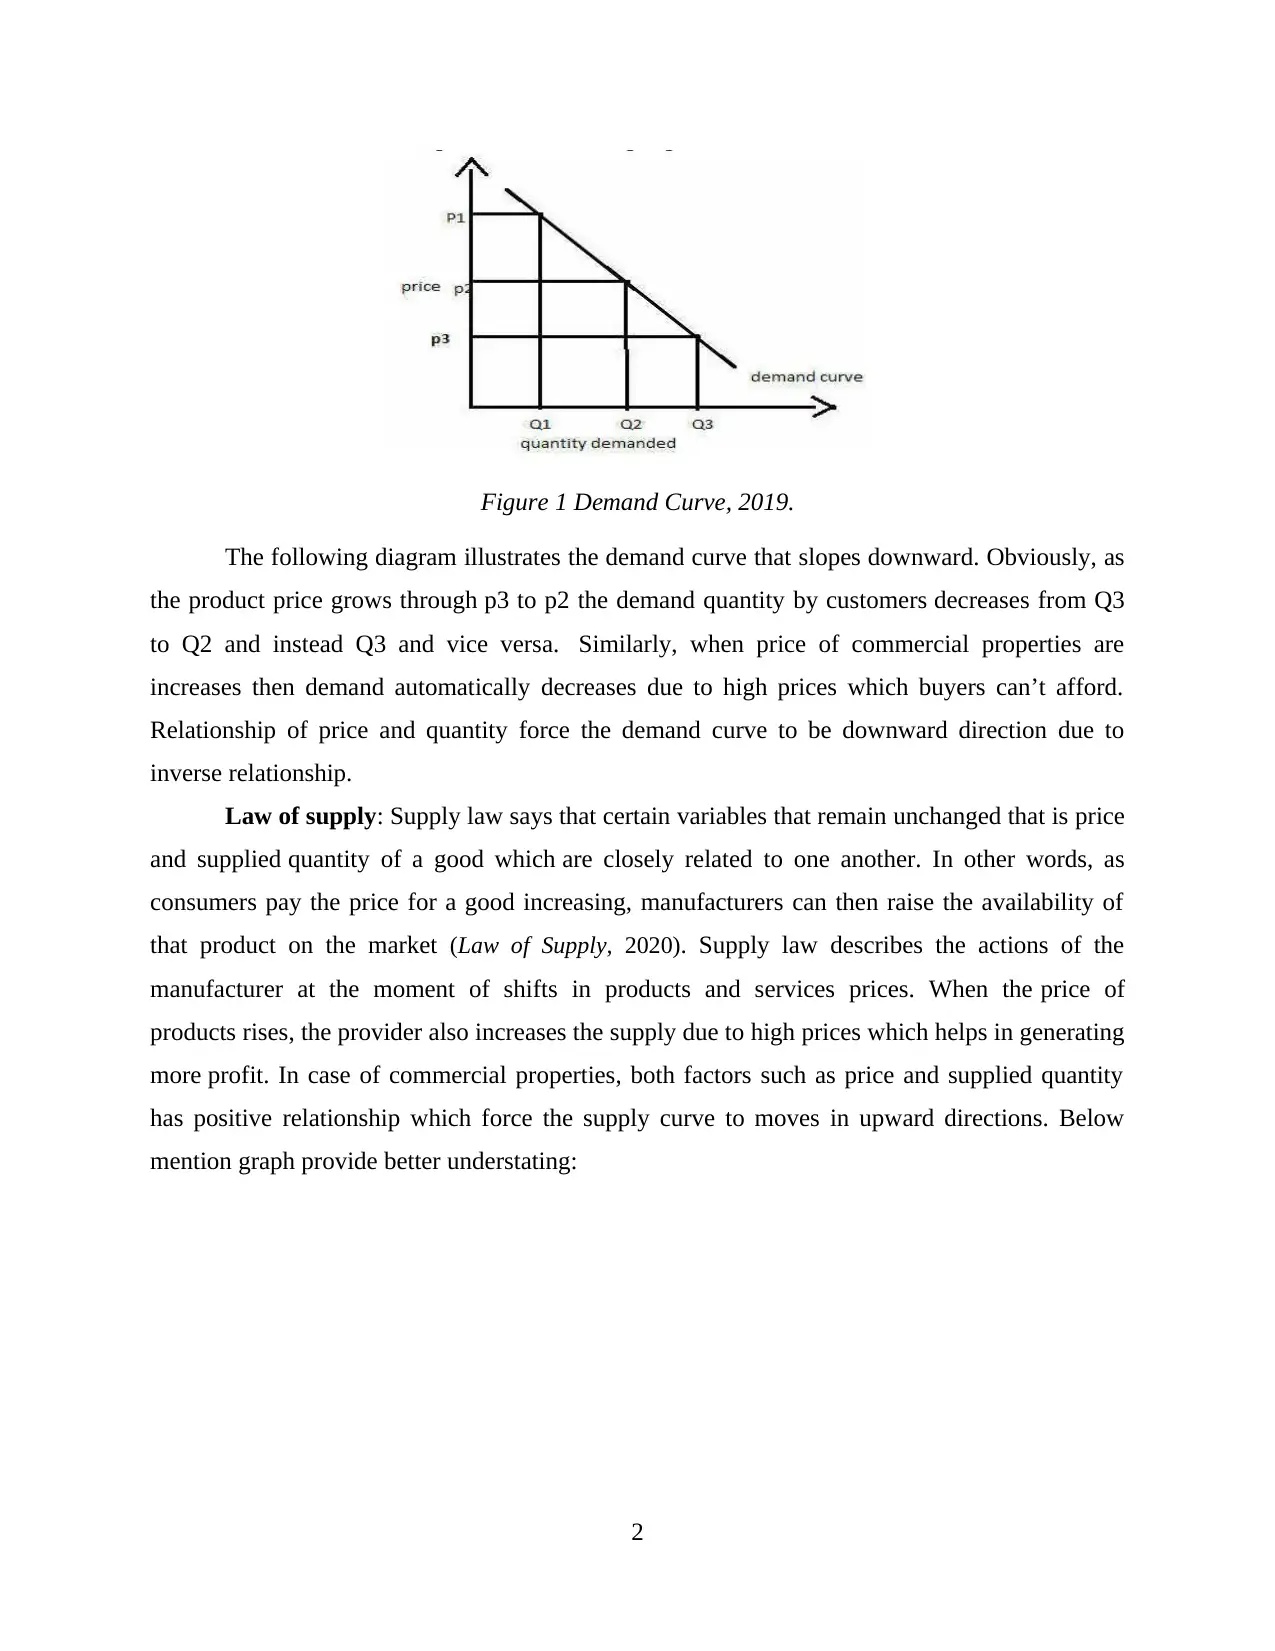
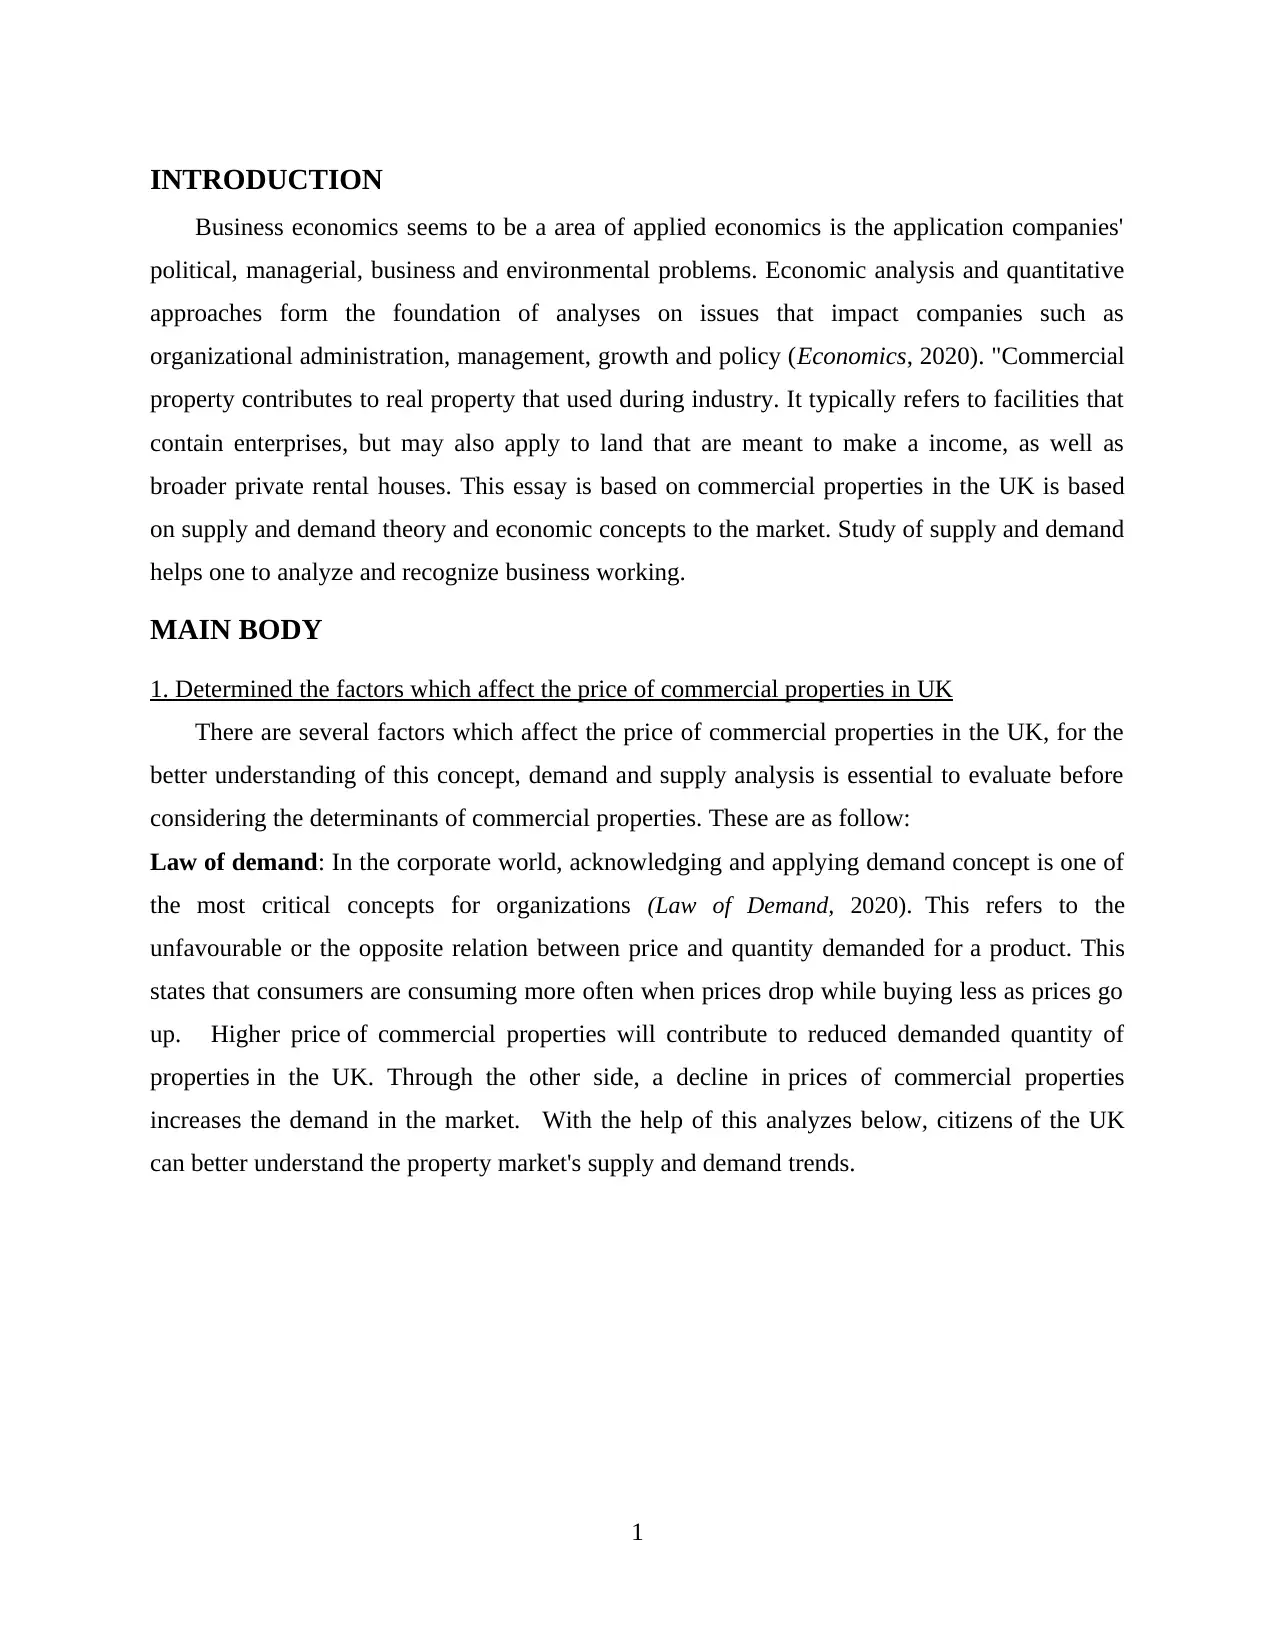
Figure 1 Demand Curve, 2019.
The following diagram illustrates the demand curve that slopes downward. Obviously, as
the product price grows through p3 to p2 the demand quantity by customers decreases from Q3
to Q2 and instead Q3 and vice versa. Similarly, when price of commercial properties are
increases then demand automatically decreases due to high prices which buyers can’t afford.
Relationship of price and quantity force the demand curve to be downward direction due to
inverse relationship.
Law of supply: Supply law says that certain variables that remain unchanged that is price
and supplied quantity of a good which are closely related to one another. In other words, as
consumers pay the price for a good increasing, manufacturers can then raise the availability of
that product on the market (Law of Supply, 2020). Supply law describes the actions of the
manufacturer at the moment of shifts in products and services prices. When the price of
products rises, the provider also increases the supply due to high prices which helps in generating
more profit. In case of commercial properties, both factors such as price and supplied quantity
has positive relationship which force the supply curve to moves in upward directions. Below
mention graph provide better understating:
2
Paraphrase This Document
Need a fresh take? Get an instant paraphrase of this document with our AI Paraphraser
Figure 2 Supply Curve, 2019.
The diagram above illustrates upward slanting supply curve due to positive relation
among price and quantity. Because when product’s price was increases from P3 to P2
then suppliers were delivering high quantity from Q3 to Q2. When the demand continues to
increase because of the supplied quantity then supply curve moves in upward directions. When
price of commercial properties increases then demand also increases, on the other side when
price reduces then supplied quantity of commercial properties also decline.
Demand and supply curve intersect:
Demand and supply curves both seem to have product price on the y axis and volume on
the x axis. Demand and supply curve for a specific service or good such as commercial
properties in UK show up on the very same chart. Demand and supply jointly decide the quality
and amount which will be offered for sale in a marketplace. Below mention graph provide better
understanding for both curves:
3
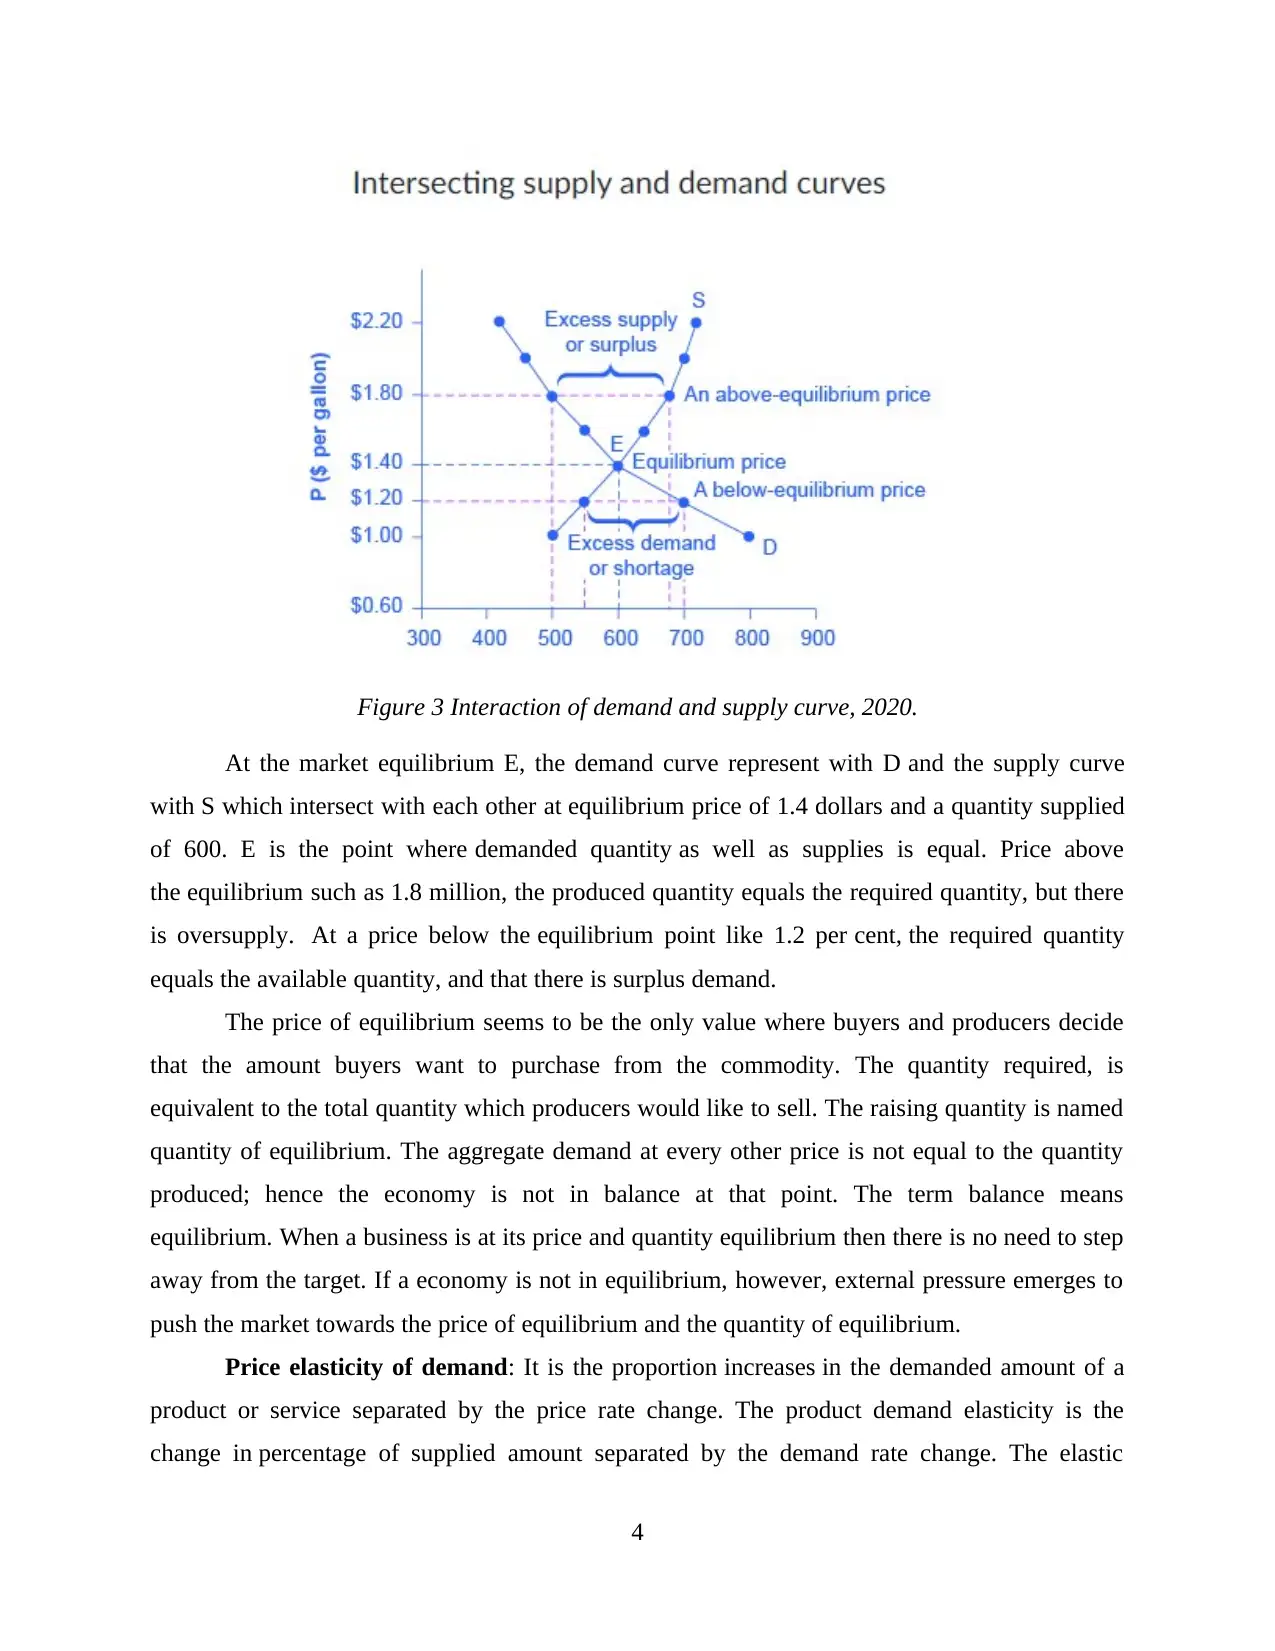
Figure 3 Interaction of demand and supply curve, 2020.
At the market equilibrium E, the demand curve represent with D and the supply curve
with S which intersect with each other at equilibrium price of 1.4 dollars and a quantity supplied
of 600. E is the point where demanded quantity as well as supplies is equal. Price above
the equilibrium such as 1.8 million, the produced quantity equals the required quantity, but there
is oversupply. At a price below the equilibrium point like 1.2 per cent, the required quantity
equals the available quantity, and that there is surplus demand.
The price of equilibrium seems to be the only value where buyers and producers decide
that the amount buyers want to purchase from the commodity. The quantity required, is
equivalent to the total quantity which producers would like to sell. The raising quantity is named
quantity of equilibrium. The aggregate demand at every other price is not equal to the quantity
produced; hence the economy is not in balance at that point. The term balance means
equilibrium. When a business is at its price and quantity equilibrium then there is no need to step
away from the target. If a economy is not in equilibrium, however, external pressure emerges to
push the market towards the price of equilibrium and the quantity of equilibrium.
Price elasticity of demand: It is the proportion increases in the demanded amount of a
product or service separated by the price rate change. The product demand elasticity is the
change in percentage of supplied amount separated by the demand rate change. The elastic
4
⊘ This is a preview!⊘
Do you want full access?
Subscribe today to unlock all pages.
Trusted by 1+ million students worldwide
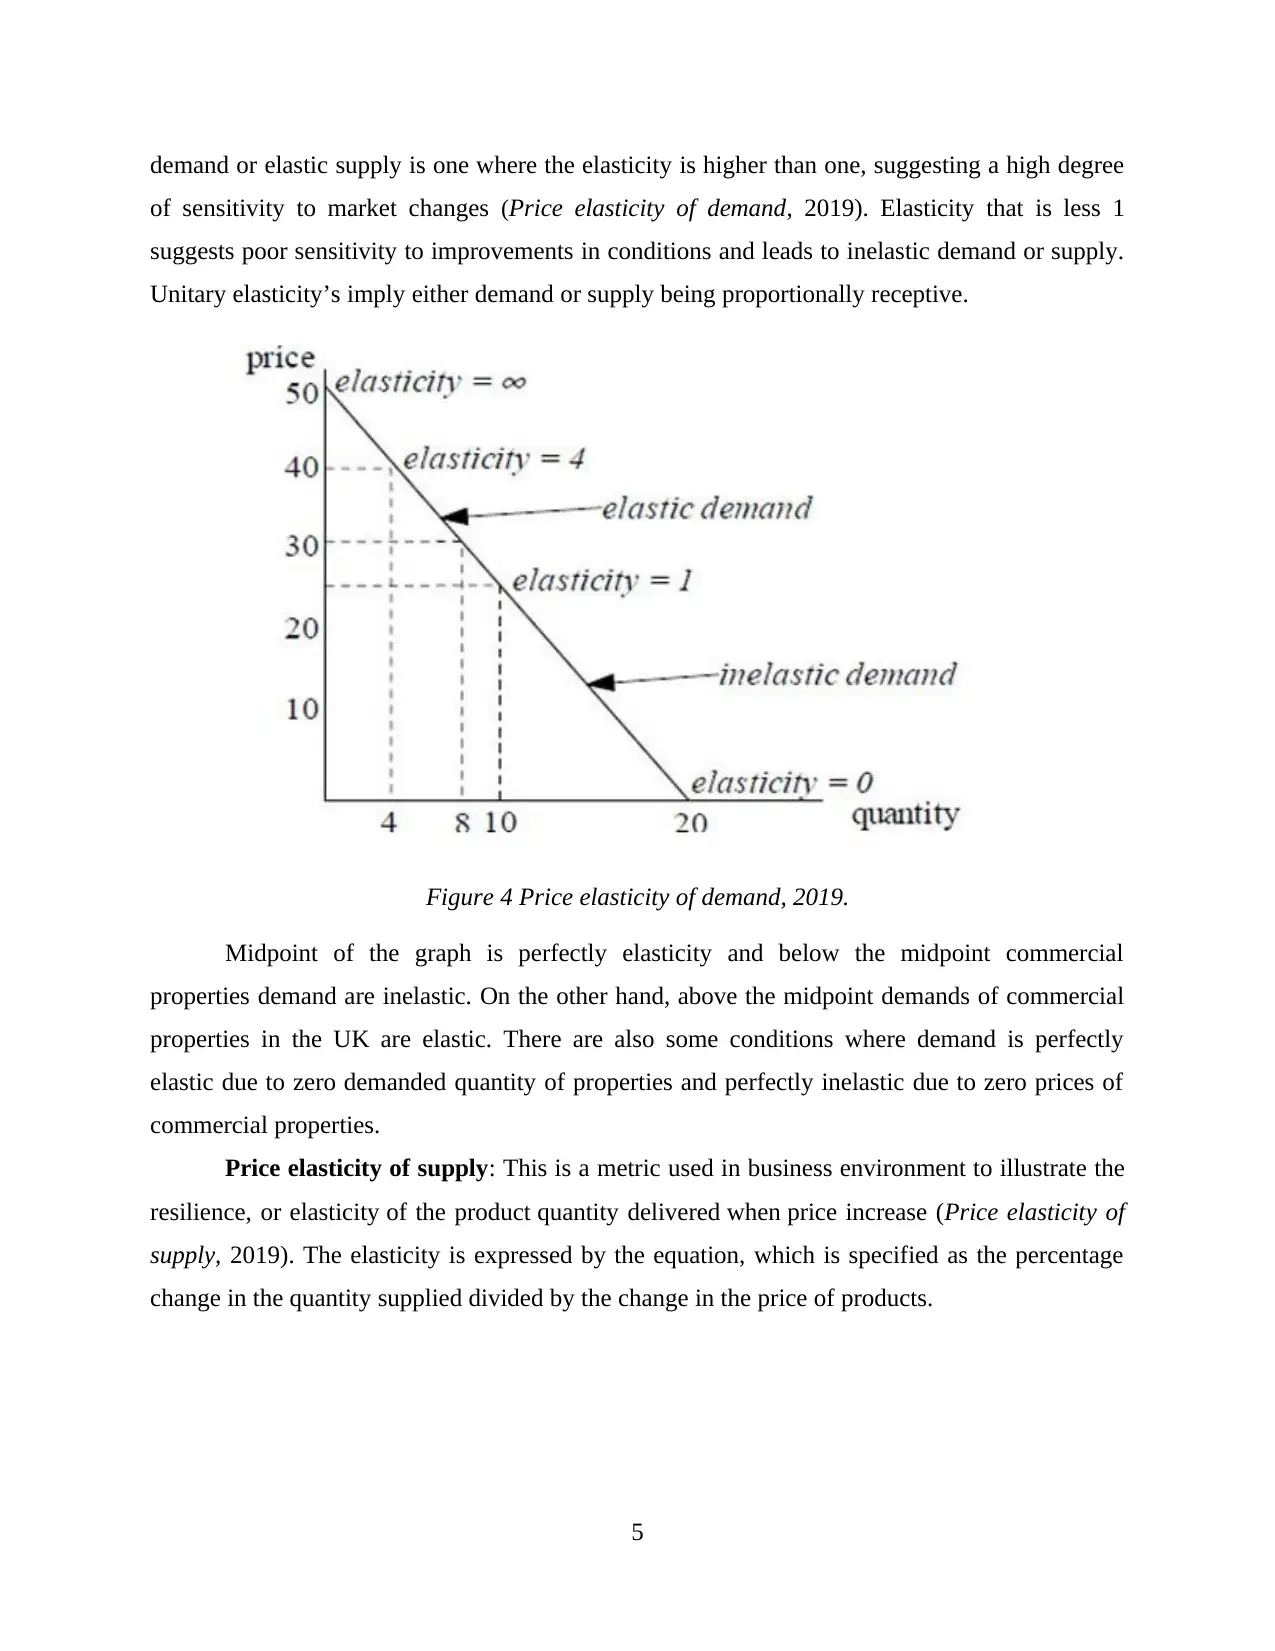
demand or elastic supply is one where the elasticity is higher than one, suggesting a high degree
of sensitivity to market changes (Price elasticity of demand, 2019). Elasticity that is less 1
suggests poor sensitivity to improvements in conditions and leads to inelastic demand or supply.
Unitary elasticity’s imply either demand or supply being proportionally receptive.
Figure 4 Price elasticity of demand, 2019.
Midpoint of the graph is perfectly elasticity and below the midpoint commercial
properties demand are inelastic. On the other hand, above the midpoint demands of commercial
properties in the UK are elastic. There are also some conditions where demand is perfectly
elastic due to zero demanded quantity of properties and perfectly inelastic due to zero prices of
commercial properties.
Price elasticity of supply: This is a metric used in business environment to illustrate the
resilience, or elasticity of the product quantity delivered when price increase (Price elasticity of
supply, 2019). The elasticity is expressed by the equation, which is specified as the percentage
change in the quantity supplied divided by the change in the price of products.
5
Paraphrase This Document
Need a fresh take? Get an instant paraphrase of this document with our AI Paraphraser
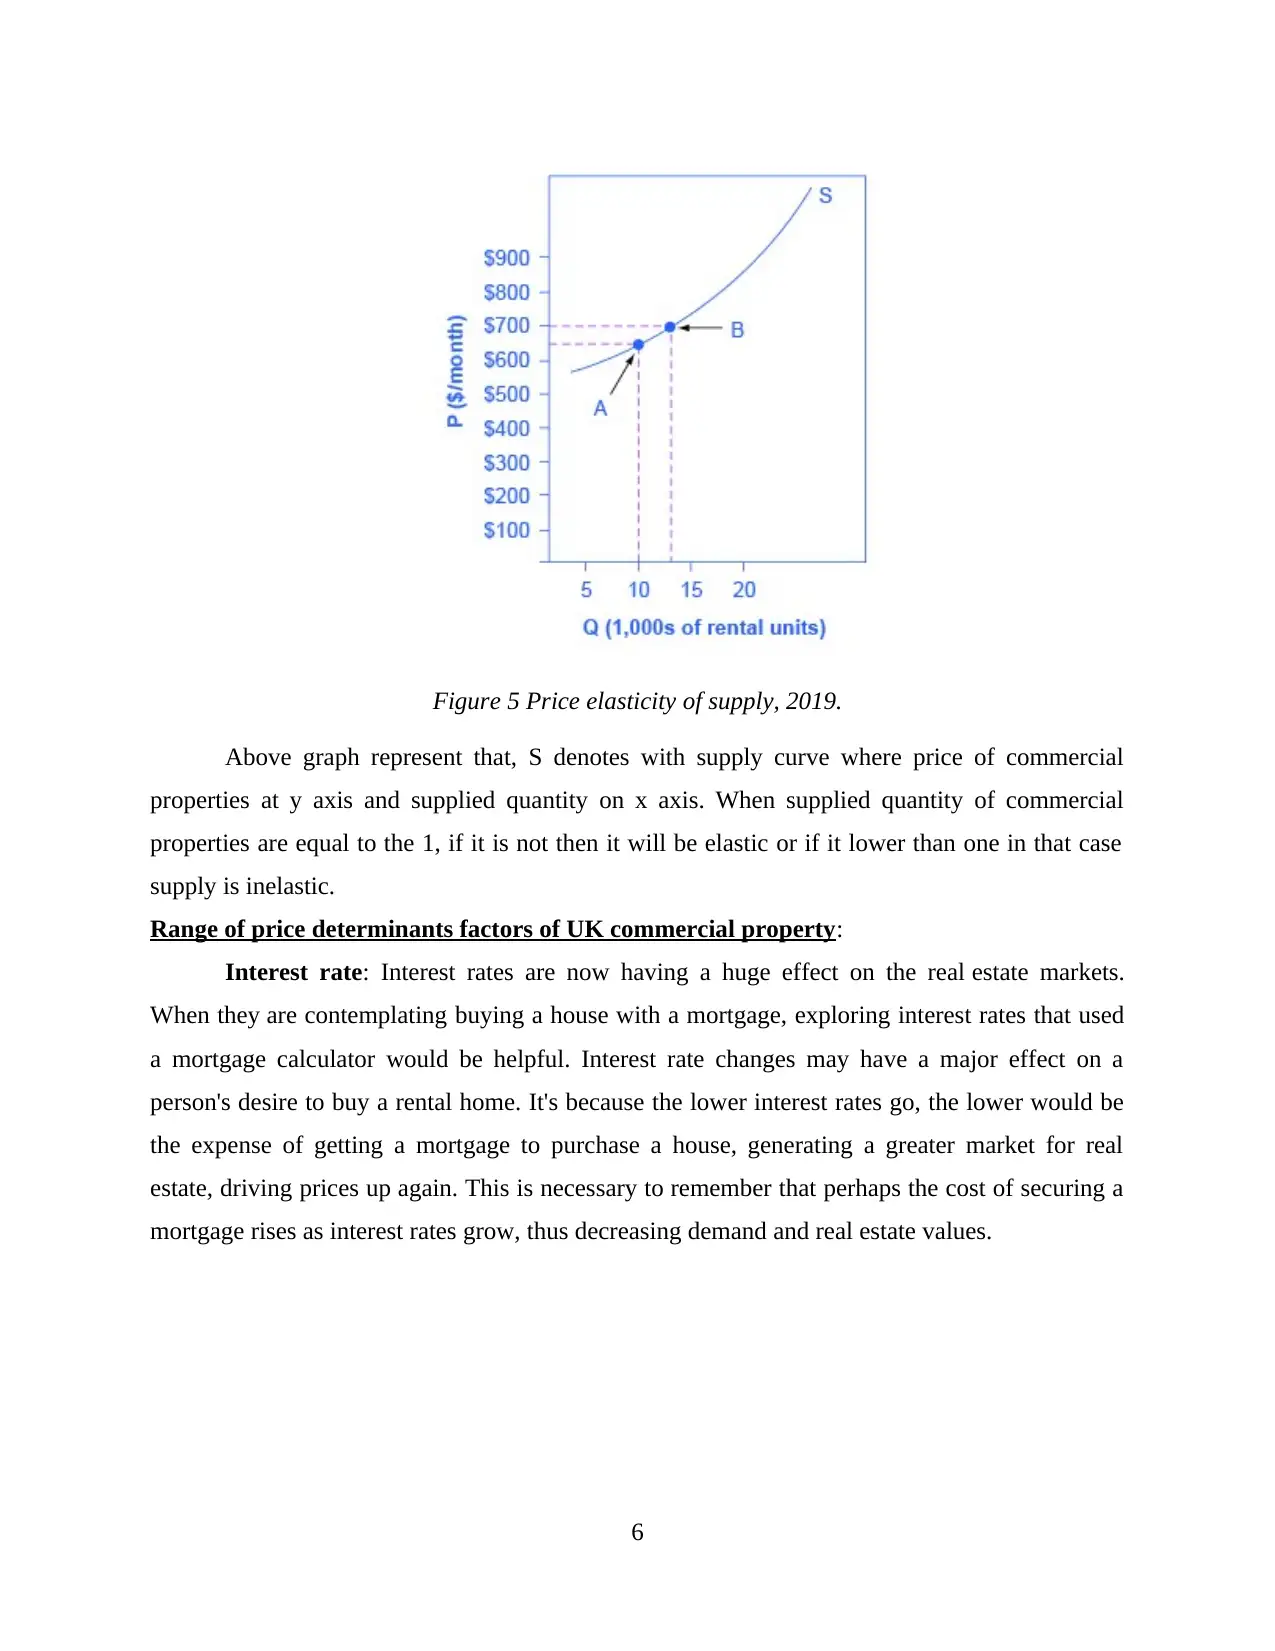
Figure 5 Price elasticity of supply, 2019.
Above graph represent that, S denotes with supply curve where price of commercial
properties at y axis and supplied quantity on x axis. When supplied quantity of commercial
properties are equal to the 1, if it is not then it will be elastic or if it lower than one in that case
supply is inelastic.
Range of price determinants factors of UK commercial property:
Interest rate: Interest rates are now having a huge effect on the real estate markets.
When they are contemplating buying a house with a mortgage, exploring interest rates that used
a mortgage calculator would be helpful. Interest rate changes may have a major effect on a
person's desire to buy a rental home. It's because the lower interest rates go, the lower would be
the expense of getting a mortgage to purchase a house, generating a greater market for real
estate, driving prices up again. This is necessary to remember that perhaps the cost of securing a
mortgage rises as interest rates grow, thus decreasing demand and real estate values.
6
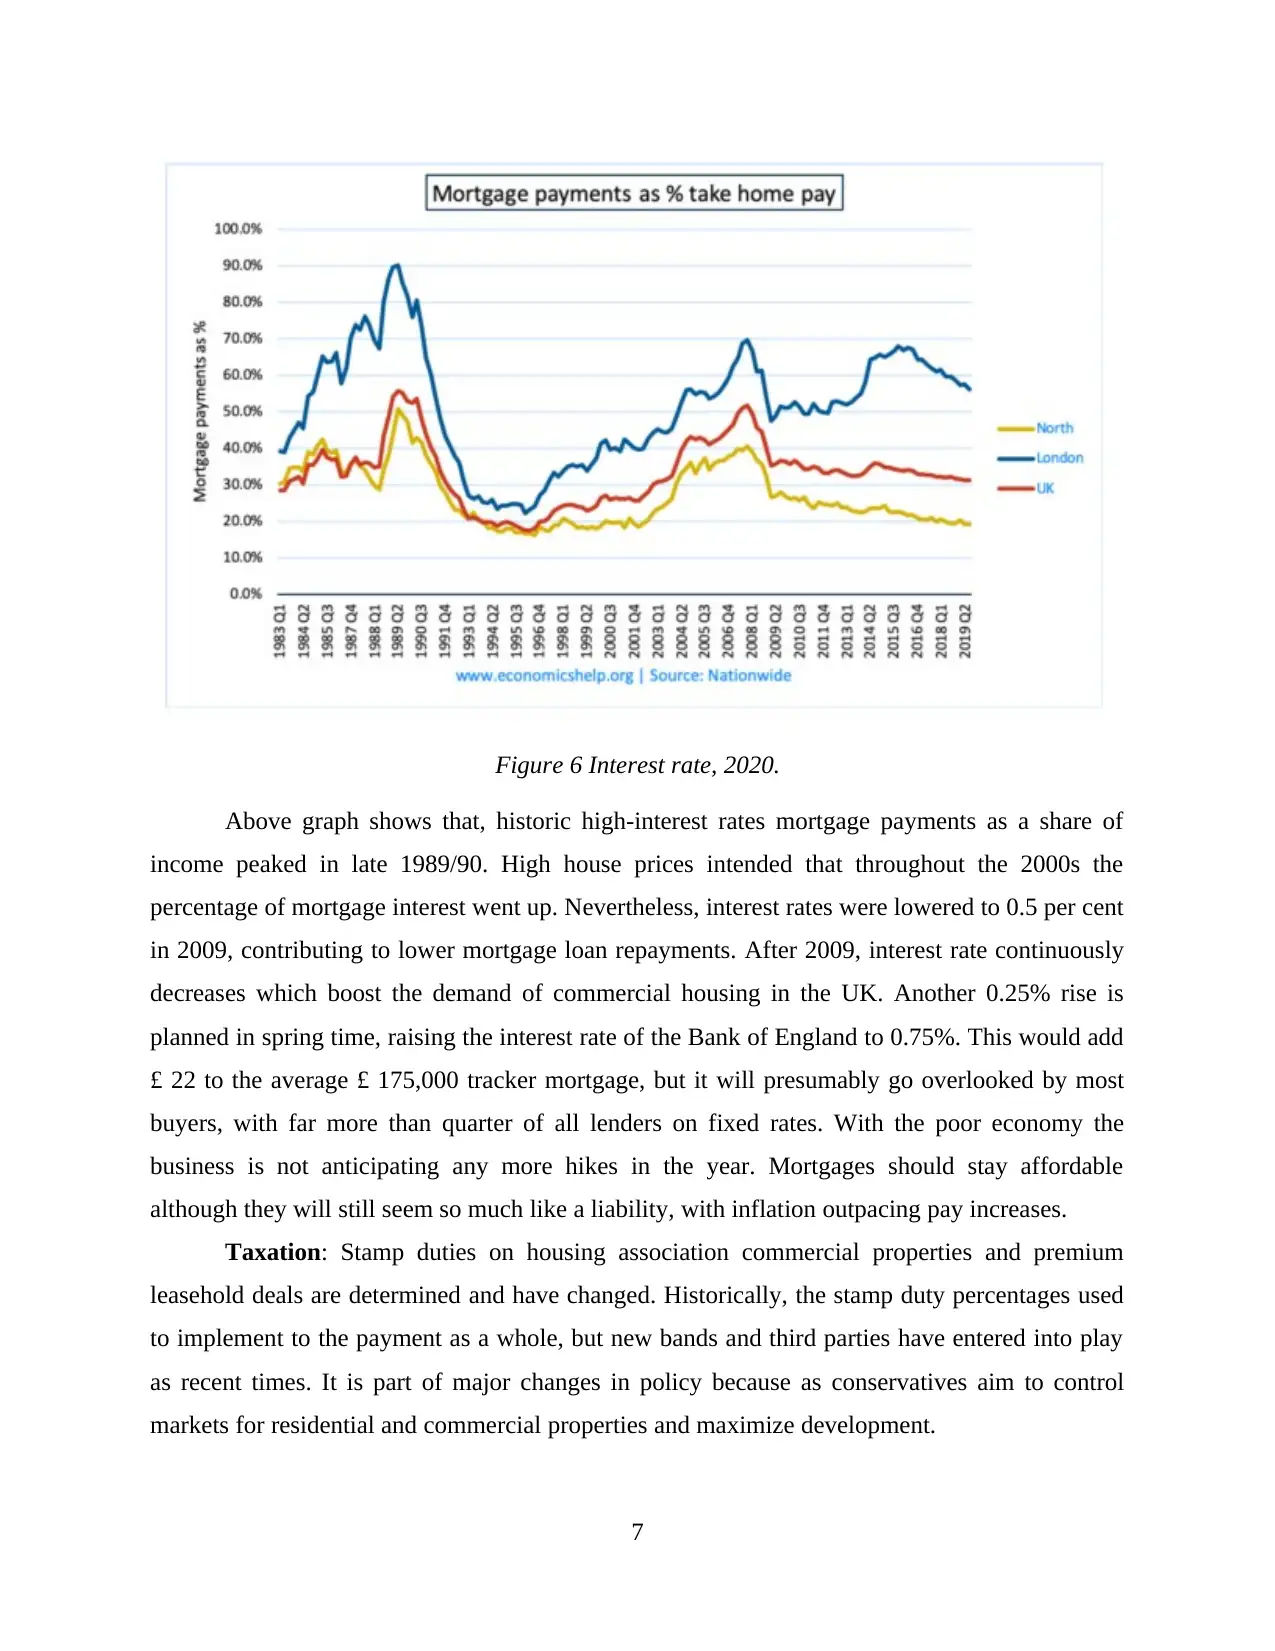
Figure 6 Interest rate, 2020.
Above graph shows that, historic high-interest rates mortgage payments as a share of
income peaked in late 1989/90. High house prices intended that throughout the 2000s the
percentage of mortgage interest went up. Nevertheless, interest rates were lowered to 0.5 per cent
in 2009, contributing to lower mortgage loan repayments. After 2009, interest rate continuously
decreases which boost the demand of commercial housing in the UK. Another 0.25% rise is
planned in spring time, raising the interest rate of the Bank of England to 0.75%. This would add
£ 22 to the average £ 175,000 tracker mortgage, but it will presumably go overlooked by most
buyers, with far more than quarter of all lenders on fixed rates. With the poor economy the
business is not anticipating any more hikes in the year. Mortgages should stay affordable
although they will still seem so much like a liability, with inflation outpacing pay increases.
Taxation: Stamp duties on housing association commercial properties and premium
leasehold deals are determined and have changed. Historically, the stamp duty percentages used
to implement to the payment as a whole, but new bands and third parties have entered into play
as recent times. It is part of major changes in policy because as conservatives aim to control
markets for residential and commercial properties and maximize development.
7
⊘ This is a preview!⊘
Do you want full access?
Subscribe today to unlock all pages.
Trusted by 1+ million students worldwide
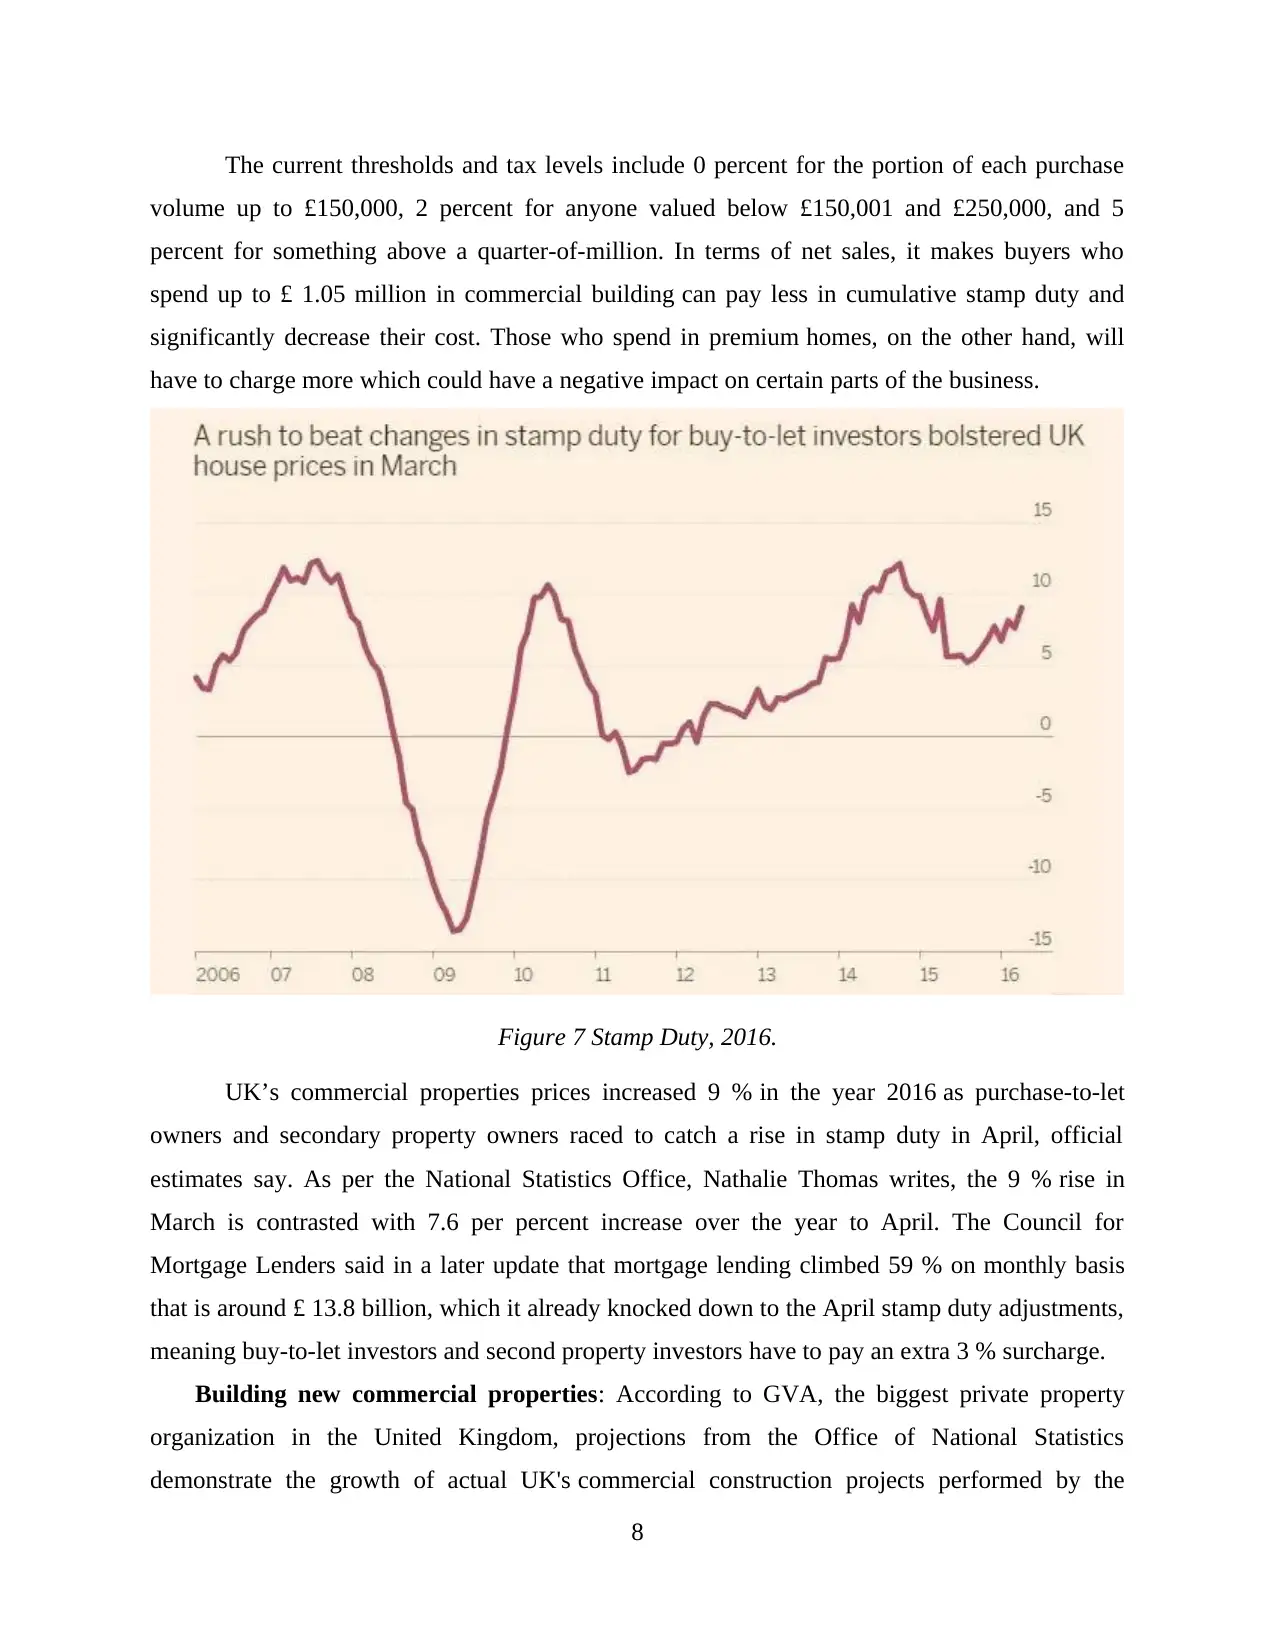
The current thresholds and tax levels include 0 percent for the portion of each purchase
volume up to £150,000, 2 percent for anyone valued below £150,001 and £250,000, and 5
percent for something above a quarter-of-million. In terms of net sales, it makes buyers who
spend up to £ 1.05 million in commercial building can pay less in cumulative stamp duty and
significantly decrease their cost. Those who spend in premium homes, on the other hand, will
have to charge more which could have a negative impact on certain parts of the business.
Figure 7 Stamp Duty, 2016.
UK’s commercial properties prices increased 9 % in the year 2016 as purchase-to-let
owners and secondary property owners raced to catch a rise in stamp duty in April, official
estimates say. As per the National Statistics Office, Nathalie Thomas writes, the 9 % rise in
March is contrasted with 7.6 per percent increase over the year to April. The Council for
Mortgage Lenders said in a later update that mortgage lending climbed 59 % on monthly basis
that is around £ 13.8 billion, which it already knocked down to the April stamp duty adjustments,
meaning buy-to-let investors and second property investors have to pay an extra 3 % surcharge.
Building new commercial properties: According to GVA, the biggest private property
organization in the United Kingdom, projections from the Office of National Statistics
demonstrate the growth of actual UK's commercial construction projects performed by the
8
Paraphrase This Document
Need a fresh take? Get an instant paraphrase of this document with our AI Paraphraser
private industry has declined month by month since December 2017. On the other side, rental
growth has sunk just to 1.5 % in September to over 4% in the months leading up to the
referendum. In the commercial property sector, rental growth over last 12 months in September
decreases to 1.4 percent from 1.6 percent in August and in the mid-range quarterly Consensus
Investment Property Forum (IPF) expects annual growth of just 0.9 percent in 2018. This is
projected to fall to just 0.4 per cent in 2019. Decline in the rent has impacted all kinds of
commercial property but the market has both wallets of adaptability and lack of strength.
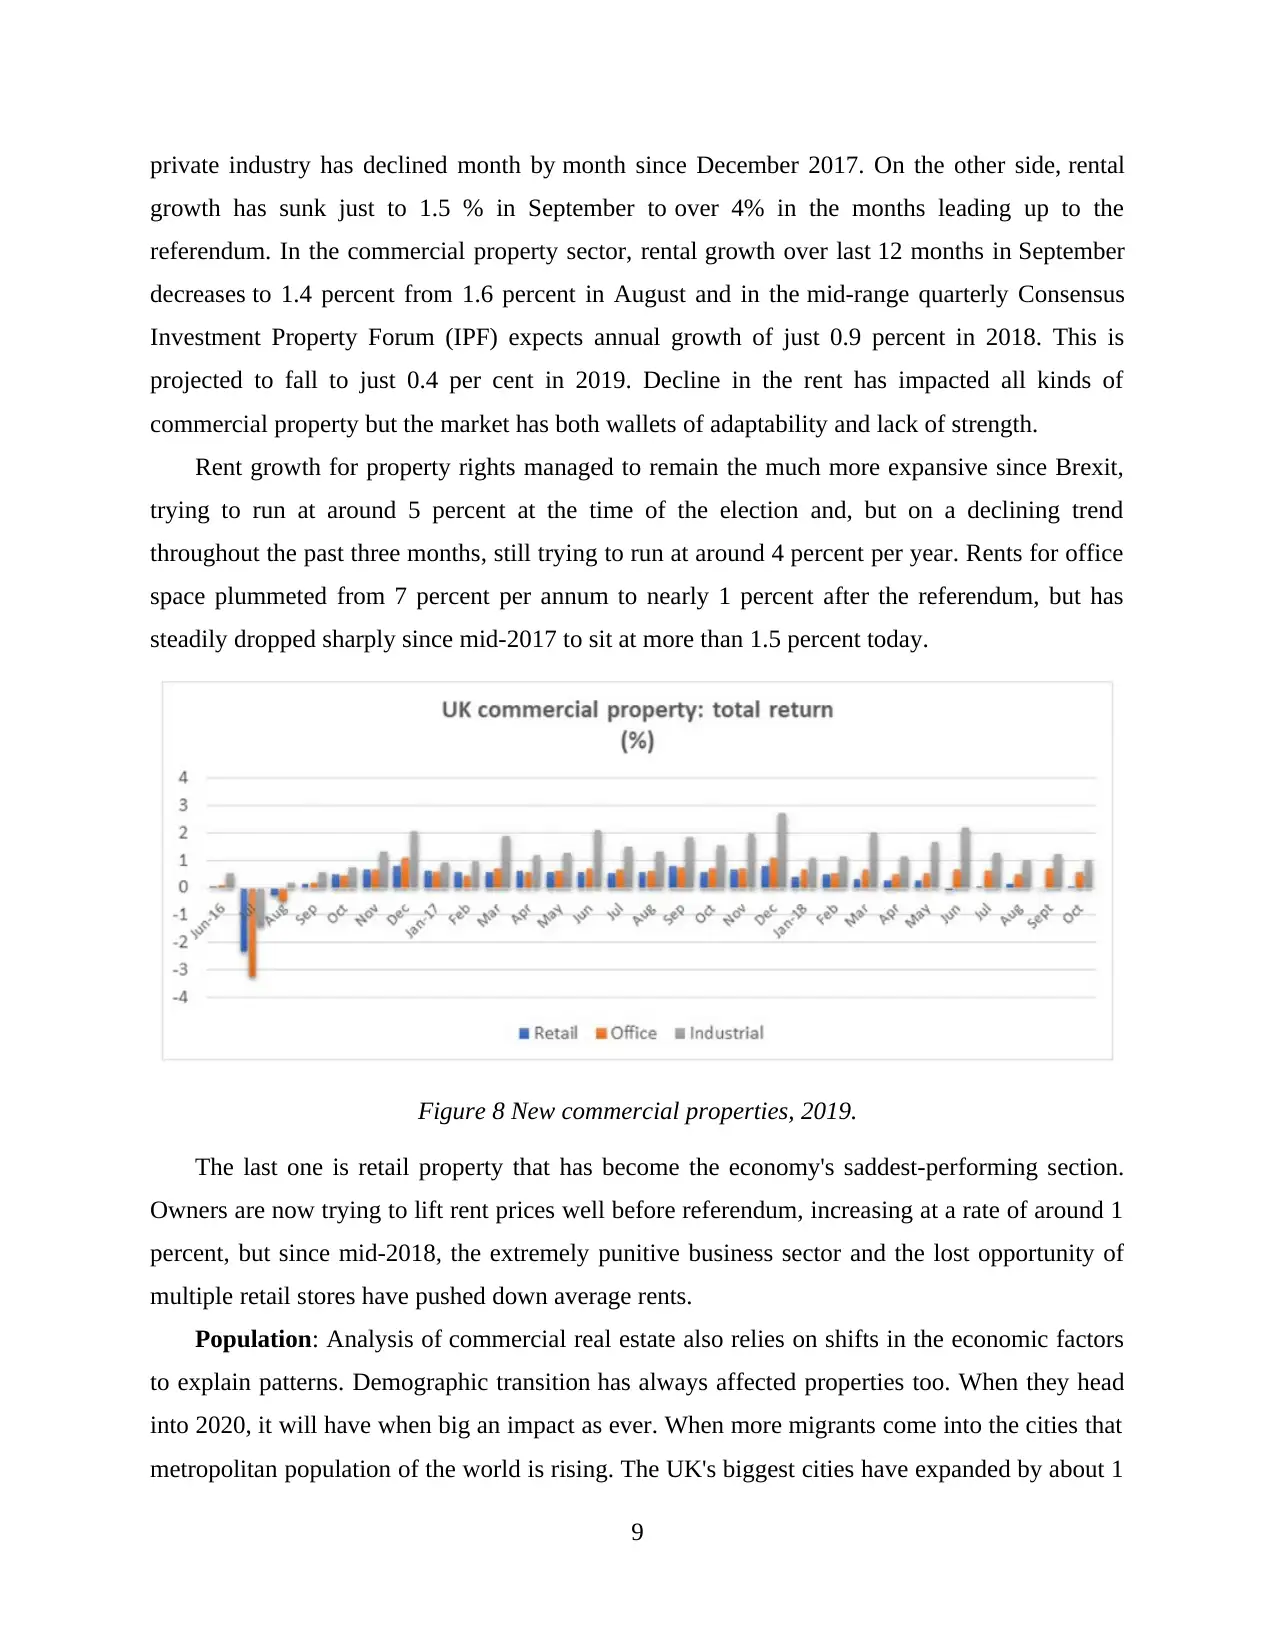
Rent growth for property rights managed to remain the much more expansive since Brexit,
trying to run at around 5 percent at the time of the election and, but on a declining trend
throughout the past three months, still trying to run at around 4 percent per year. Rents for office
space plummeted from 7 percent per annum to nearly 1 percent after the referendum, but has
steadily dropped sharply since mid-2017 to sit at more than 1.5 percent today.
Figure 8 New commercial properties, 2019.
The last one is retail property that has become the economy's saddest-performing section.
Owners are now trying to lift rent prices well before referendum, increasing at a rate of around 1
percent, but since mid-2018, the extremely punitive business sector and the lost opportunity of
multiple retail stores have pushed down average rents.
Population: Analysis of commercial real estate also relies on shifts in the economic factors
to explain patterns. Demographic transition has always affected properties too. When they head
into 2020, it will have when big an impact as ever. When more migrants come into the cities that
metropolitan population of the world is rising. The UK's biggest cities have expanded by about 1
9
growth has sunk just to 1.5 % in September to over 4% in the months leading up to the
referendum. In the commercial property sector, rental growth over last 12 months in September
decreases to 1.4 percent from 1.6 percent in August and in the mid-range quarterly Consensus
Investment Property Forum (IPF) expects annual growth of just 0.9 percent in 2018. This is
projected to fall to just 0.4 per cent in 2019. Decline in the rent has impacted all kinds of
commercial property but the market has both wallets of adaptability and lack of strength.
Rent growth for property rights managed to remain the much more expansive since Brexit,
trying to run at around 5 percent at the time of the election and, but on a declining trend
throughout the past three months, still trying to run at around 4 percent per year. Rents for office
space plummeted from 7 percent per annum to nearly 1 percent after the referendum, but has
steadily dropped sharply since mid-2017 to sit at more than 1.5 percent today.
Figure 8 New commercial properties, 2019.
The last one is retail property that has become the economy's saddest-performing section.
Owners are now trying to lift rent prices well before referendum, increasing at a rate of around 1
percent, but since mid-2018, the extremely punitive business sector and the lost opportunity of
multiple retail stores have pushed down average rents.
Population: Analysis of commercial real estate also relies on shifts in the economic factors
to explain patterns. Demographic transition has always affected properties too. When they head
into 2020, it will have when big an impact as ever. When more migrants come into the cities that
metropolitan population of the world is rising. The UK's biggest cities have expanded by about 1
9
per cent each year in recent times, and this trend is projected to begin in 2020. Economic
development has regularly reshaped residential neighbourhoods around town centres. In turn,
business owners historically located in city centre were drawn into such areas, with an additional
travel motivation becoming the lack of new UK office buildings in established markets.
This pattern is more apparent in London; from 1988- 2015, Hackney's London Borough
witnessed 42 per cent population increase, with a further 23 per cent anticipated by 2019.
As a result, the city has seen one of London’s highest levels of job growth, which has led to
high rental prices for offices. Premium office rent prices in the north and east regions of the
Square Mile had also risen by upwards of 120 per cent. When residents concentrate on these
locations in 2020, rental demand could exceed typical big city key components from across UK.
When the change to city life is more noticeable, the conventional markets will outclass these
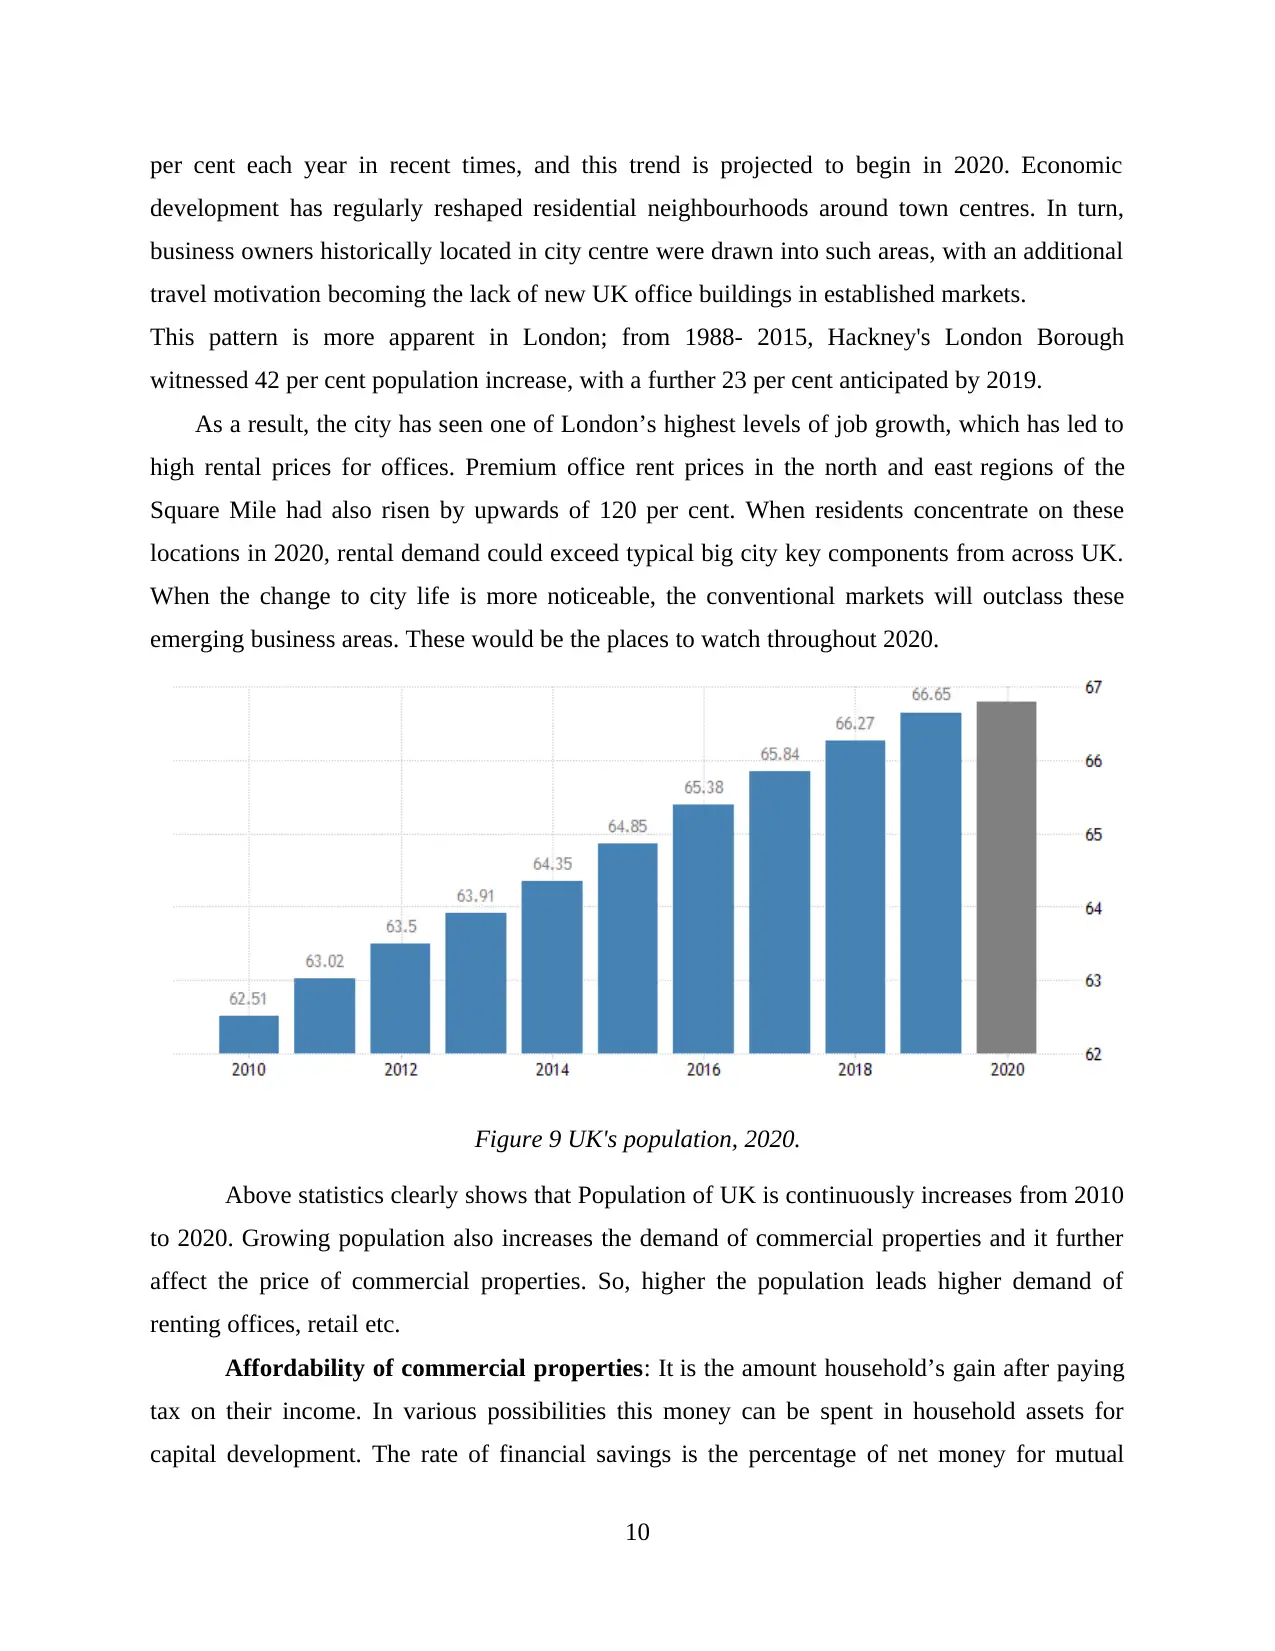
emerging business areas. These would be the places to watch throughout 2020.
Figure 9 UK's population, 2020.
Above statistics clearly shows that Population of UK is continuously increases from 2010
to 2020. Growing population also increases the demand of commercial properties and it further
affect the price of commercial properties. So, higher the population leads higher demand of
renting offices, retail etc.
Affordability of commercial properties: It is the amount household’s gain after paying
tax on their income. In various possibilities this money can be spent in household assets for
capital development. The rate of financial savings is the percentage of net money for mutual
10
development has regularly reshaped residential neighbourhoods around town centres. In turn,
business owners historically located in city centre were drawn into such areas, with an additional
travel motivation becoming the lack of new UK office buildings in established markets.
This pattern is more apparent in London; from 1988- 2015, Hackney's London Borough
witnessed 42 per cent population increase, with a further 23 per cent anticipated by 2019.
As a result, the city has seen one of London’s highest levels of job growth, which has led to
high rental prices for offices. Premium office rent prices in the north and east regions of the
Square Mile had also risen by upwards of 120 per cent. When residents concentrate on these
locations in 2020, rental demand could exceed typical big city key components from across UK.
When the change to city life is more noticeable, the conventional markets will outclass these
emerging business areas. These would be the places to watch throughout 2020.
Figure 9 UK's population, 2020.
Above statistics clearly shows that Population of UK is continuously increases from 2010
to 2020. Growing population also increases the demand of commercial properties and it further
affect the price of commercial properties. So, higher the population leads higher demand of
renting offices, retail etc.
Affordability of commercial properties: It is the amount household’s gain after paying
tax on their income. In various possibilities this money can be spent in household assets for
capital development. The rate of financial savings is the percentage of net money for mutual
10
⊘ This is a preview!⊘
Do you want full access?
Subscribe today to unlock all pages.
Trusted by 1+ million students worldwide
1 out of 15
Related Documents


Your All-in-One AI-Powered Toolkit for Academic Success.
+13062052269
info@desklib.com
Available 24*7 on WhatsApp / Email
![[object Object]](/_next/static/media/star-bottom.7253800d.svg)
Unlock your academic potential
Copyright © 2020–2026 A2Z Services. All Rights Reserved. Developed and managed by ZUCOL.