Comprehensive Research Report: Wine Consumption Factors in New Zealand
VerifiedAdded on 2022/08/21
|16
|3201
|15
Report
AI Summary
This research report investigates the factors influencing wine consumption in New Zealand, focusing on consumer preferences and purchase behaviors. The study collected data from a sample of 100 individuals in Auckland through personal interviews, addressing research questions related to influential factors, gender-based consumption differences, and age group variations. Statistical methods, including descriptive statistics, correlation analysis, multiple regression, and t-tests, were employed to analyze the data. The findings reveal that while price, recommendation, and brand recognition significantly impact wine consumption, the overall regression model explains only a small percentage of the variation. The study also found no significant difference in wine consumption between genders, but age group differences were observed. The report provides insights into consumer behavior and market trends within the New Zealand wine industry, offering valuable information for businesses and policymakers.
Running head: Factors Influencing Customers Wine Purchases & Product Attributes
Preferences
Factors Influencing Customers Wine Purchases & Product Attributes Preferences
Name of the Student
Name of the University
Author Note
Preferences
Factors Influencing Customers Wine Purchases & Product Attributes Preferences
Name of the Student
Name of the University
Author Note
Paraphrase This Document
Need a fresh take? Get an instant paraphrase of this document with our AI Paraphraser
1Factors Influencing Customers Wine Purchases & Product Attributes Preferences
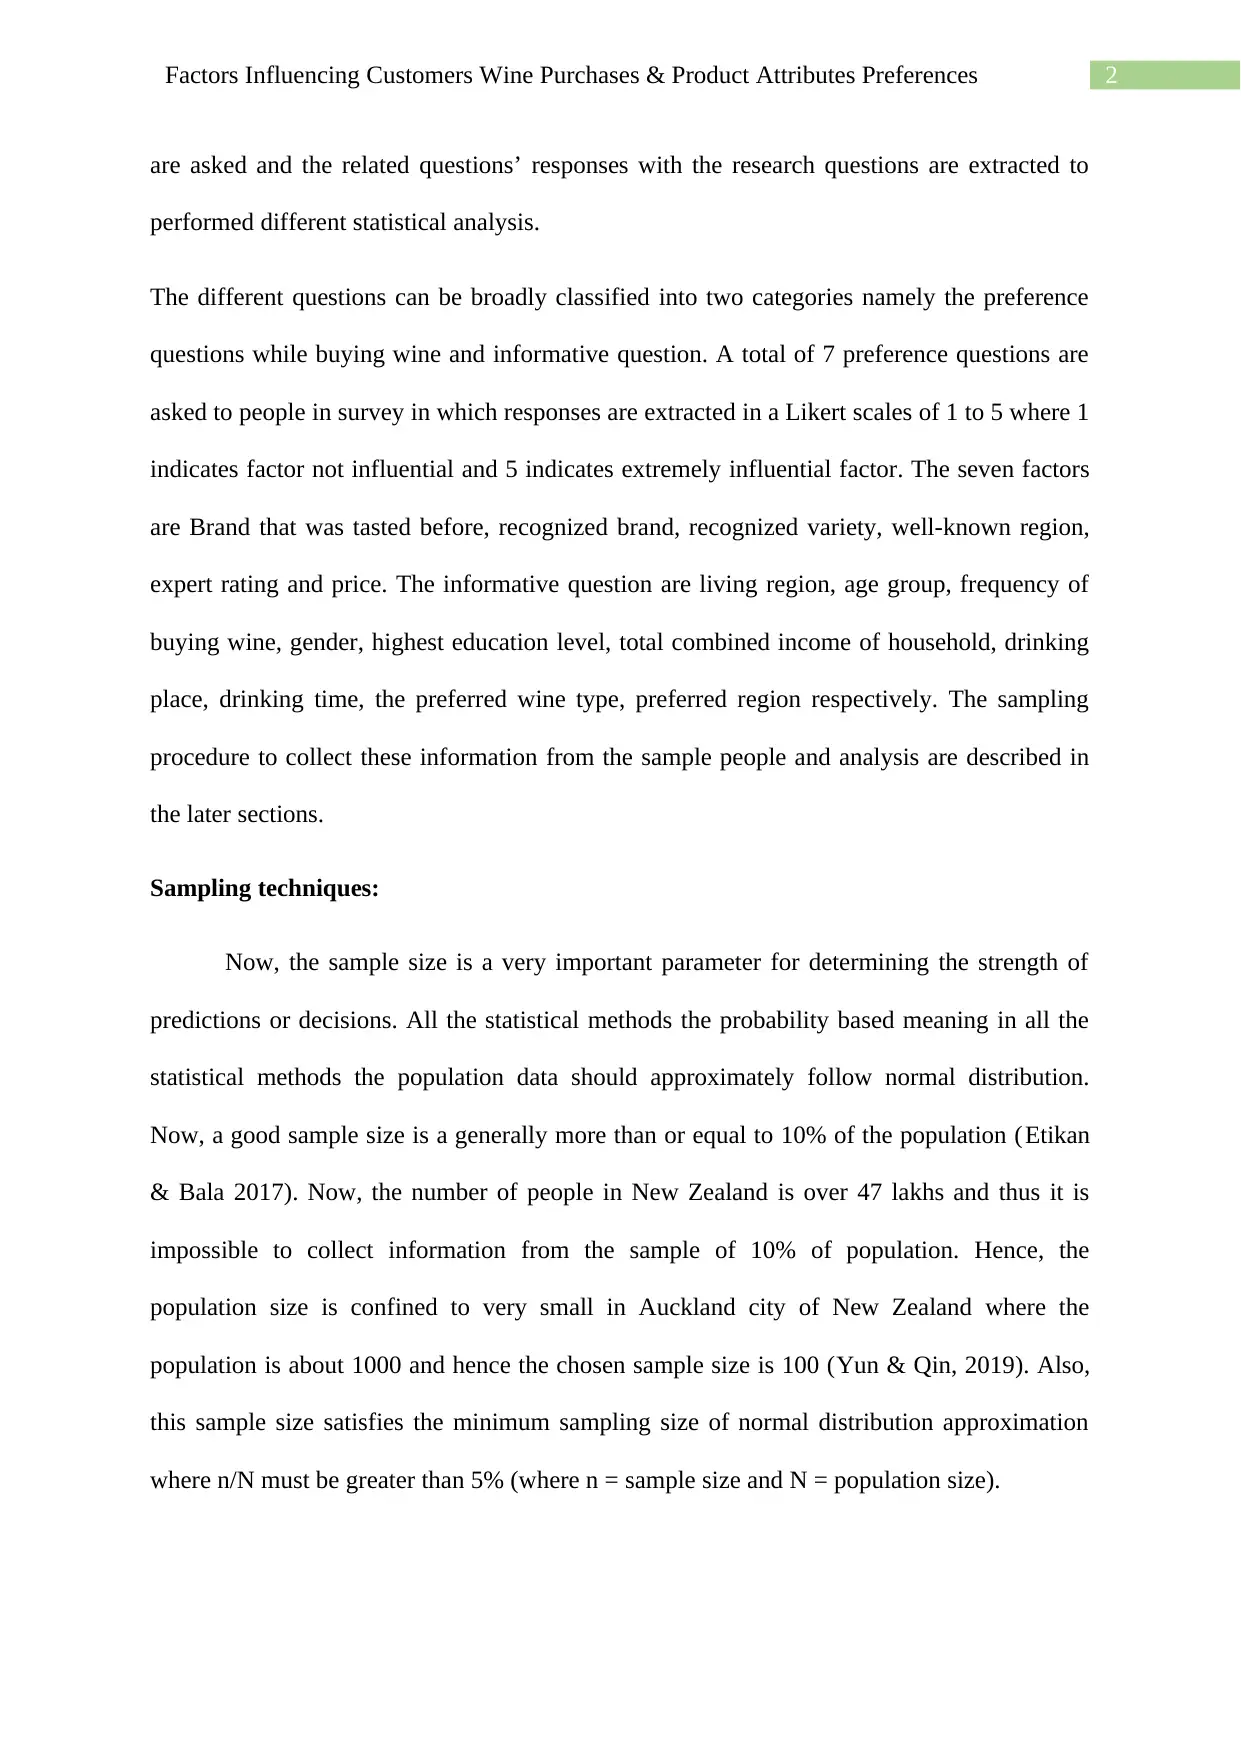
Introduction:
In this particular research the objective is to find the most influential factors of wine
consumption in New Zealand and the variation of wine consumption by different qualitative
variables like age, gender etc. Wine consumption is an important section to focus on as it has
several health benefits to people that includes guarding microbiome and cardiovascular
health, resveratrol can improve health of heart, increasing omega-3 fatty acids, reducing
chance of type-2 diabetes, keeping the health of blood vessels and thus the blood pressure,
preventing brain damage after stroke, prevents loss of vision, prevents colon cancer, prevents
breast cancer, prevents lung cancer by improving the function of lung, protection from
prostate cancer etc. However, excessive wine consumption can also affect health by means of
addiction, depression, mental problems, cardiomyopathy, arrhythmias, stroke, hypertension,
fatty liver, cirrhosis, pancreatitis and other several major or minor problems (Giacosa, 2019).
Hence, if the factors that contributes significantly towards buying wines are known then wine
consumption can be predicted for individuals and several measures can be recommended to
the person for either increasing or decreasing consumption of the person or its time based on
current consumption level. Hence, three research questions are formed which are attempted to
answer by data collection of wine consumption and then applying appropriate statistical
methods to obtain the decisions.
Q1: The main influential factors that significantly effects wine consumption.
Q2: Whether wine consumption differs by gender.
Q3: Do wine consumption is different for different age groups.
All of these questions are not directly asked to the people in the sample, however, some
qualitative and nominal questions about their physical, economical and qualitative questions
2Factors Influencing Customers Wine Purchases & Product Attributes Preferences
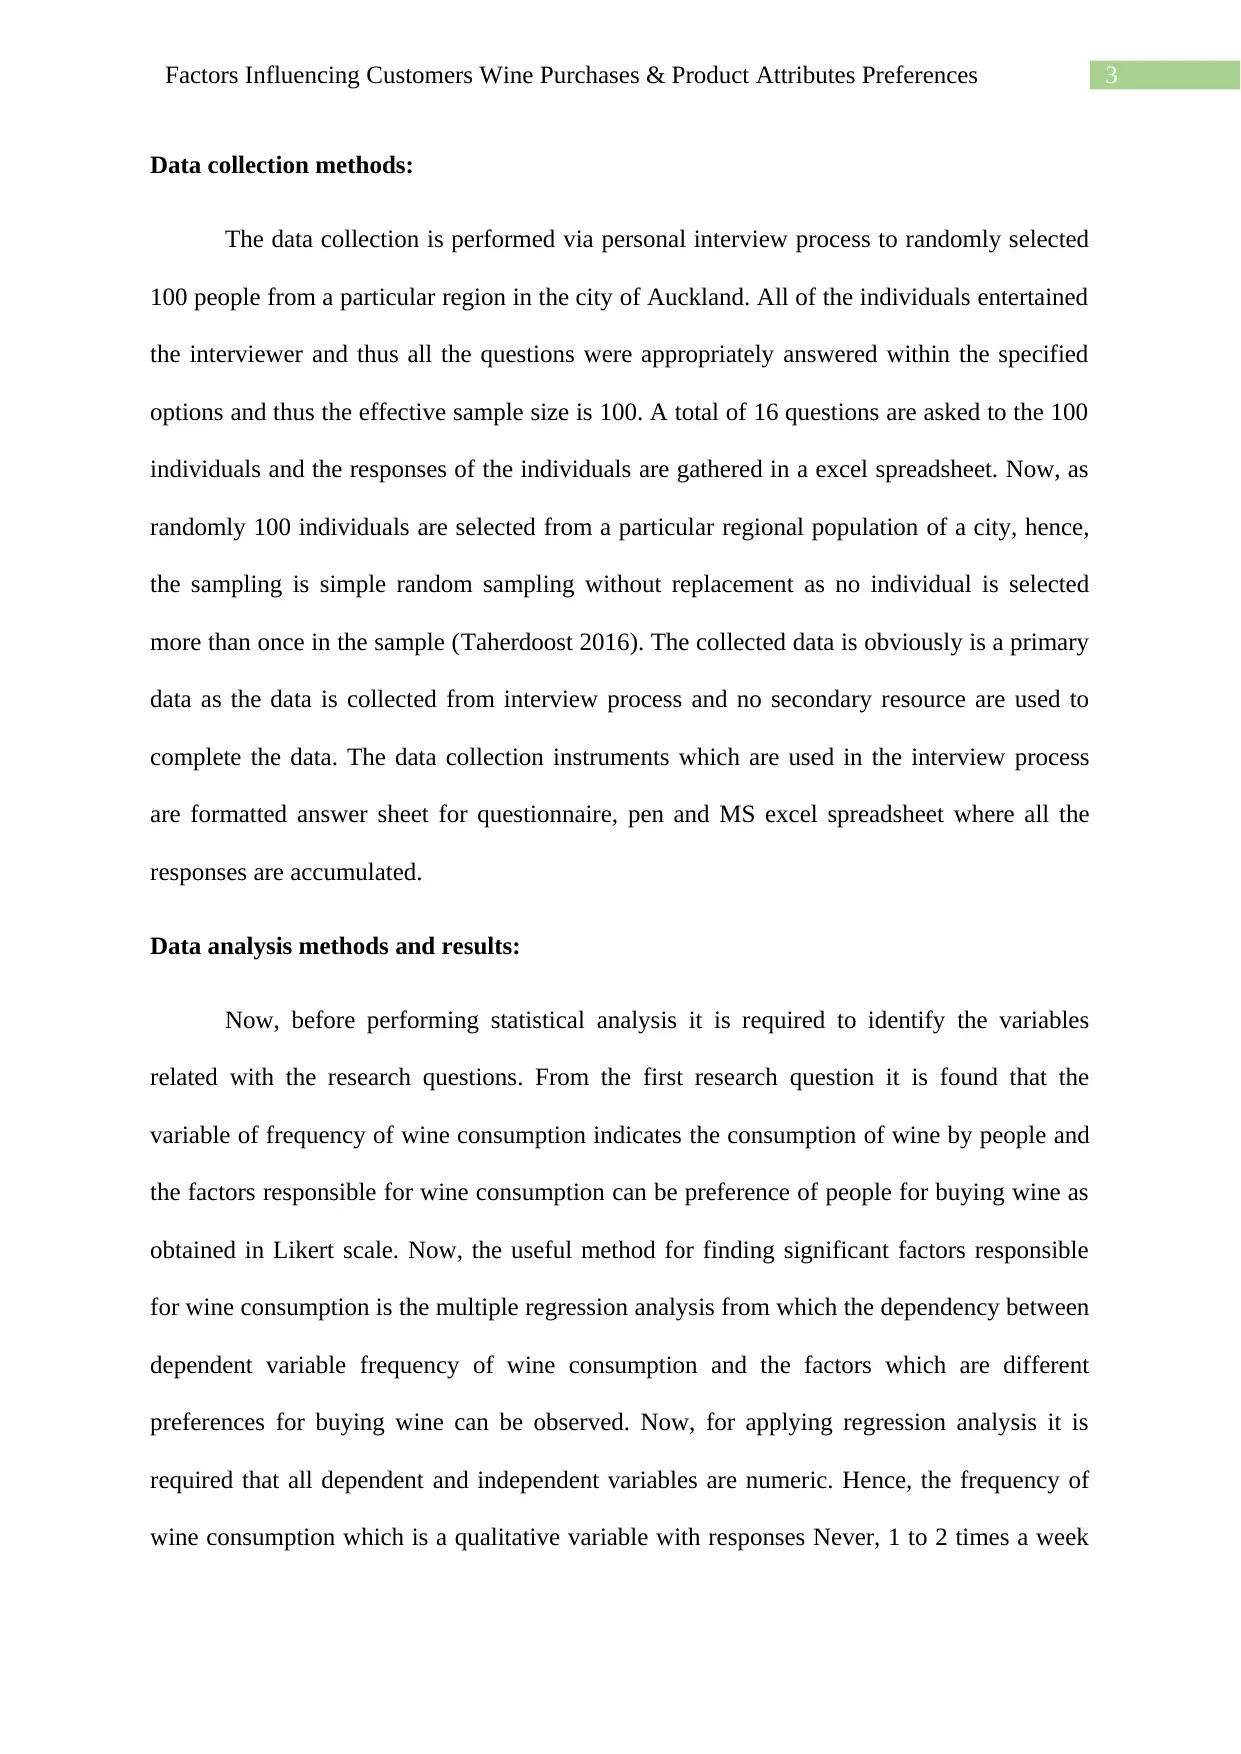
are asked and the related questions’ responses with the research questions are extracted to
performed different statistical analysis.
The different questions can be broadly classified into two categories namely the preference
questions while buying wine and informative question. A total of 7 preference questions are
asked to people in survey in which responses are extracted in a Likert scales of 1 to 5 where 1
indicates factor not influential and 5 indicates extremely influential factor. The seven factors
are Brand that was tasted before, recognized brand, recognized variety, well-known region,
expert rating and price. The informative question are living region, age group, frequency of
buying wine, gender, highest education level, total combined income of household, drinking
place, drinking time, the preferred wine type, preferred region respectively. The sampling
procedure to collect these information from the sample people and analysis are described in
the later sections.
Sampling techniques:
Now, the sample size is a very important parameter for determining the strength of
predictions or decisions. All the statistical methods the probability based meaning in all the
statistical methods the population data should approximately follow normal distribution.
Now, a good sample size is a generally more than or equal to 10% of the population (Etikan
& Bala 2017). Now, the number of people in New Zealand is over 47 lakhs and thus it is
impossible to collect information from the sample of 10% of population. Hence, the
population size is confined to very small in Auckland city of New Zealand where the
population is about 1000 and hence the chosen sample size is 100 (Yun & Qin, 2019). Also,
this sample size satisfies the minimum sampling size of normal distribution approximation
where n/N must be greater than 5% (where n = sample size and N = population size).
⊘ This is a preview!⊘
Do you want full access?
Subscribe today to unlock all pages.
Trusted by 1+ million students worldwide
3Factors Influencing Customers Wine Purchases & Product Attributes Preferences
Data collection methods:
The data collection is performed via personal interview process to randomly selected
100 people from a particular region in the city of Auckland. All of the individuals entertained
the interviewer and thus all the questions were appropriately answered within the specified
options and thus the effective sample size is 100. A total of 16 questions are asked to the 100
individuals and the responses of the individuals are gathered in a excel spreadsheet. Now, as
randomly 100 individuals are selected from a particular regional population of a city, hence,
the sampling is simple random sampling without replacement as no individual is selected
more than once in the sample (Taherdoost 2016). The collected data is obviously is a primary
data as the data is collected from interview process and no secondary resource are used to
complete the data. The data collection instruments which are used in the interview process
are formatted answer sheet for questionnaire, pen and MS excel spreadsheet where all the
responses are accumulated.
Data analysis methods and results:
Now, before performing statistical analysis it is required to identify the variables
related with the research questions. From the first research question it is found that the
variable of frequency of wine consumption indicates the consumption of wine by people and
the factors responsible for wine consumption can be preference of people for buying wine as
obtained in Likert scale. Now, the useful method for finding significant factors responsible
for wine consumption is the multiple regression analysis from which the dependency between
dependent variable frequency of wine consumption and the factors which are different
preferences for buying wine can be observed. Now, for applying regression analysis it is
required that all dependent and independent variables are numeric. Hence, the frequency of
wine consumption which is a qualitative variable with responses Never, 1 to 2 times a week
Paraphrase This Document
Need a fresh take? Get an instant paraphrase of this document with our AI Paraphraser
4Factors Influencing Customers Wine Purchases & Product Attributes Preferences
and at least 3 times a week are converted to numeric standards 1, 2 and 3 respectively. This
conversion assumes high score for high wine consumption and low score for low wine
consumption.
Now, before performing the statistical tests in order to answer the research questions a
descriptive statistics of the numeric variables and the different visualizations of the wine
consumption frequency based on gender and age group are displayed by using bar chart and
pie chart respectively.
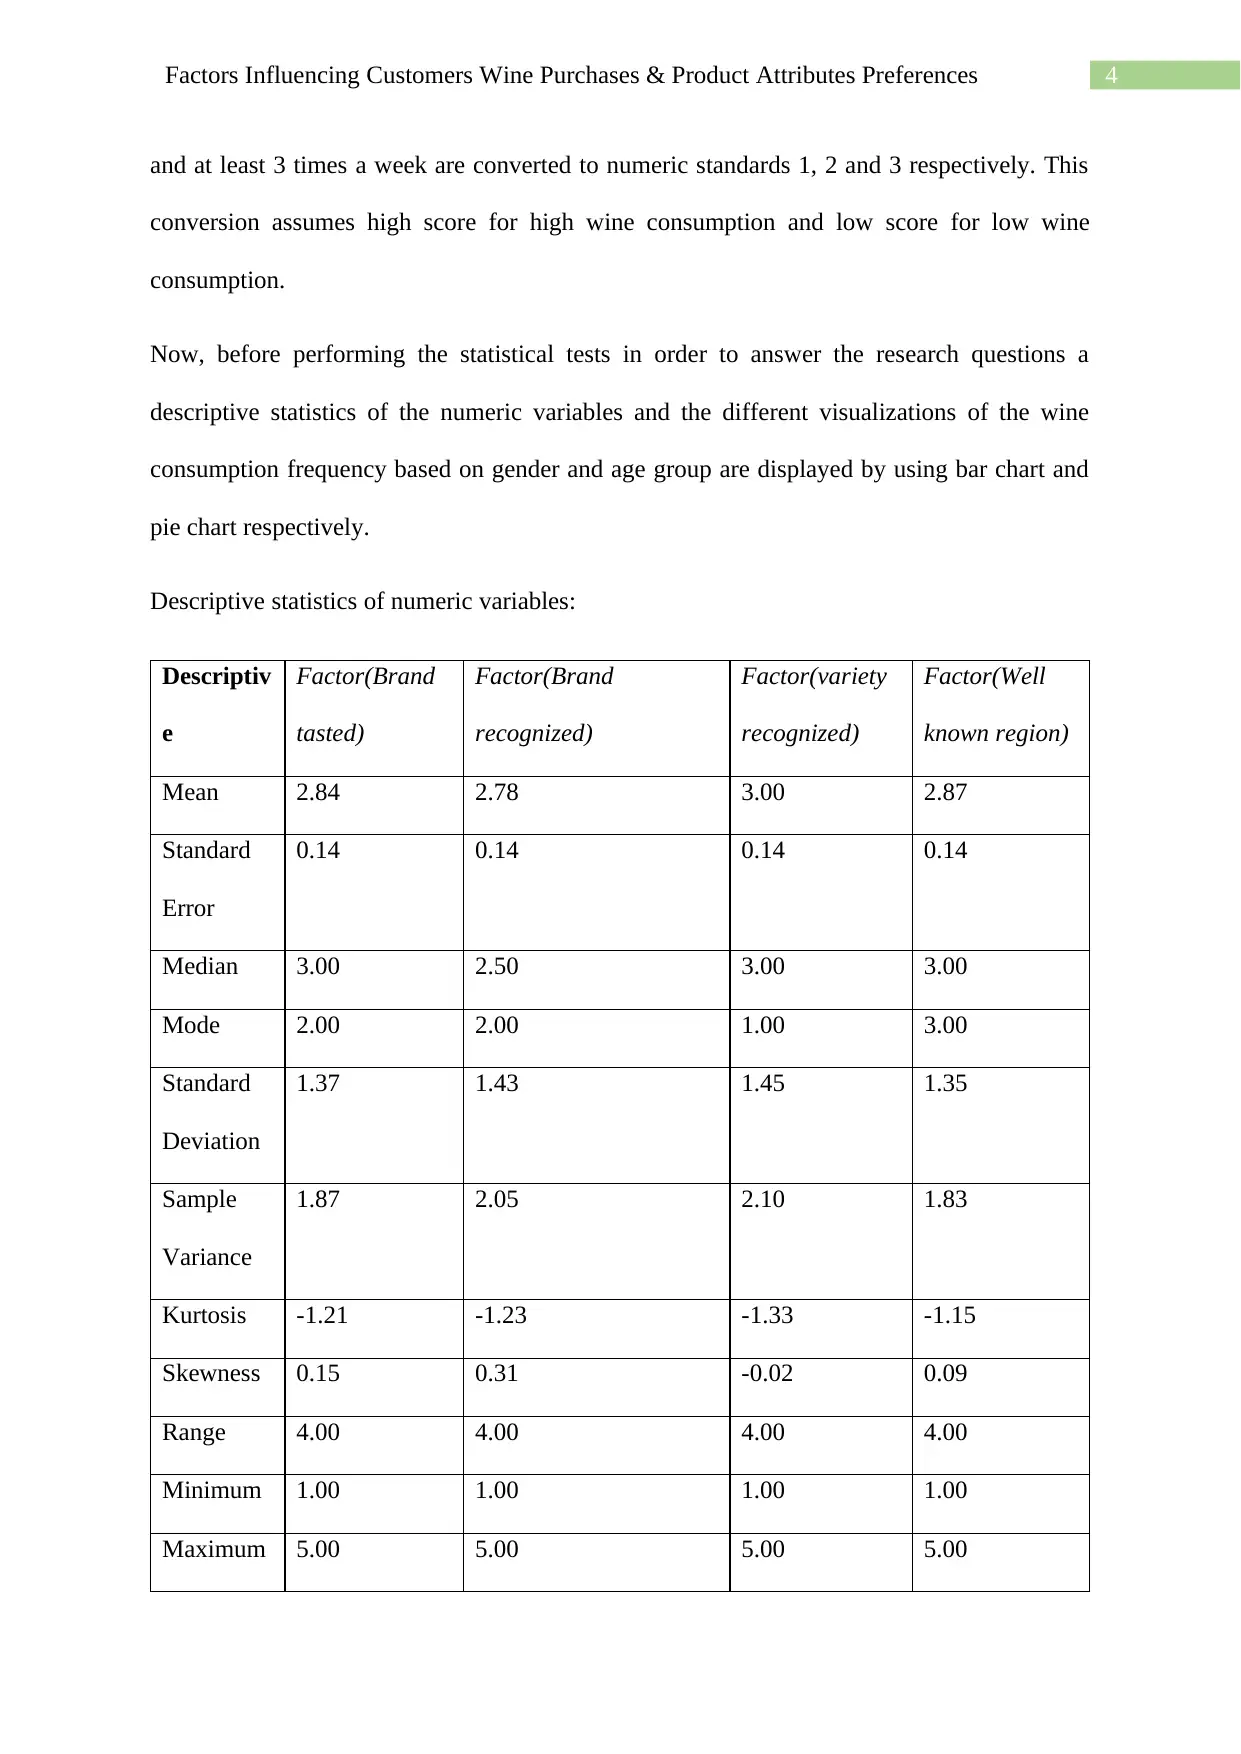
Descriptive statistics of numeric variables:
Descriptiv
e
Factor(Brand
tasted)
Factor(Brand
recognized)
Factor(variety
recognized)
Factor(Well
known region)
Mean 2.84 2.78 3.00 2.87
Standard
Error
0.14 0.14 0.14 0.14
Median 3.00 2.50 3.00 3.00
Mode 2.00 2.00 1.00 3.00
Standard
Deviation
1.37 1.43 1.45 1.35
Sample
Variance
1.87 2.05 2.10 1.83
Kurtosis -1.21 -1.23 -1.33 -1.15
Skewness 0.15 0.31 -0.02 0.09
Range 4.00 4.00 4.00 4.00
Minimum 1.00 1.00 1.00 1.00
Maximum 5.00 5.00 5.00 5.00
and at least 3 times a week are converted to numeric standards 1, 2 and 3 respectively. This
conversion assumes high score for high wine consumption and low score for low wine
consumption.
Now, before performing the statistical tests in order to answer the research questions a
descriptive statistics of the numeric variables and the different visualizations of the wine
consumption frequency based on gender and age group are displayed by using bar chart and
pie chart respectively.
Descriptive statistics of numeric variables:
Descriptiv
e
Factor(Brand
tasted)
Factor(Brand
recognized)
Factor(variety
recognized)
Factor(Well
known region)
Mean 2.84 2.78 3.00 2.87
Standard
Error
0.14 0.14 0.14 0.14
Median 3.00 2.50 3.00 3.00
Mode 2.00 2.00 1.00 3.00
Standard
Deviation
1.37 1.43 1.45 1.35
Sample
Variance
1.87 2.05 2.10 1.83
Kurtosis -1.21 -1.23 -1.33 -1.15
Skewness 0.15 0.31 -0.02 0.09
Range 4.00 4.00 4.00 4.00
Minimum 1.00 1.00 1.00 1.00
Maximum 5.00 5.00 5.00 5.00
5Factors Influencing Customers Wine Purchases & Product Attributes Preferences
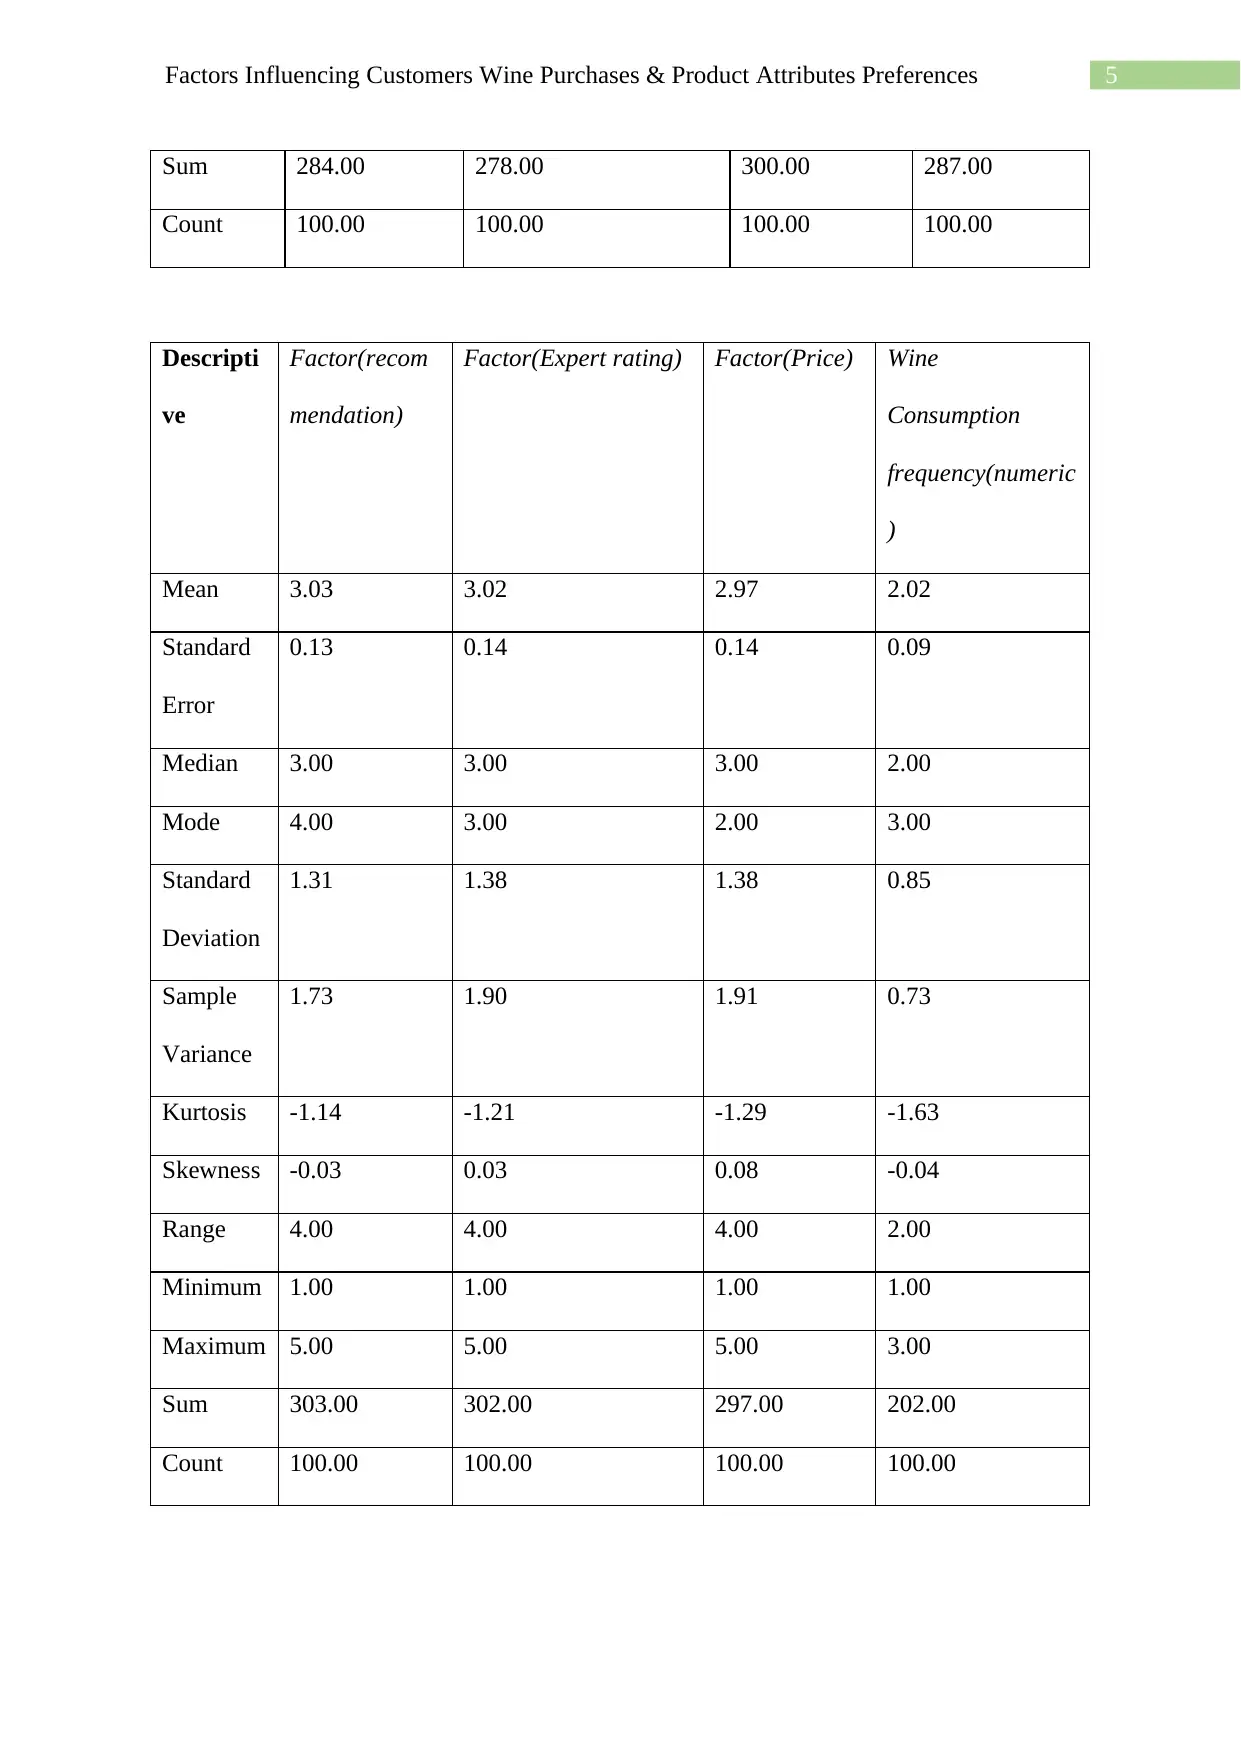
Sum 284.00 278.00 300.00 287.00
Count 100.00 100.00 100.00 100.00
Descripti
ve
Factor(recom
mendation)
Factor(Expert rating) Factor(Price) Wine
Consumption
frequency(numeric
)
Mean 3.03 3.02 2.97 2.02
Standard
Error
0.13 0.14 0.14 0.09
Median 3.00 3.00 3.00 2.00
Mode 4.00 3.00 2.00 3.00
Standard
Deviation
1.31 1.38 1.38 0.85
Sample
Variance
1.73 1.90 1.91 0.73
Kurtosis -1.14 -1.21 -1.29 -1.63
Skewness -0.03 0.03 0.08 -0.04
Range 4.00 4.00 4.00 2.00
Minimum 1.00 1.00 1.00 1.00
Maximum 5.00 5.00 5.00 3.00
Sum 303.00 302.00 297.00 202.00
Count 100.00 100.00 100.00 100.00
⊘ This is a preview!⊘
Do you want full access?
Subscribe today to unlock all pages.
Trusted by 1+ million students worldwide
6Factors Influencing Customers Wine Purchases & Product Attributes Preferences
It can be seen from the descriptive statistics that the average wine consumption frequency is
very close to 2 or this indicates that average number of people in the sample drink wine at
least 1 to 2 times in a week. Also, the influence of the factors on an average is very close to 3
and hence it can be stated that all the factors while buying wine are somewhat influential for
all the 100 people.
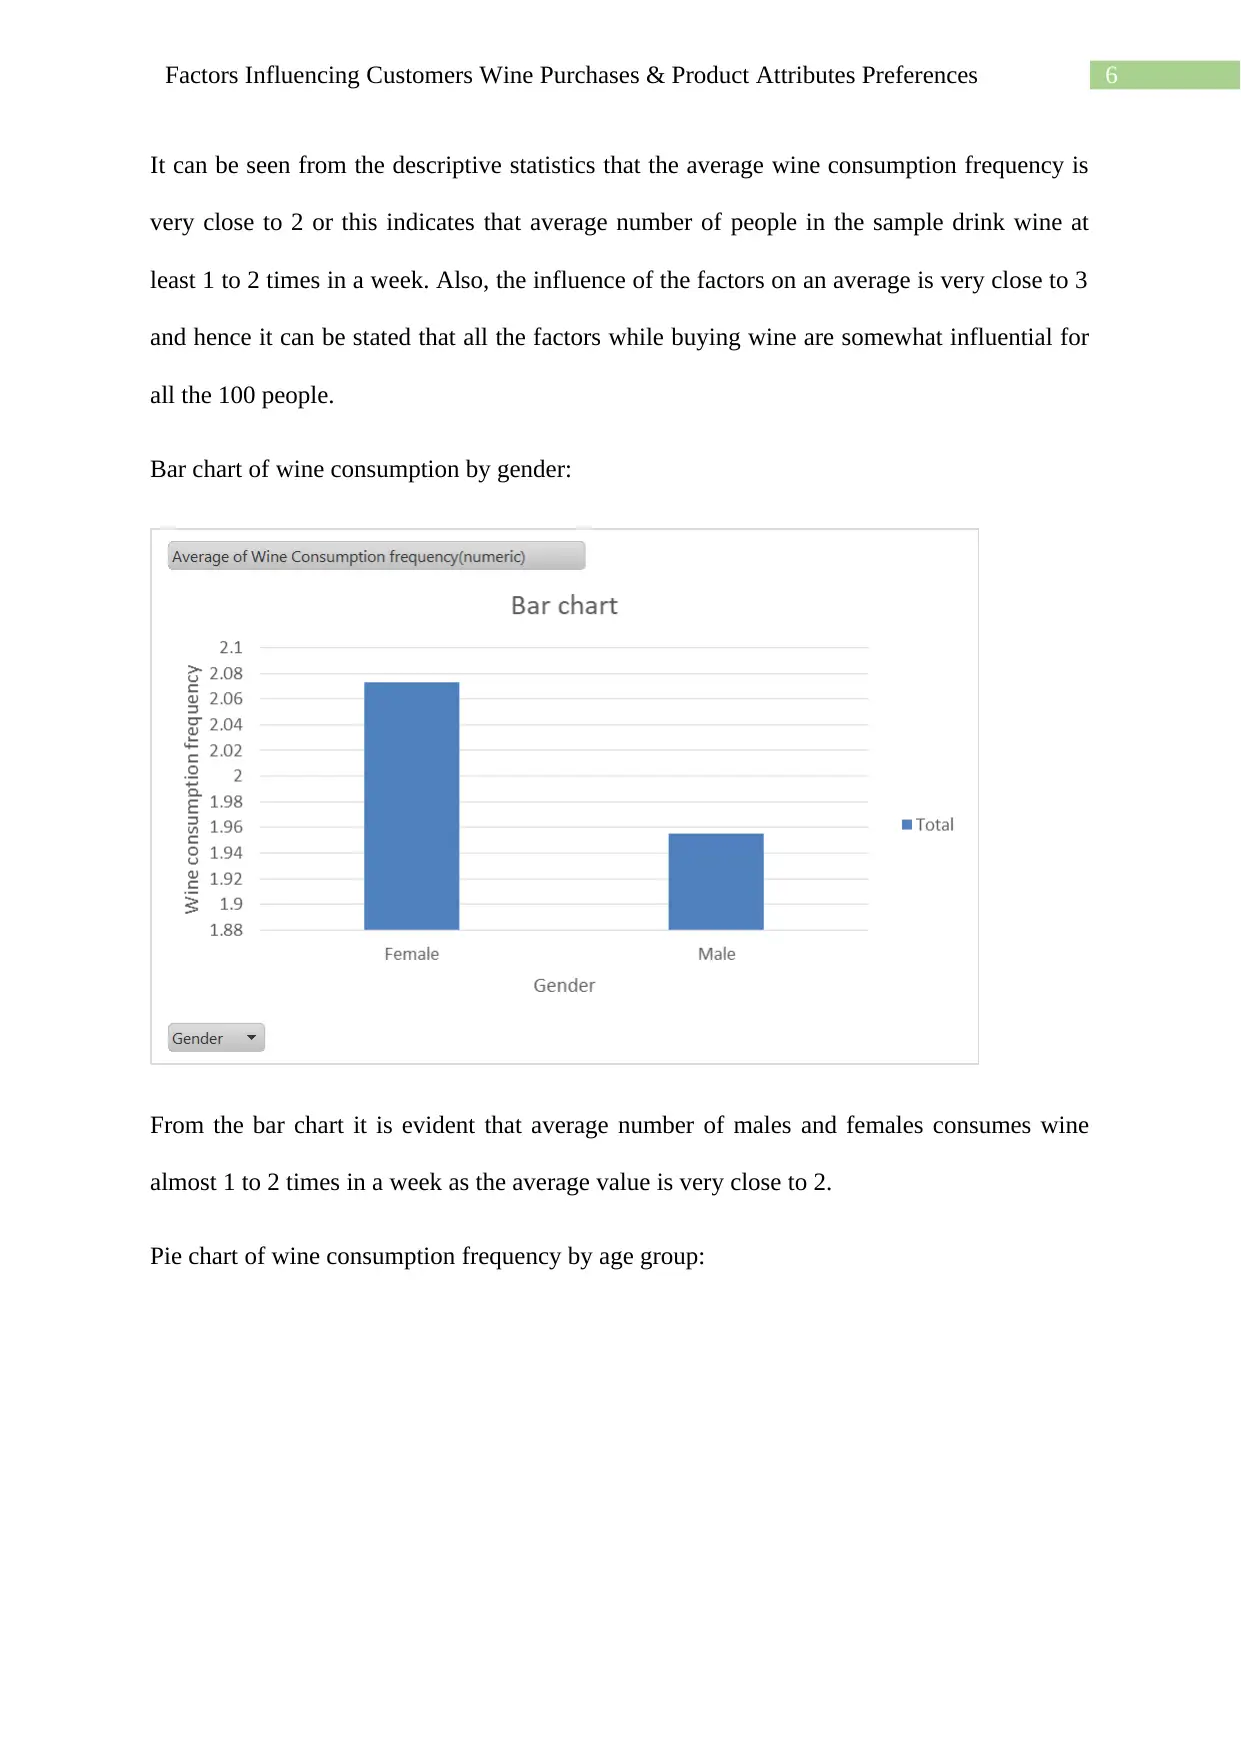
Bar chart of wine consumption by gender:
From the bar chart it is evident that average number of males and females consumes wine
almost 1 to 2 times in a week as the average value is very close to 2.
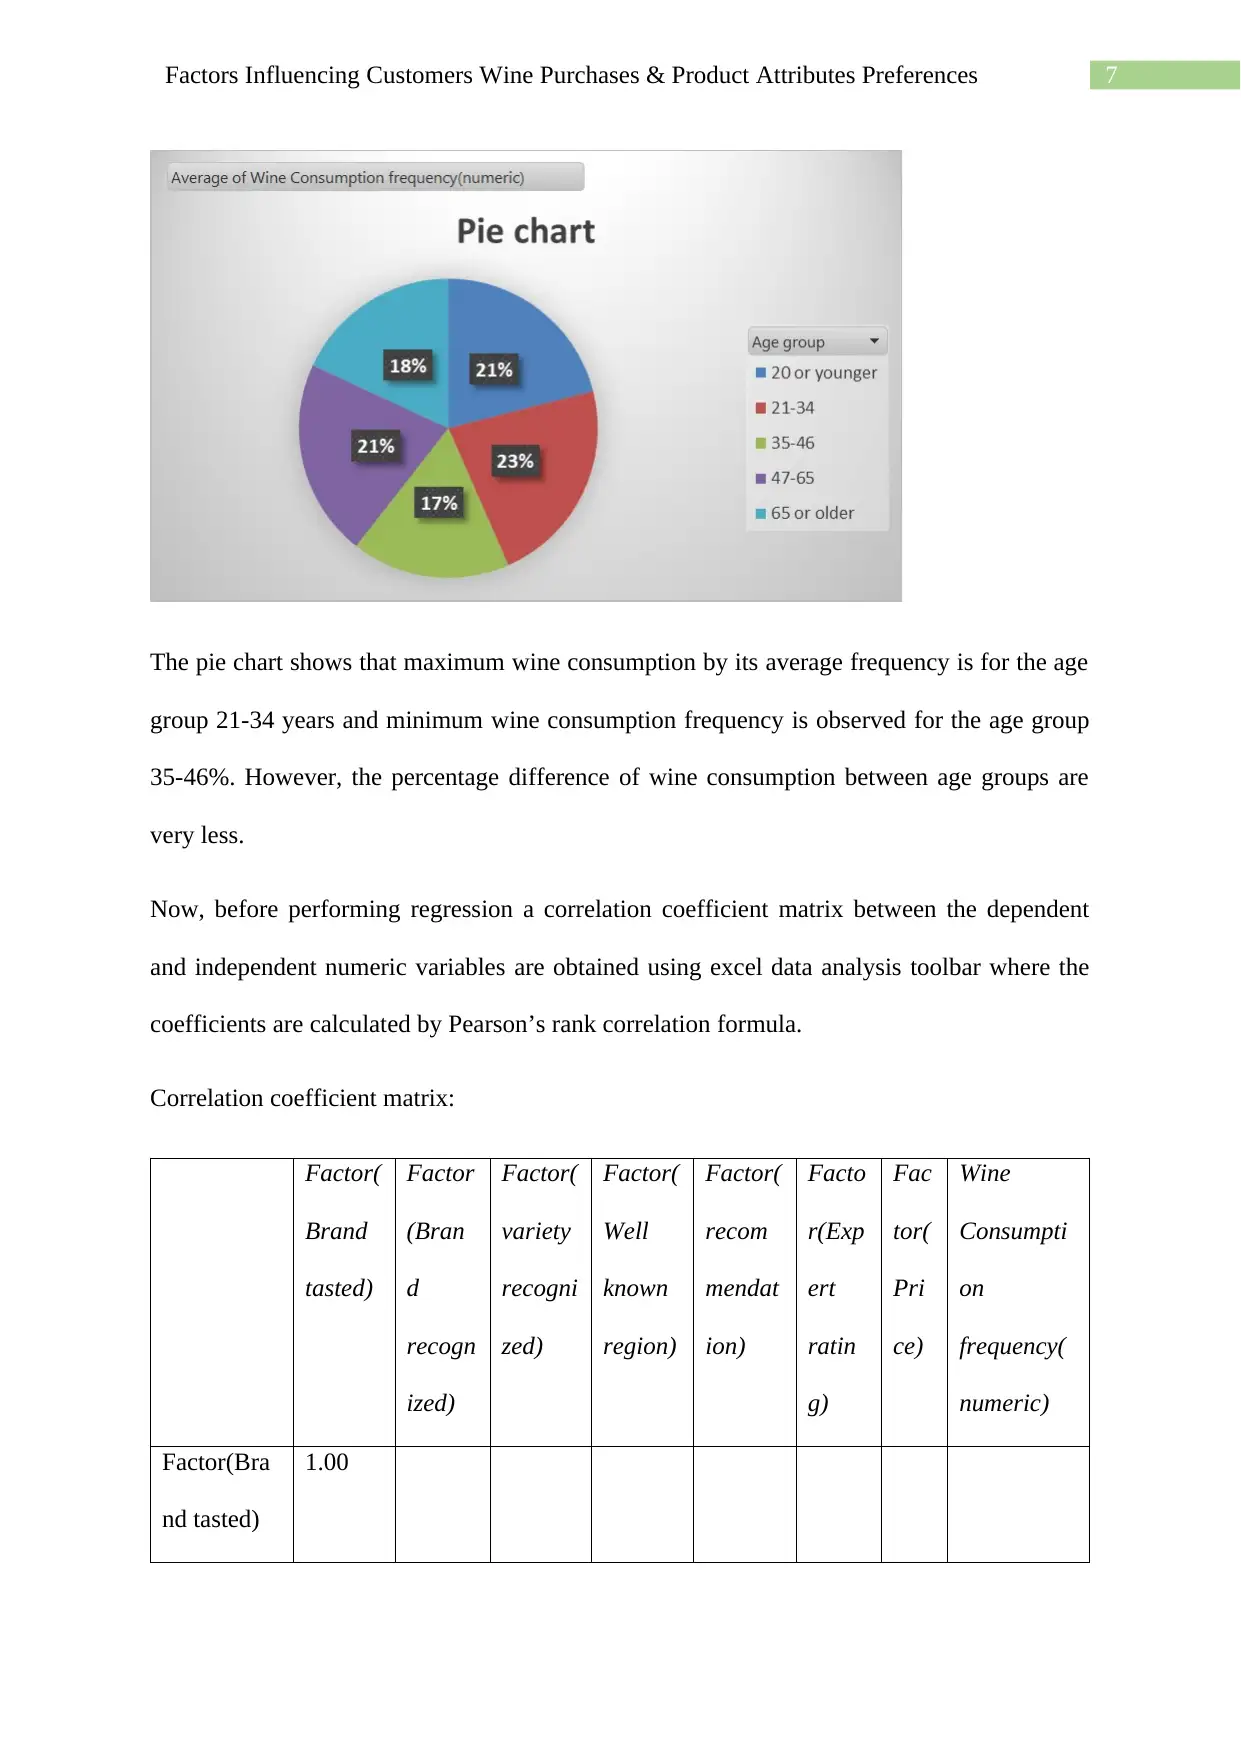
Pie chart of wine consumption frequency by age group:
It can be seen from the descriptive statistics that the average wine consumption frequency is
very close to 2 or this indicates that average number of people in the sample drink wine at
least 1 to 2 times in a week. Also, the influence of the factors on an average is very close to 3
and hence it can be stated that all the factors while buying wine are somewhat influential for
all the 100 people.
Bar chart of wine consumption by gender:
From the bar chart it is evident that average number of males and females consumes wine
almost 1 to 2 times in a week as the average value is very close to 2.
Pie chart of wine consumption frequency by age group:
Paraphrase This Document
Need a fresh take? Get an instant paraphrase of this document with our AI Paraphraser
7Factors Influencing Customers Wine Purchases & Product Attributes Preferences
The pie chart shows that maximum wine consumption by its average frequency is for the age
group 21-34 years and minimum wine consumption frequency is observed for the age group
35-46%. However, the percentage difference of wine consumption between age groups are
very less.
Now, before performing regression a correlation coefficient matrix between the dependent
and independent numeric variables are obtained using excel data analysis toolbar where the
coefficients are calculated by Pearson’s rank correlation formula.
Correlation coefficient matrix:
Factor(
Brand
tasted)
Factor
(Bran
d
recogn
ized)
Factor(
variety
recogni
zed)
Factor(
Well
known
region)
Factor(
recom
mendat
ion)
Facto
r(Exp
ert
ratin
g)
Fac
tor(
Pri
ce)
Wine
Consumpti
on
frequency(
numeric)
Factor(Bra
nd tasted)
1.00
8Factors Influencing Customers Wine Purchases & Product Attributes Preferences
Factor(Bra
nd
recognized)
0.12 1.00
Factor(vari
ety
recognized)
-0.10 0.01 1.00
Factor(Wel
l known
region)
-0.02 0.01 -0.13 1.00
Factor(reco
mmendatio
n)
-0.05 -0.15 0.08 -0.19 1.00
Factor(Exp
ert rating)
-0.29 0.01 0.07 0.10 0.06 1.00
Factor(Pric
e)
0.05 -0.03 0.04 -0.08 0.11 0.02 1.00
Wine
Consumpti
on
frequency(
numeric)
0.07 -0.17 -0.14 0.08 -0.30 -0.08 0.22 1.00
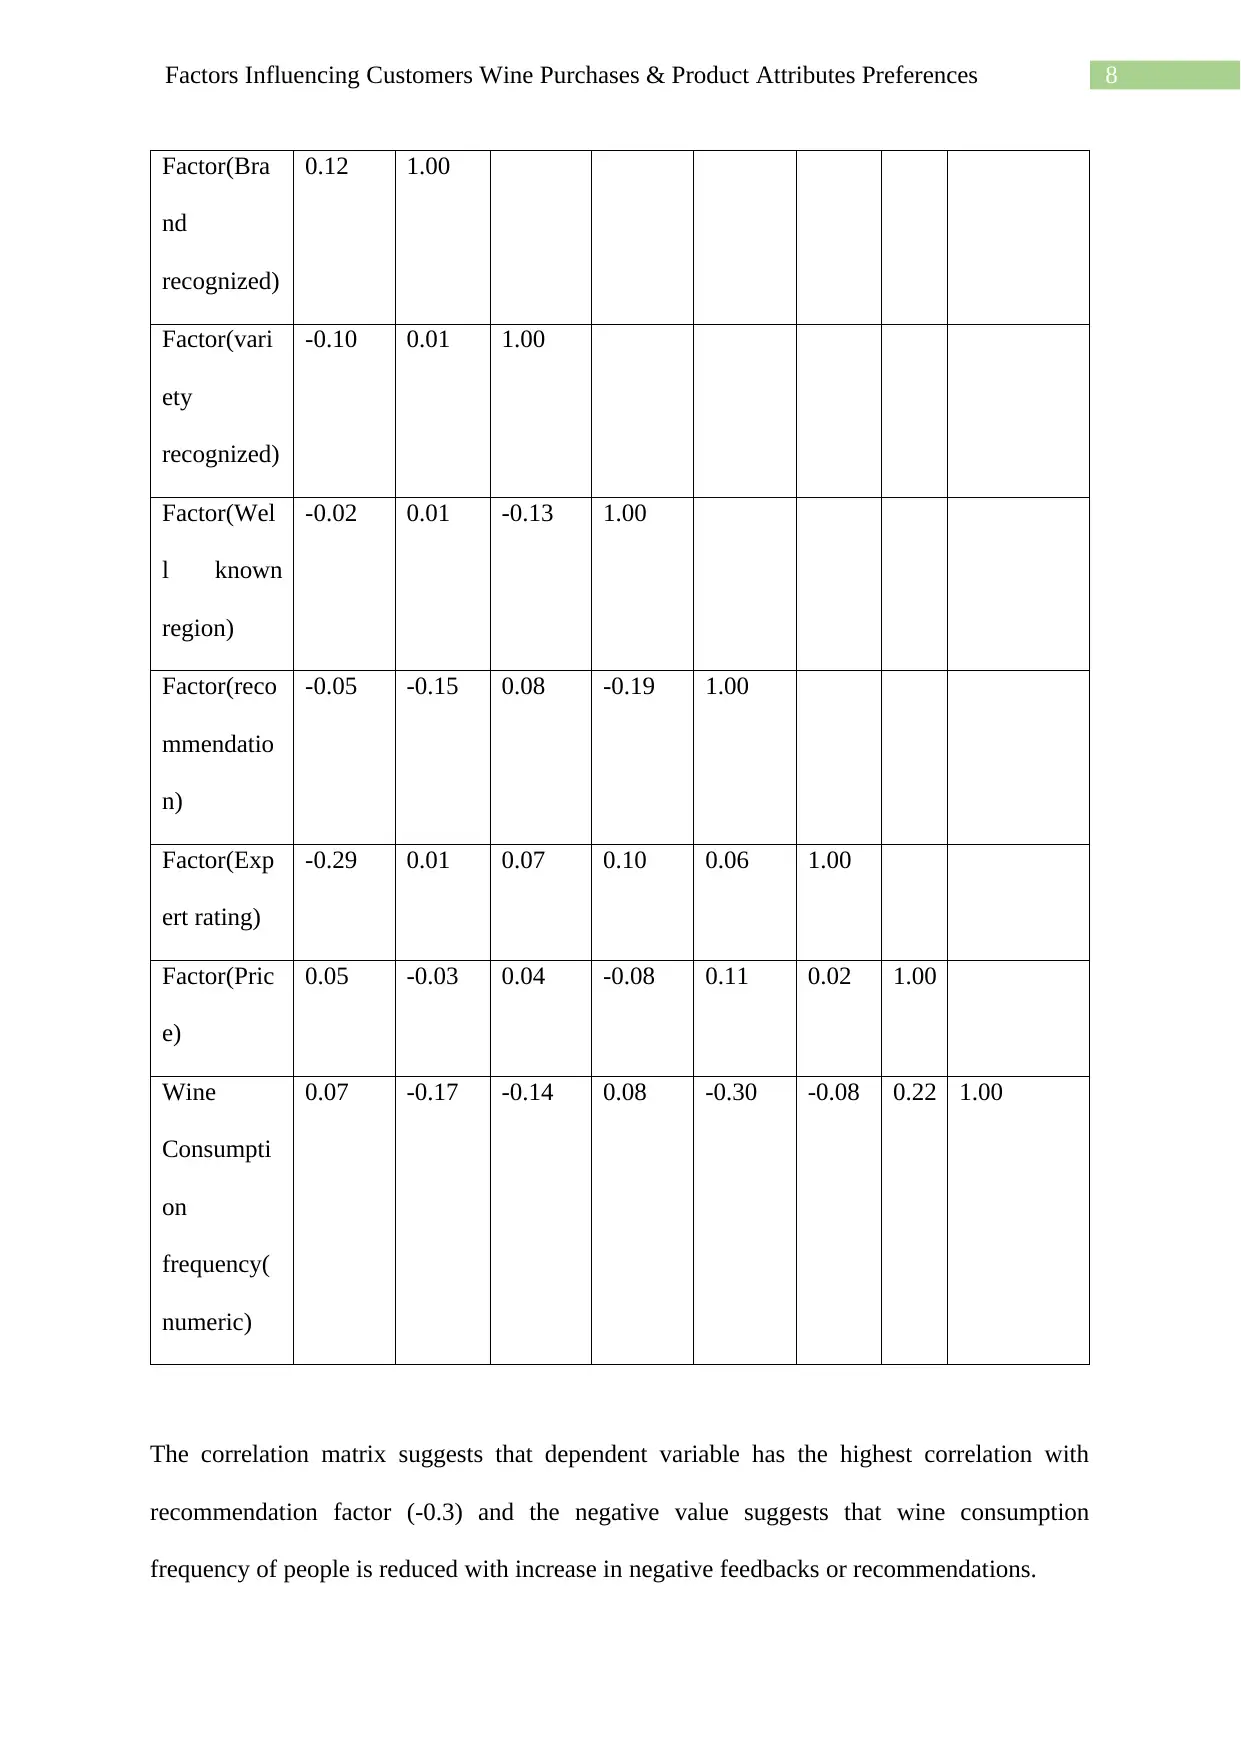
The correlation matrix suggests that dependent variable has the highest correlation with
recommendation factor (-0.3) and the negative value suggests that wine consumption
frequency of people is reduced with increase in negative feedbacks or recommendations.
Factor(Bra
nd
recognized)
0.12 1.00
Factor(vari
ety
recognized)
-0.10 0.01 1.00
Factor(Wel
l known
region)
-0.02 0.01 -0.13 1.00
Factor(reco
mmendatio
n)
-0.05 -0.15 0.08 -0.19 1.00
Factor(Exp
ert rating)
-0.29 0.01 0.07 0.10 0.06 1.00
Factor(Pric
e)
0.05 -0.03 0.04 -0.08 0.11 0.02 1.00
Wine
Consumpti
on
frequency(
numeric)
0.07 -0.17 -0.14 0.08 -0.30 -0.08 0.22 1.00
The correlation matrix suggests that dependent variable has the highest correlation with
recommendation factor (-0.3) and the negative value suggests that wine consumption
frequency of people is reduced with increase in negative feedbacks or recommendations.
⊘ This is a preview!⊘
Do you want full access?
Subscribe today to unlock all pages.
Trusted by 1+ million students worldwide
9Factors Influencing Customers Wine Purchases & Product Attributes Preferences
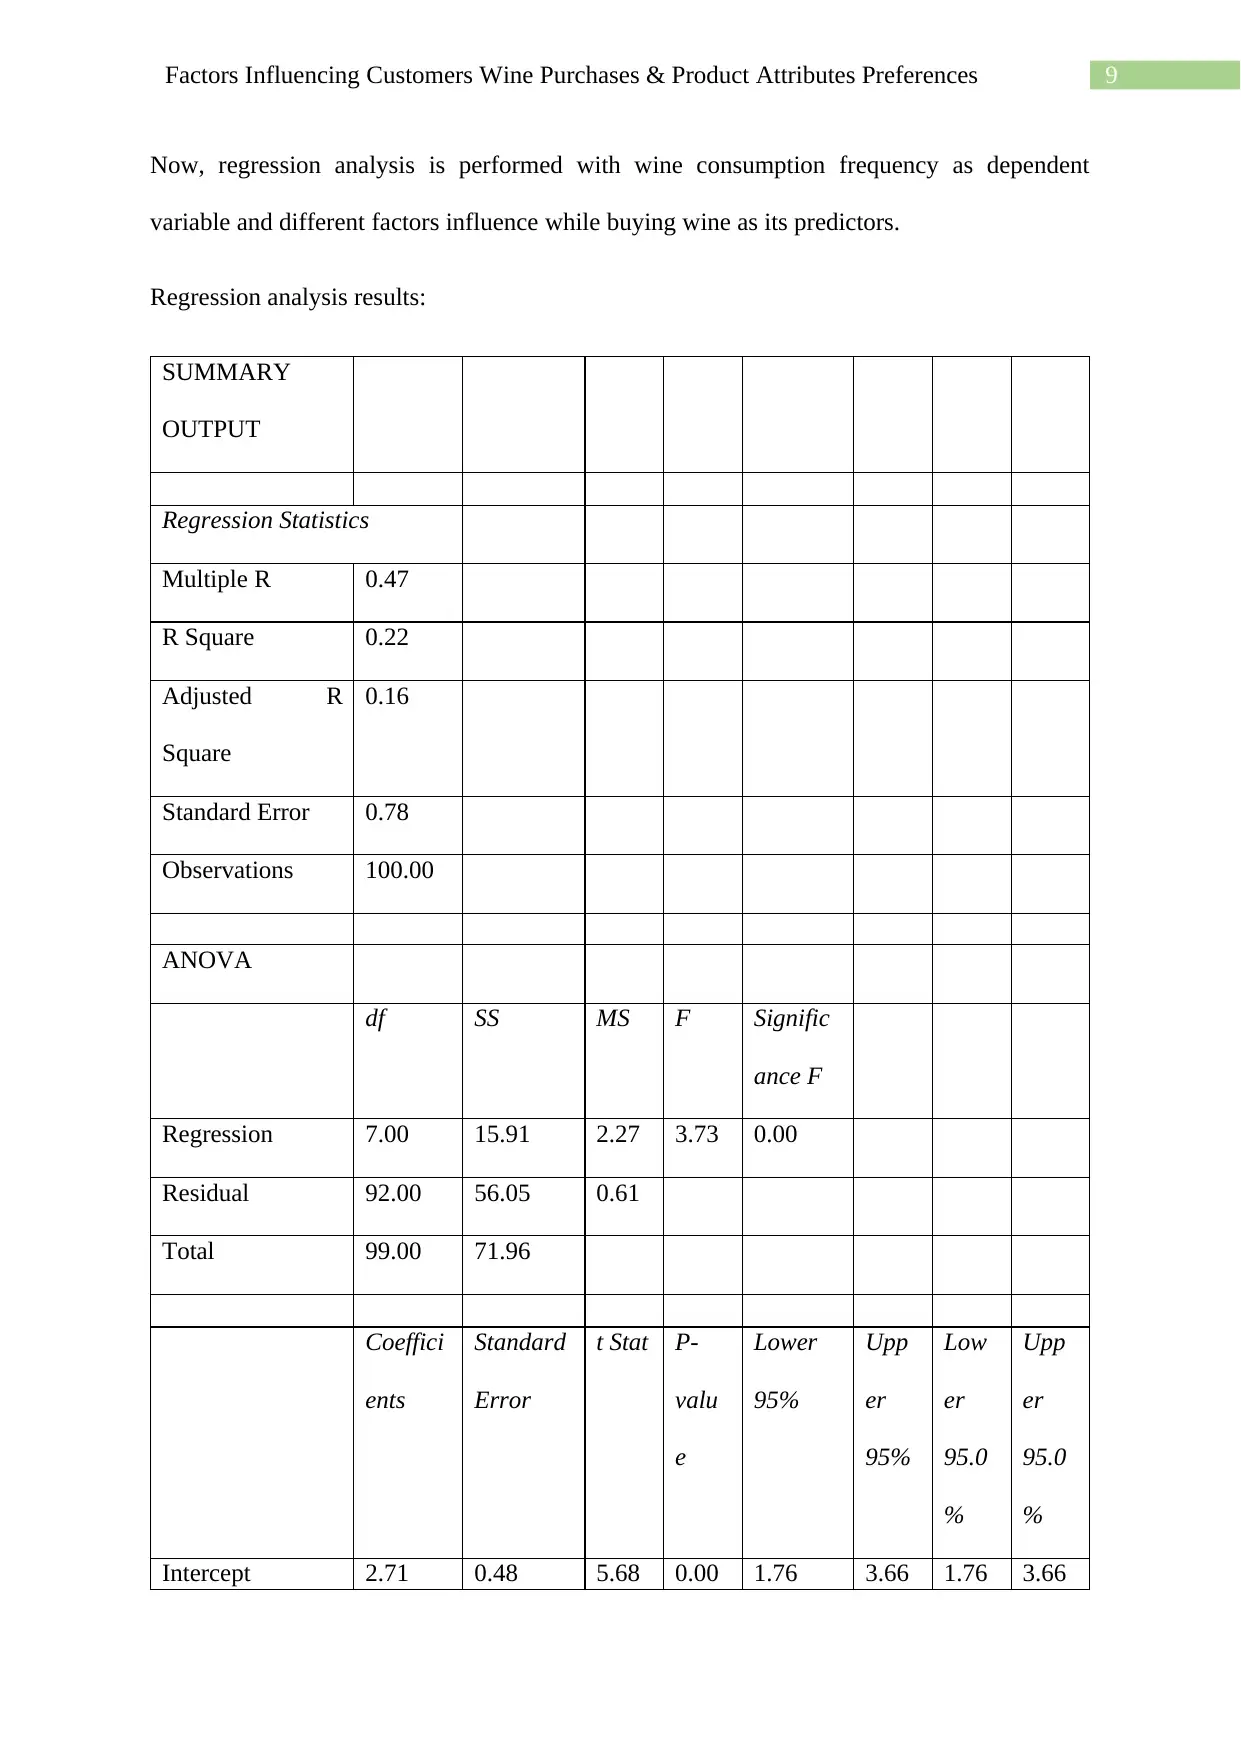
Now, regression analysis is performed with wine consumption frequency as dependent
variable and different factors influence while buying wine as its predictors.
Regression analysis results:
SUMMARY
OUTPUT
Regression Statistics
Multiple R 0.47
R Square 0.22
Adjusted R
Square
0.16
Standard Error 0.78
Observations 100.00
ANOVA
df SS MS F Signific
ance F
Regression 7.00 15.91 2.27 3.73 0.00
Residual 92.00 56.05 0.61
Total 99.00 71.96
Coeffici
ents
Standard
Error
t Stat P-
valu
e
Lower
95%
Upp
er
95%
Low
er
95.0
%
Upp
er
95.0
%
Intercept 2.71 0.48 5.68 0.00 1.76 3.66 1.76 3.66
Paraphrase This Document
Need a fresh take? Get an instant paraphrase of this document with our AI Paraphraser
10Factors Influencing Customers Wine Purchases & Product Attributes Preferences
Factor(Brand
tasted)
0.03 0.06 0.47 0.64 -0.09 0.15 -0.09 0.15
Factor(Brand
recognized)
-0.13 0.06 -2.31 0.02 -0.24 -0.02 -0.24 -0.02
Factor(variety
recognized)
-0.06 0.06 -1.16 0.25 -0.17 0.05 -0.17 0.05
Factor(Well
known region)
0.02 0.06 0.33 0.74 -0.10 0.14 -0.10 0.14
Factor(recommen
dation)
-0.22 0.06 -3.57 0.00 -0.34 -0.10 -0.34 -0.10
Factor(Expert
rating)
-0.03 0.06 -0.46 0.65 -0.15 0.09 -0.15 0.09
Factor(Price) 0.16 0.06 2.79 0.01 0.05 0.27 0.05 0.27
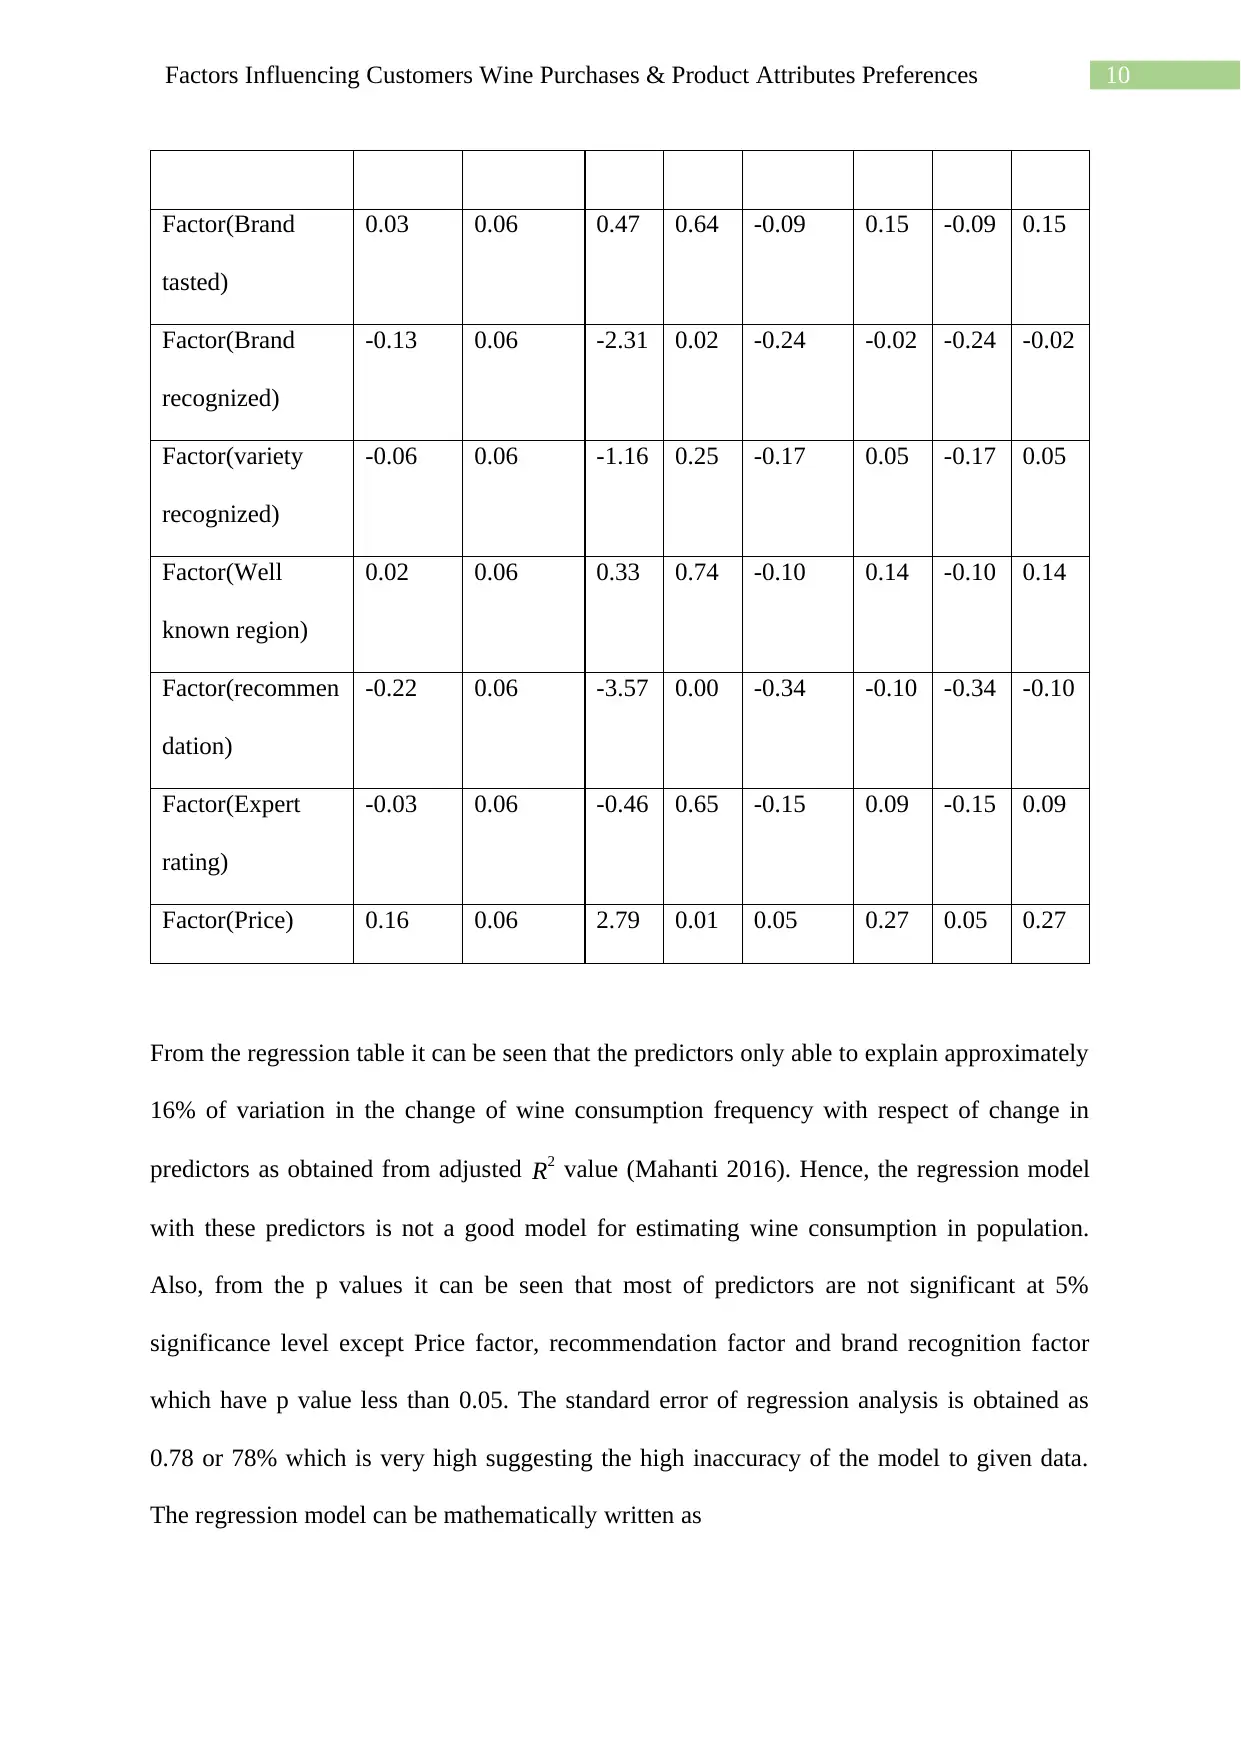
From the regression table it can be seen that the predictors only able to explain approximately
16% of variation in the change of wine consumption frequency with respect of change in
predictors as obtained from adjusted R2 value (Mahanti 2016). Hence, the regression model
with these predictors is not a good model for estimating wine consumption in population.
Also, from the p values it can be seen that most of predictors are not significant at 5%
significance level except Price factor, recommendation factor and brand recognition factor
which have p value less than 0.05. The standard error of regression analysis is obtained as
0.78 or 78% which is very high suggesting the high inaccuracy of the model to given data.
The regression model can be mathematically written as
Factor(Brand
tasted)
0.03 0.06 0.47 0.64 -0.09 0.15 -0.09 0.15
Factor(Brand
recognized)
-0.13 0.06 -2.31 0.02 -0.24 -0.02 -0.24 -0.02
Factor(variety
recognized)
-0.06 0.06 -1.16 0.25 -0.17 0.05 -0.17 0.05
Factor(Well
known region)
0.02 0.06 0.33 0.74 -0.10 0.14 -0.10 0.14
Factor(recommen
dation)
-0.22 0.06 -3.57 0.00 -0.34 -0.10 -0.34 -0.10
Factor(Expert
rating)
-0.03 0.06 -0.46 0.65 -0.15 0.09 -0.15 0.09
Factor(Price) 0.16 0.06 2.79 0.01 0.05 0.27 0.05 0.27
From the regression table it can be seen that the predictors only able to explain approximately
16% of variation in the change of wine consumption frequency with respect of change in
predictors as obtained from adjusted R2 value (Mahanti 2016). Hence, the regression model
with these predictors is not a good model for estimating wine consumption in population.
Also, from the p values it can be seen that most of predictors are not significant at 5%
significance level except Price factor, recommendation factor and brand recognition factor
which have p value less than 0.05. The standard error of regression analysis is obtained as
0.78 or 78% which is very high suggesting the high inaccuracy of the model to given data.
The regression model can be mathematically written as
11Factors Influencing Customers Wine Purchases & Product Attributes Preferences
Wine consumption frequency = 2.71 + 0.03* Factor(Brand tasted) -0.13* Factor(Brand
recognized) -0.06*Factor(variety recognized) + 0.02*Factor(Well known region) -
0.22*Factor(recommendation) -0.03*Factor(Expert rating) + 0.16* Factor(Price).
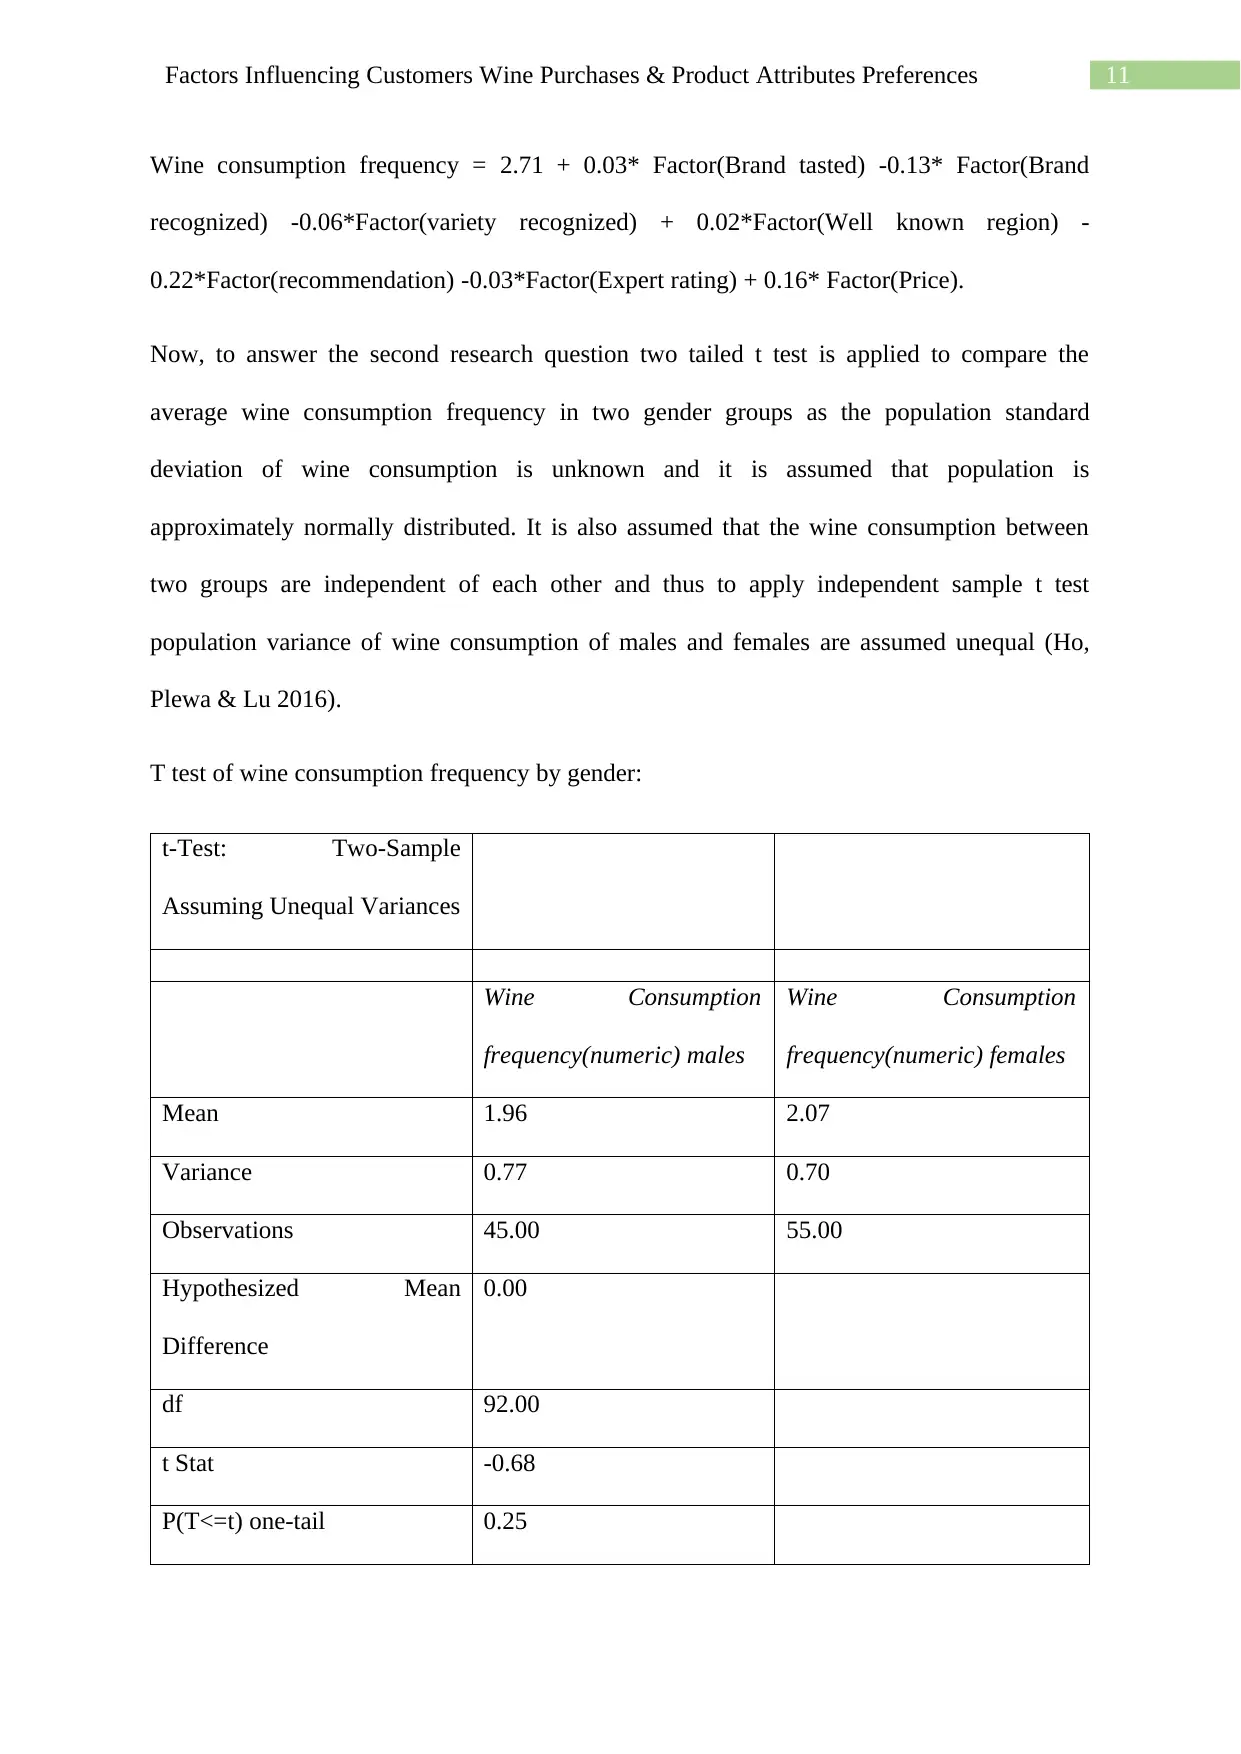
Now, to answer the second research question two tailed t test is applied to compare the
average wine consumption frequency in two gender groups as the population standard
deviation of wine consumption is unknown and it is assumed that population is
approximately normally distributed. It is also assumed that the wine consumption between
two groups are independent of each other and thus to apply independent sample t test
population variance of wine consumption of males and females are assumed unequal (Ho,
Plewa & Lu 2016).
T test of wine consumption frequency by gender:
t-Test: Two-Sample
Assuming Unequal Variances
Wine Consumption
frequency(numeric) males
Wine Consumption
frequency(numeric) females
Mean 1.96 2.07
Variance 0.77 0.70
Observations 45.00 55.00
Hypothesized Mean
Difference
0.00
df 92.00
t Stat -0.68
P(T<=t) one-tail 0.25
Wine consumption frequency = 2.71 + 0.03* Factor(Brand tasted) -0.13* Factor(Brand
recognized) -0.06*Factor(variety recognized) + 0.02*Factor(Well known region) -
0.22*Factor(recommendation) -0.03*Factor(Expert rating) + 0.16* Factor(Price).
Now, to answer the second research question two tailed t test is applied to compare the
average wine consumption frequency in two gender groups as the population standard
deviation of wine consumption is unknown and it is assumed that population is
approximately normally distributed. It is also assumed that the wine consumption between
two groups are independent of each other and thus to apply independent sample t test
population variance of wine consumption of males and females are assumed unequal (Ho,
Plewa & Lu 2016).
T test of wine consumption frequency by gender:
t-Test: Two-Sample
Assuming Unequal Variances
Wine Consumption
frequency(numeric) males
Wine Consumption
frequency(numeric) females
Mean 1.96 2.07
Variance 0.77 0.70
Observations 45.00 55.00
Hypothesized Mean
Difference
0.00
df 92.00
t Stat -0.68
P(T<=t) one-tail 0.25
⊘ This is a preview!⊘
Do you want full access?
Subscribe today to unlock all pages.
Trusted by 1+ million students worldwide
1 out of 16

Your All-in-One AI-Powered Toolkit for Academic Success.
+13062052269
info@desklib.com
Available 24*7 on WhatsApp / Email
![[object Object]](/_next/static/media/star-bottom.7253800d.svg)
Unlock your academic potential
Copyright © 2020–2026 A2Z Services. All Rights Reserved. Developed and managed by ZUCOL.