Falls in Older Adults: Statistical Trends & Impact Presentation

Verified

Added on  2023/06/03

|14
|733
|361
Presentation
AI Summary
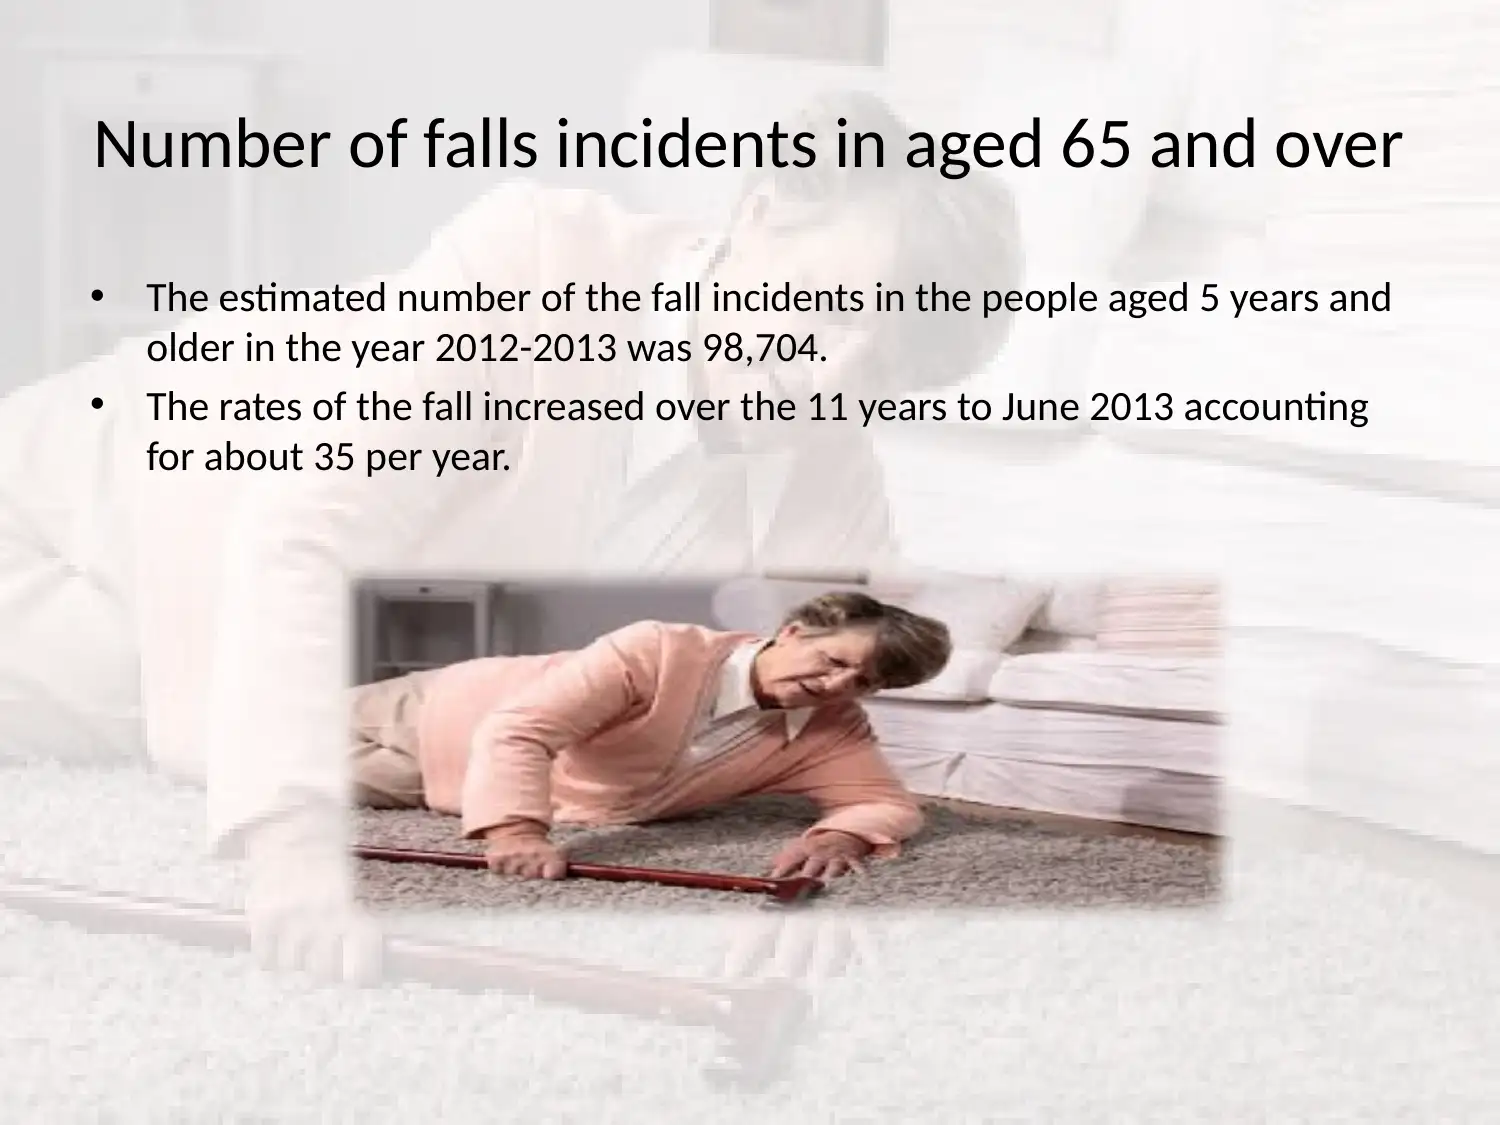
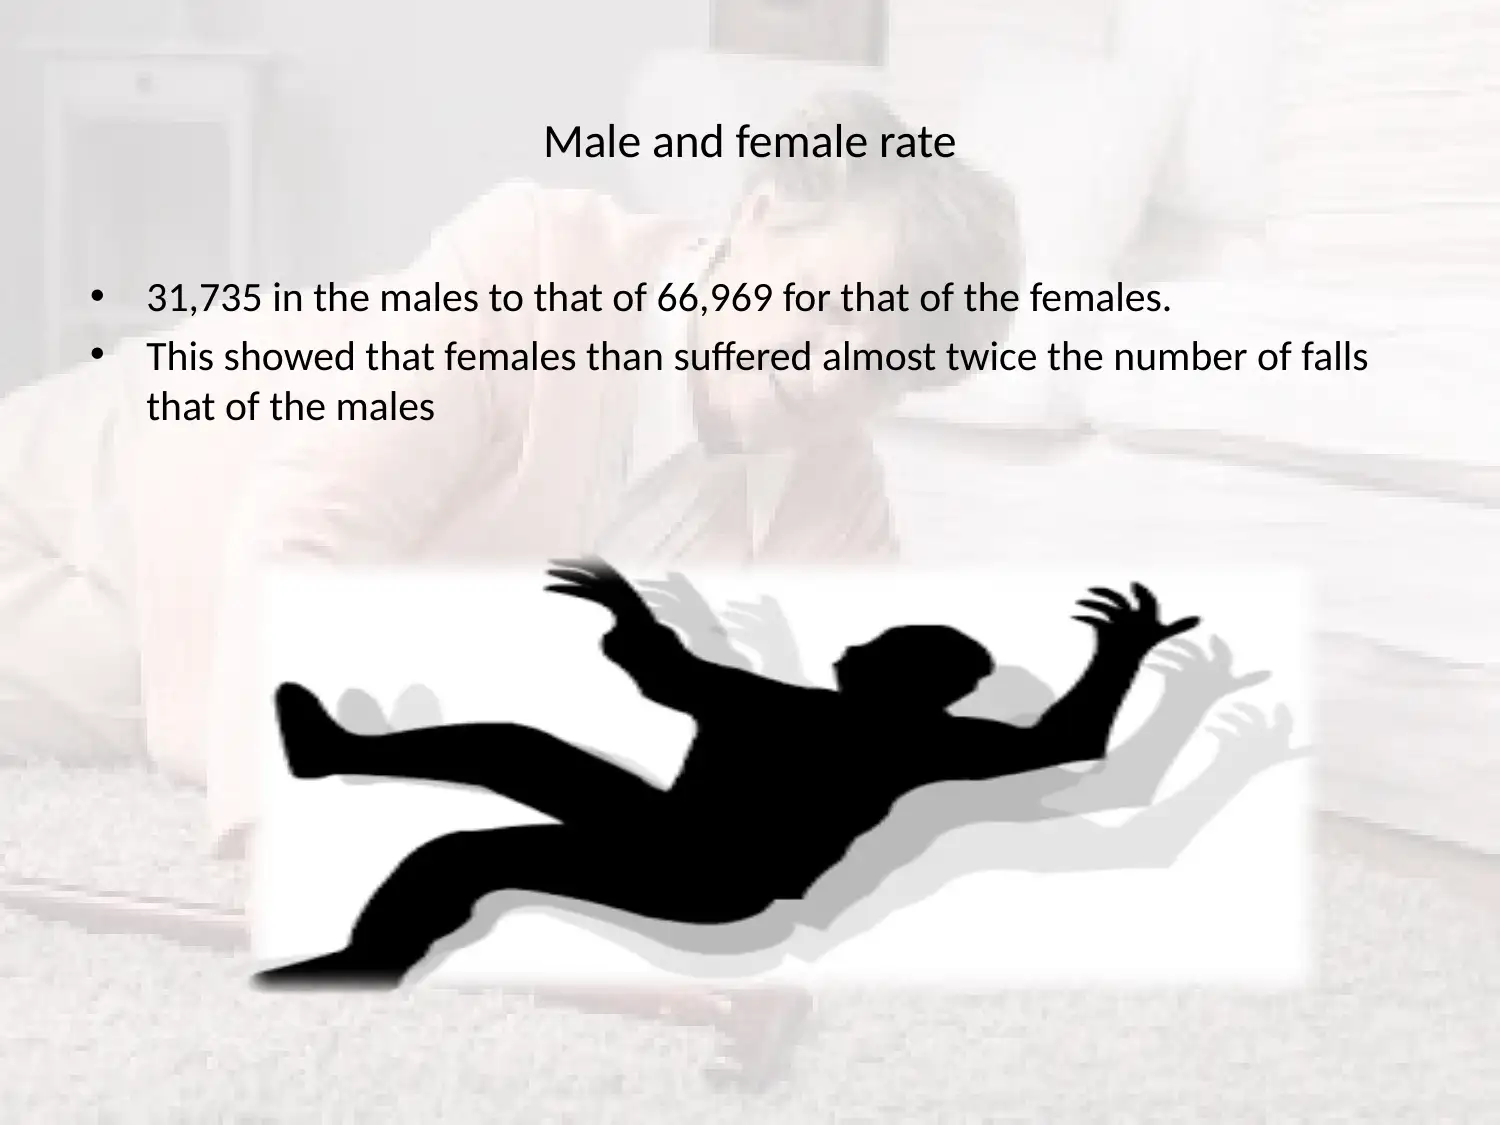
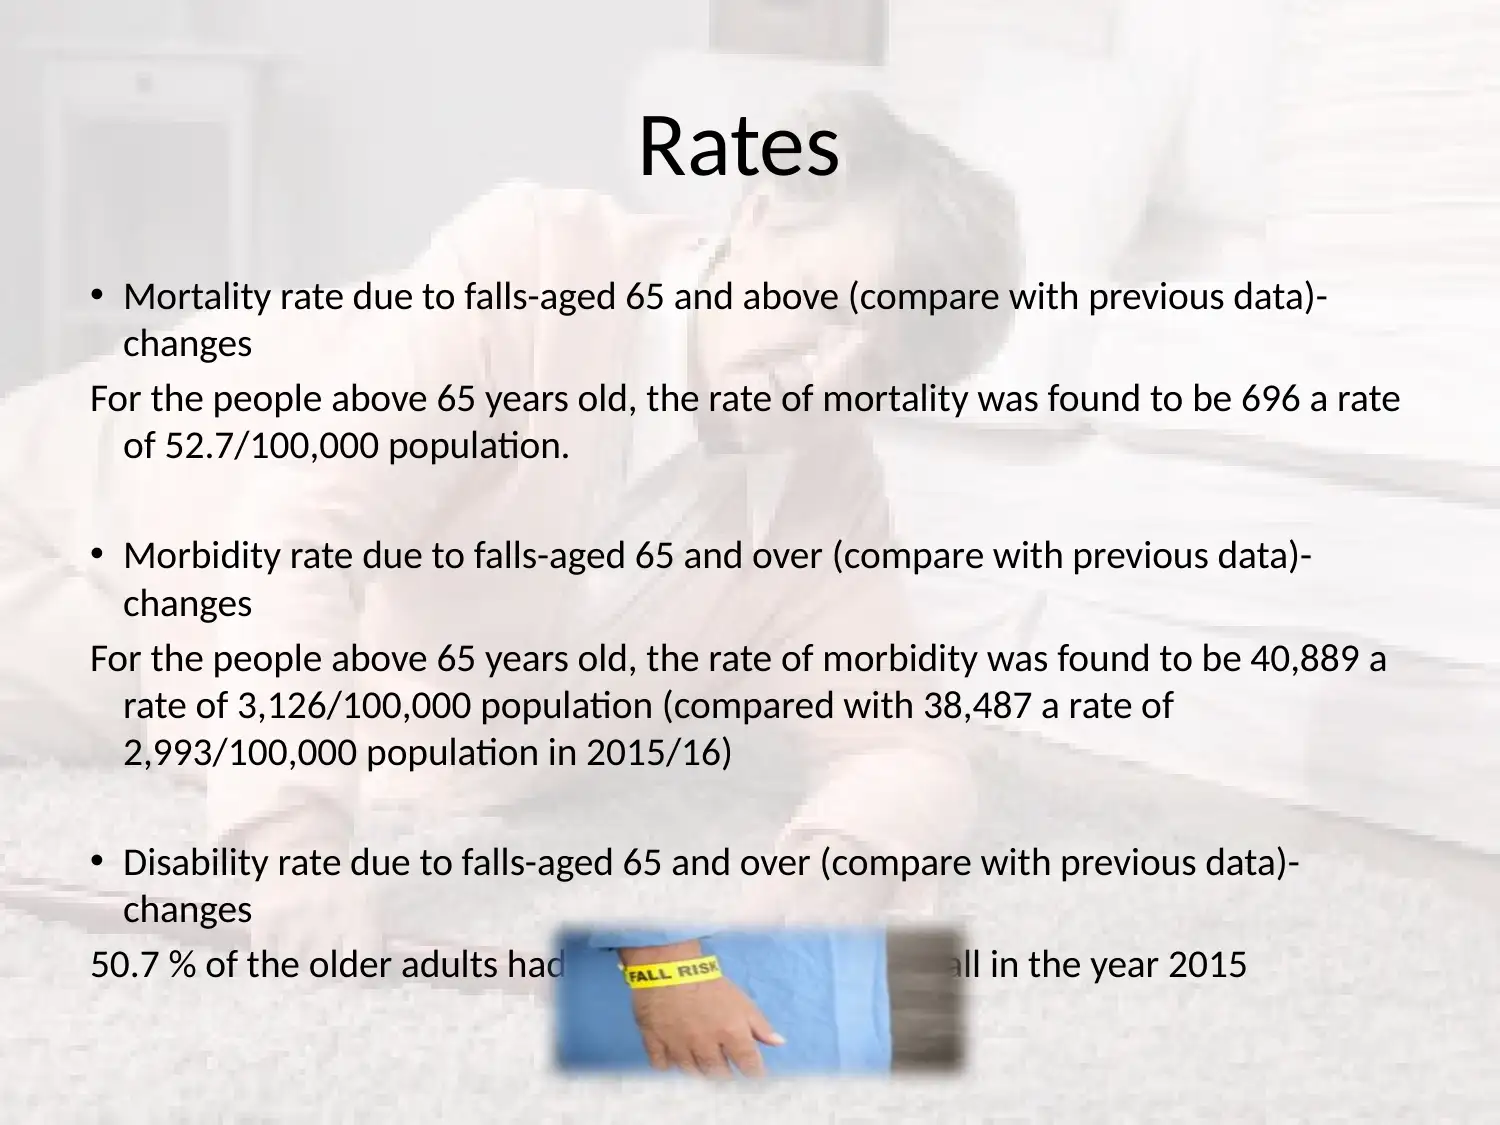
This presentation provides a statistical overview of falls in older adults (65 years and over), covering key metrics such as the number of fall incidents, male and female rates, mortality and morbidity rates, disability rates, hospitalizations, and fall-related injuries. It includes data on types of injuries like hip fractures and head injuries, the occurrence of falls in hospitals, associated hospitalization costs, and the impact on patients' health and hospital resources. The presentation also addresses the burden on family members and re-admission rates, referencing sources like the Australian Institute of Health and Welfare and the NSW Department of Health. Desklib provides this and other solved assignments for students.
Document Page
Statistics of Falls
tabler-icon-diamond-filled.svg

Paraphrase This Document

Need a fresh take? Get an instant paraphrase of this document with our AI Paraphraser
Document Page
Number of falls incidents in aged 65 and over
The estimated number of the fall incidents in the people aged 5 years and
older in the year 2012-2013 was 98,704.
The rates of the fall increased over the 11 years to June 2013 accounting
for about 35 per year.
Document Page
Male and female rate
31,735 in the males to that of 66,969 for that of the females.
This showed that females than suffered almost twice the number of falls
that of the males
Document Page
Rates
Mortality rate due to falls-aged 65 and above (compare with previous data)-
changes
For the people above 65 years old, the rate of mortality was found to be 696 a rate
of 52.7/100,000 population.
Morbidity rate due to falls-aged 65 and over (compare with previous data)-
changes
For the people above 65 years old, the rate of morbidity was found to be 40,889 a
rate of 3,126/100,000 population (compared with 38,487 a rate of
2,993/100,000 population in 2015/16)
Disability rate due to falls-aged 65 and over (compare with previous data)-
changes
50.7 % of the older adults had faced disability due to fall in the year 2015
tabler-icon-diamond-filled.svg

Paraphrase This Document

Need a fresh take? Get an instant paraphrase of this document with our AI Paraphraser
Document Page
Number of people hospitalised due to falls
aged 65 and ove
111222 people aged over the 65 years of age had been hospitalised due to
fall in the year 2014 to 2015
Document Page
Falls related injuries -aged 65 and over
About 92,150 fall injuries are involving people 65 years and older and have
been hospitalised in the year 2010 to 2011
Document Page
Types of injuries (for example hip-fracture, head injury)-changes
The main increase in the age-standardized rate of Head injury occurring
due to fall over the 13 years to June 2013 was estimated to be 6.8% per
year for women and the rate of the men is seen to be increased by 6.8%.
tabler-icon-diamond-filled.svg

Paraphrase This Document

Need a fresh take? Get an instant paraphrase of this document with our AI Paraphraser
Document Page
Types of injuries (for example hip-fracture,
head injury)-changes
Open wound was found to be present for about 6258 men and 7689
women who had suffered falls in the year 2014-2015.
Fracture as present in 16550 males and 44079 females.
Dislocation injury is present in 625 males and 1111 females who have
suffered a fall in the year 2014-2015.
Document Page
Falls in the hospital
In the year 2015-2016, about 34000 falls had resulted from the patient
harm in the hospitals. It took place at a rate of 3.2 falls per 1000
separations
Document Page
Hospitalised cost, average cost
The total cost of the healthcare associated with that of the fall injuries in
the older people in NSW was about $558.5 million in the year 2006-
2007.studies have shown that hospital admitted cases accounted for
about 84.5 per cent of the total costs
tabler-icon-diamond-filled.svg

Paraphrase This Document

Need a fresh take? Get an instant paraphrase of this document with our AI Paraphraser
Document Page
Impact on patients’ health and hospital
resources
These are seen to include pain, bruising, haematomas, scratches and
other superficial wounds, lacerations, intracranial bleeding and
lacerations.
The number of patient days also becomes quite higher along with increase
total cost of hospitalisation along with expenditure of resources
Document Page
The burden to family members
Financial pressures in the family
Emotional stress
Loss of quality of lives
Depression and others
chevron_up_icon
1 out of 14
circle_padding
hide_on_mobile
zoom_out_icon
[object Object]