University Finance Report: Fama-French Model and Portfolio Analysis
VerifiedAdded on 2021/04/21
|12
|2433
|100
Report
AI Summary
This finance report delves into the Fama-French model, exploring its factors and implications for stock returns. It contrasts value and growth stocks, highlighting the model's application in understanding market risk and return. The report analyzes the CAPM model and the Fama-French model, providing insights into their implications. Furthermore, it examines an academic paper on the Fama-French model, discussing its objectives and the rationale behind its use. The report also includes a practical section, calculating the expected return, standard deviation, and optimal risky portfolio, alongside the standard deviation of the portfolio with targeted returns, and detecting the contribution of T-bill funds and risky funds. The analysis uses statistical calculations to determine the viability of the factors used in the Fama-French model and Max Squared Sharpe ratio for deriving the relevant returns from stocks.
Running head: FINANCE
Finance
Name of the Student:
Name of the University:
Authors Note:
Finance
Name of the Student:
Name of the University:
Authors Note:
Paraphrase This Document
Need a fresh take? Get an instant paraphrase of this document with our AI Paraphraser

FINANCE
1
Table of Contents
PART A:.....................................................................................................................................2
1. Defining the findings that was derived by researcher in the article:......................................2
2. The factors depicting by Fama-French in the article, which explains stock returns:.............2
3. Indicating the measures of risk that Fama-French concluded to explain stock returns:........2
4. Mentioning the implications of Fama-French model and CAPM Model:.............................3
5. Explaining with the summary of academic paper providing objective of the academic paper
and the reason Fame-French model is used in the paper:..........................................................3
PART B:.....................................................................................................................................5
a) Expected return and standard return of Minimum Portfolio Variance:.................................5
b) Calculating the optimal risky portfolio’s mean and standard deviation:...............................7
c.i) Standard Deviation of the portfolio with targeted returns:..................................................9
c.ii) Detecting the contribution of T-bill fund and to risky funds:.............................................9
Reference and Bibliography:....................................................................................................11
FINANCE
2
PART A:
1. Defining the findings that was derived by researcher in the article:
The article mainly states the difference between value stock and growth stock by
stating the return, which is provided by both the stocks. The researcher pointed out the
limitations of growth stock and the hindrance it possesses to investors for generate high
retune from investment. The comparison between the return and risk of value and growth
stock is conducted to determine the actual significance of value stocks. Eugene Fama and
Kenneth French proposed that value stock due to the reduces prices and high asset valuation
is the best buying option for investors, as share price value of growth stocks is always high
due to the demand among investors (Koijen, Lustig and Van 2017).
2. The factors depicting by Fama-French in the article, which explains stock returns:
Fama-French in the article mainly explained the return of stock return, which might
allow investors to improve the return from investment. In addition, the Fama-French indicates
that there are two factors namely market risk factors and value growth risk factor, which
could explain the return, which is provided from investment. This detection of risk factors
might help in generating high level of return, which could generate return from investment.
Some researchers stated that with the evaluation of risk and return attribute of stock, investors
can generate high level of return from investment by controlling risk attributes of their
portfolio (Tsuji 2016).
3. Indicating the measures of risk that Fama-French concluded to explain stock returns:
Fama-French focuses on precise risk measure, where they added that market risk
factors and value growth risk factor are the major risk, which needs to be evaluated before
⊘ This is a preview!⊘
Do you want full access?
Subscribe today to unlock all pages.
Trusted by 1+ million students worldwide
FINANCE
3
investing. In addition, the use of market risk factors might help investors in detecting the
implications of capital market on return generation capacity of the stocks. This could
eventually allow investors to avoid stock with high beta, which could hamper their actual
return from investment. The value growth risk factors allow investor to detect stocks with
high valuation, which could increase return from investment and raise the investment capital
(Sornette 2017).
4. Mentioning the implications of Fama-French model and CAPM Model:
The researcher in the relevant academic paper indicates the implications of both
CAPM model and Fame-French model, which could allow investors to detect risk and return
attributes of the stocks. The first implication for the investors regarding CAPM is its
simplicity and to view the risk involved in investment. Moreover, it is stated that there are
more additional dimensions of risk, which could generate high level of returns from
investment. On the other hand, the second implication is that value stock has higher return in
comparison with growth stocks, which is detected from evaluating markets around the world.
The implication of Fame-French model mainly states that stocks with high value can generate
more return in comparisons to stock with growth attributes, as they are undervalued (Shen
and Tzeng 2015).
5. Explaining with the summary of academic paper providing objective of the academic
paper and the reason Fame-French model is used in the paper:
The evaluation of academic paper “Choosing Factors” by Eugene F. Fama and
Kenneth R. French, mainly indicates the issues that has been arising in five factor Fame-
French model (Fama and French 2016). The researcher in the academic paper mainly depicts
the issues of the investment model, which might hamper risk and return attribute of the
investor. The three issues that are identified from the academic paper are depicted as follows.
Paraphrase This Document
Need a fresh take? Get an instant paraphrase of this document with our AI Paraphraser
FINANCE
4
Cash profitability (CP) versus operating profitability (OP) as the variable used to
construct profitability factors.
Long – short spread factors versus excess returns on the long or short ends of the
spread factors.
Factors that use the small or big ends of value, profitability, and investment factors
versus averages of small and big components.
The overall objective of the academic paper is to detect viability of the identified issues,
which might reduce viability of the five-factor Fama and French model. This might hamper
financial capability of the investors to generate adequate return from investment. The
researcher mainly uses statistical calculations in deriving the viability of factors used in the
Fama and French model for detecting stocks with high returns and low risk. The researcher
has used max squared Sharpe ratio for model factors for deriving the best possible factor to
support the five-factor Fama and French model (Fama and French 2016).
The researcher used Max Squared Sharpe ratio in to marginal contributions for deriving
the relevant returns, which could be generated from stocks. In addition, the market used for
the evaluation was NYSE, AMEX, and NASDAQ stock. Moreover, the paper explores issues
and the choice of profitability factors affects each model max squared Sharpe ratio.
Furthermore, analysis of the research indicates that by using max squared Sharpe ratio, the
financial viability of the five-factor Fama and French model can be identified. The researcher
also indicates that ranking based on max squared Sharpe ratio is accurate, which might
improve financial capability of the investor. Therefore, the research indicates that common
performance matrix could eventually allow investor to detect viability of the factors used in
Fama-French for identifying value stocks with high returns (Fama and French 2016).
FINANCE
5
The researcher after completing the research indicates that the ultimate winner is the
spread factor model of Fama-French, which allows investor to detect accurate stock for
investment. In addition, the researcher indicates that operating profitability factor replaces
cash profitability, as it might help increase efficiency of the Five factor model of Fama-
French. Therefore, from all the three issues mentioned in the academic paper only cash
profitability versus operating profitability is detected to be viable, which might be changed in
the Five factor model of Fama-French for improving the overall investment model for
investors. This detection is only possi9ble with the help of max squared Sharpe ratio used by
the researcher in the article. This eventually help in understanding the debt of risk and return
attributes of the Five factor model of Fama-French.
PART B:
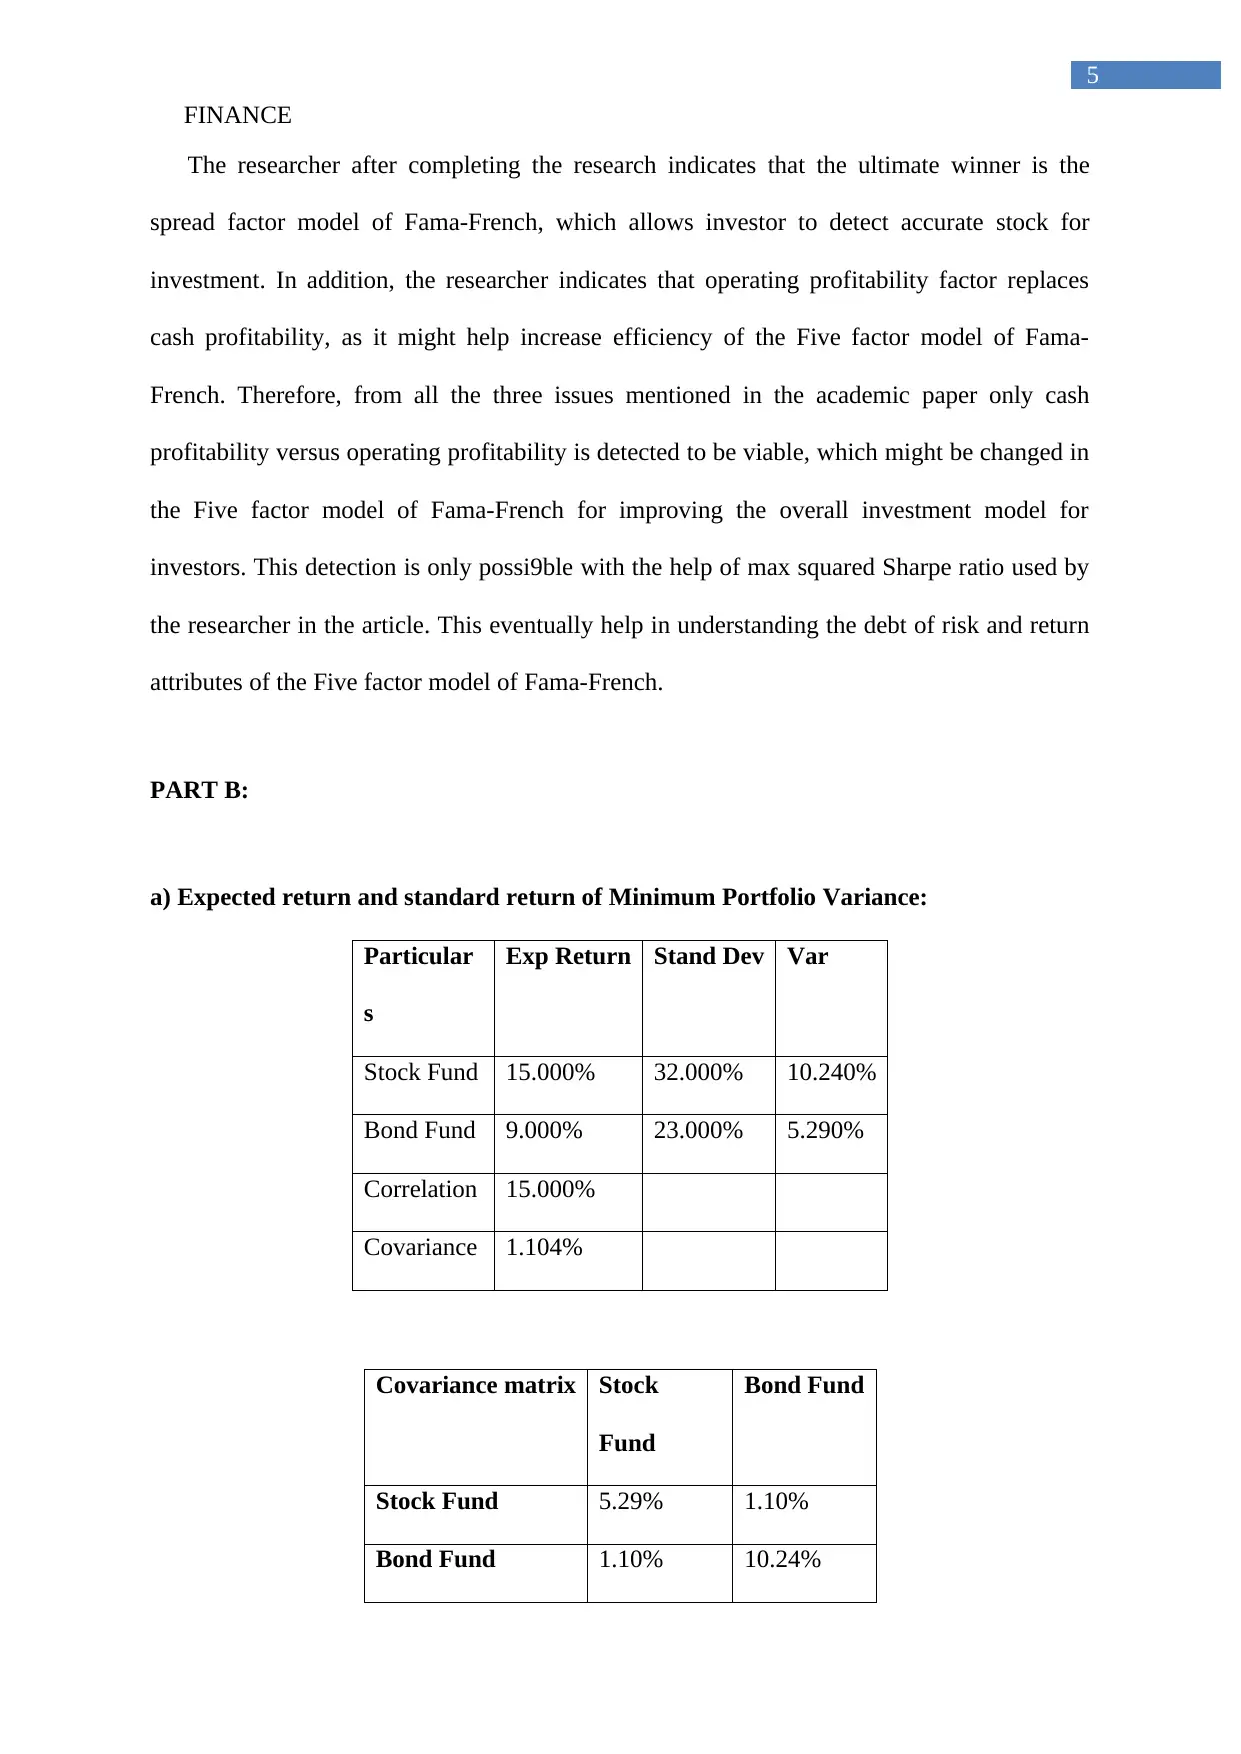
a) Expected return and standard return of Minimum Portfolio Variance:
Particular
s
Exp Return Stand Dev Var
Stock Fund 15.000% 32.000% 10.240%
Bond Fund 9.000% 23.000% 5.290%
Correlation 15.000%
Covariance 1.104%
Covariance matrix Stock
Fund
Bond Fund
Stock Fund 5.29% 1.10%
Bond Fund 1.10% 10.24%
5
The researcher after completing the research indicates that the ultimate winner is the
spread factor model of Fama-French, which allows investor to detect accurate stock for
investment. In addition, the researcher indicates that operating profitability factor replaces
cash profitability, as it might help increase efficiency of the Five factor model of Fama-
French. Therefore, from all the three issues mentioned in the academic paper only cash
profitability versus operating profitability is detected to be viable, which might be changed in
the Five factor model of Fama-French for improving the overall investment model for
investors. This detection is only possi9ble with the help of max squared Sharpe ratio used by
the researcher in the article. This eventually help in understanding the debt of risk and return
attributes of the Five factor model of Fama-French.
PART B:
a) Expected return and standard return of Minimum Portfolio Variance:
Particular
s
Exp Return Stand Dev Var
Stock Fund 15.000% 32.000% 10.240%
Bond Fund 9.000% 23.000% 5.290%
Correlation 15.000%
Covariance 1.104%
Covariance matrix Stock
Fund
Bond Fund
Stock Fund 5.29% 1.10%
Bond Fund 1.10% 10.24%
⊘ This is a preview!⊘
Do you want full access?
Subscribe today to unlock all pages.
Trusted by 1+ million students worldwide
FINANCE
6
Particulars Value
Weight (Bond) (10.24% - 1.10%) / ((10.24% + 5.29% - (2 *
1.10%)))
Weight (Bond) 68.58%
Weight (Stock) 1 – 68.58%
Weight (Stock) 31.42%
Standard deviation SQRT(((31.42%^2) * 15%) + ((68.58%^2)
* 9%) + (2 * 31.42% * 68.58% * 1.10%))
Standard deviation 19.94%
Mean (31.42% * 15%) + (68.58% * 9%)
Mean 10.89%
0.1000 0.1500 0.2000 0.2500 0.3000 0.3500
0.0800
0.0900
0.1000
0.1100
0.1200
0.1300
0.1400
0.1500
0.1600
Minimum Variance
Portfolio; 0.1089
Minimum Variance portfolio
The above graph mainly helps in detecting the overall minimum variance portfolio
graph, which detects the returns and risk involved in investment.
Paraphrase This Document
Need a fresh take? Get an instant paraphrase of this document with our AI Paraphraser
FINANCE
7
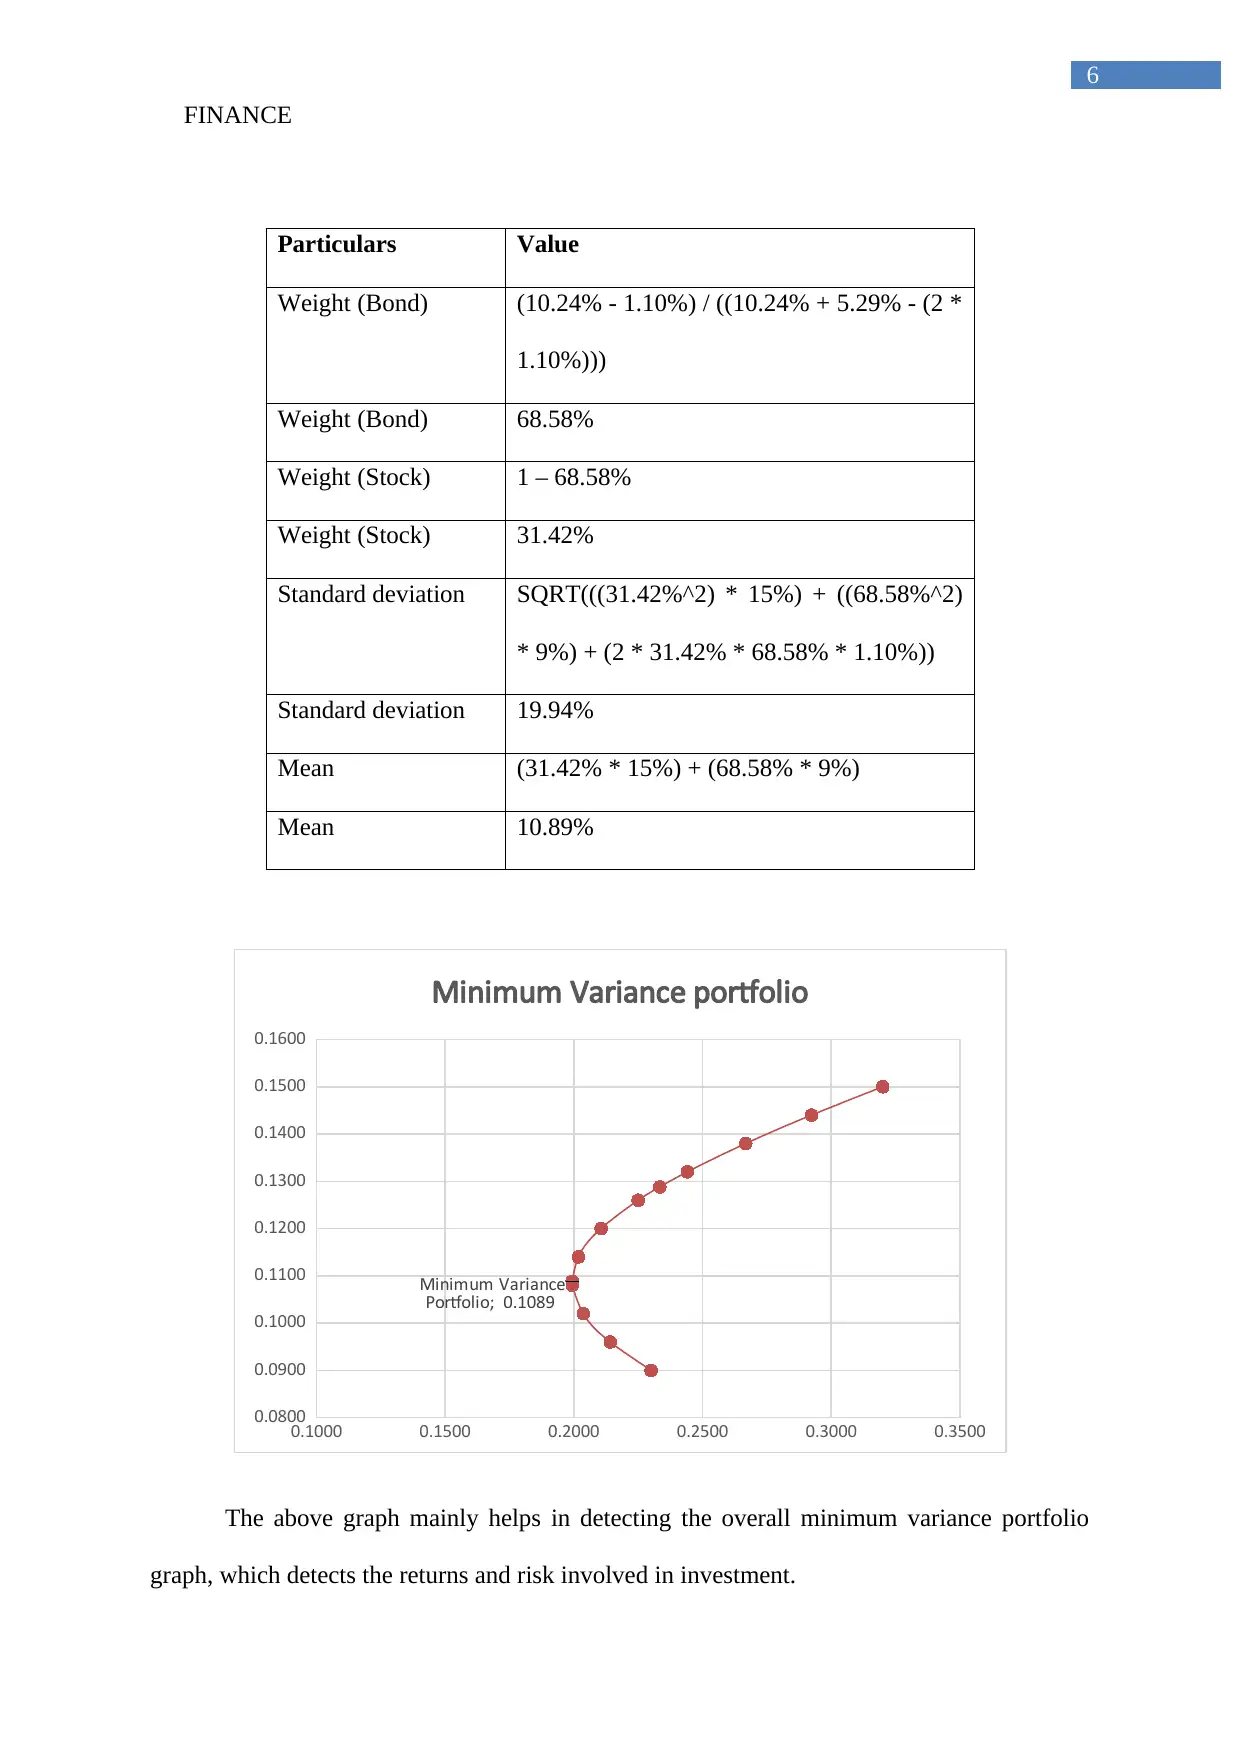
Stock Fund Bond Fund Stand Dev Exp Return Sharpe ratio
0% 100% 0.2300 0.0900 0.1522
10% 90% 0.2141 0.0960 0.1915
20% 80% 0.2037 0.1020 0.2308
30% 70% 0.1994 0.1080 0.2658
31% 69% 0.1994 0.1089 0.2701
40% 60% 0.2018 0.1140 0.2924
50% 50% 0.2106 0.1200 0.3087
60% 40% 0.2250 0.1260 0.3155
65% 35% 0.2334 0.1288 0.3162
70% 30% 0.2441 0.1320 0.3155
80% 20% 0.2668 0.1380 0.3111
90% 10% 0.2923 0.1440 0.3044
100% 0% 0.3200 0.1500 0.2969
b) Calculating the optimal risky portfolio’s mean and standard deviation:
Optimal risky portfolio Value
Stock -Risk free rate 15% - 5.5%
Stock -Risk free rate 9.500%
Bond -Risk free rate 9% - 5.5%
Bond -Risk free rate 3.500%
Optimal risky portfolio Value
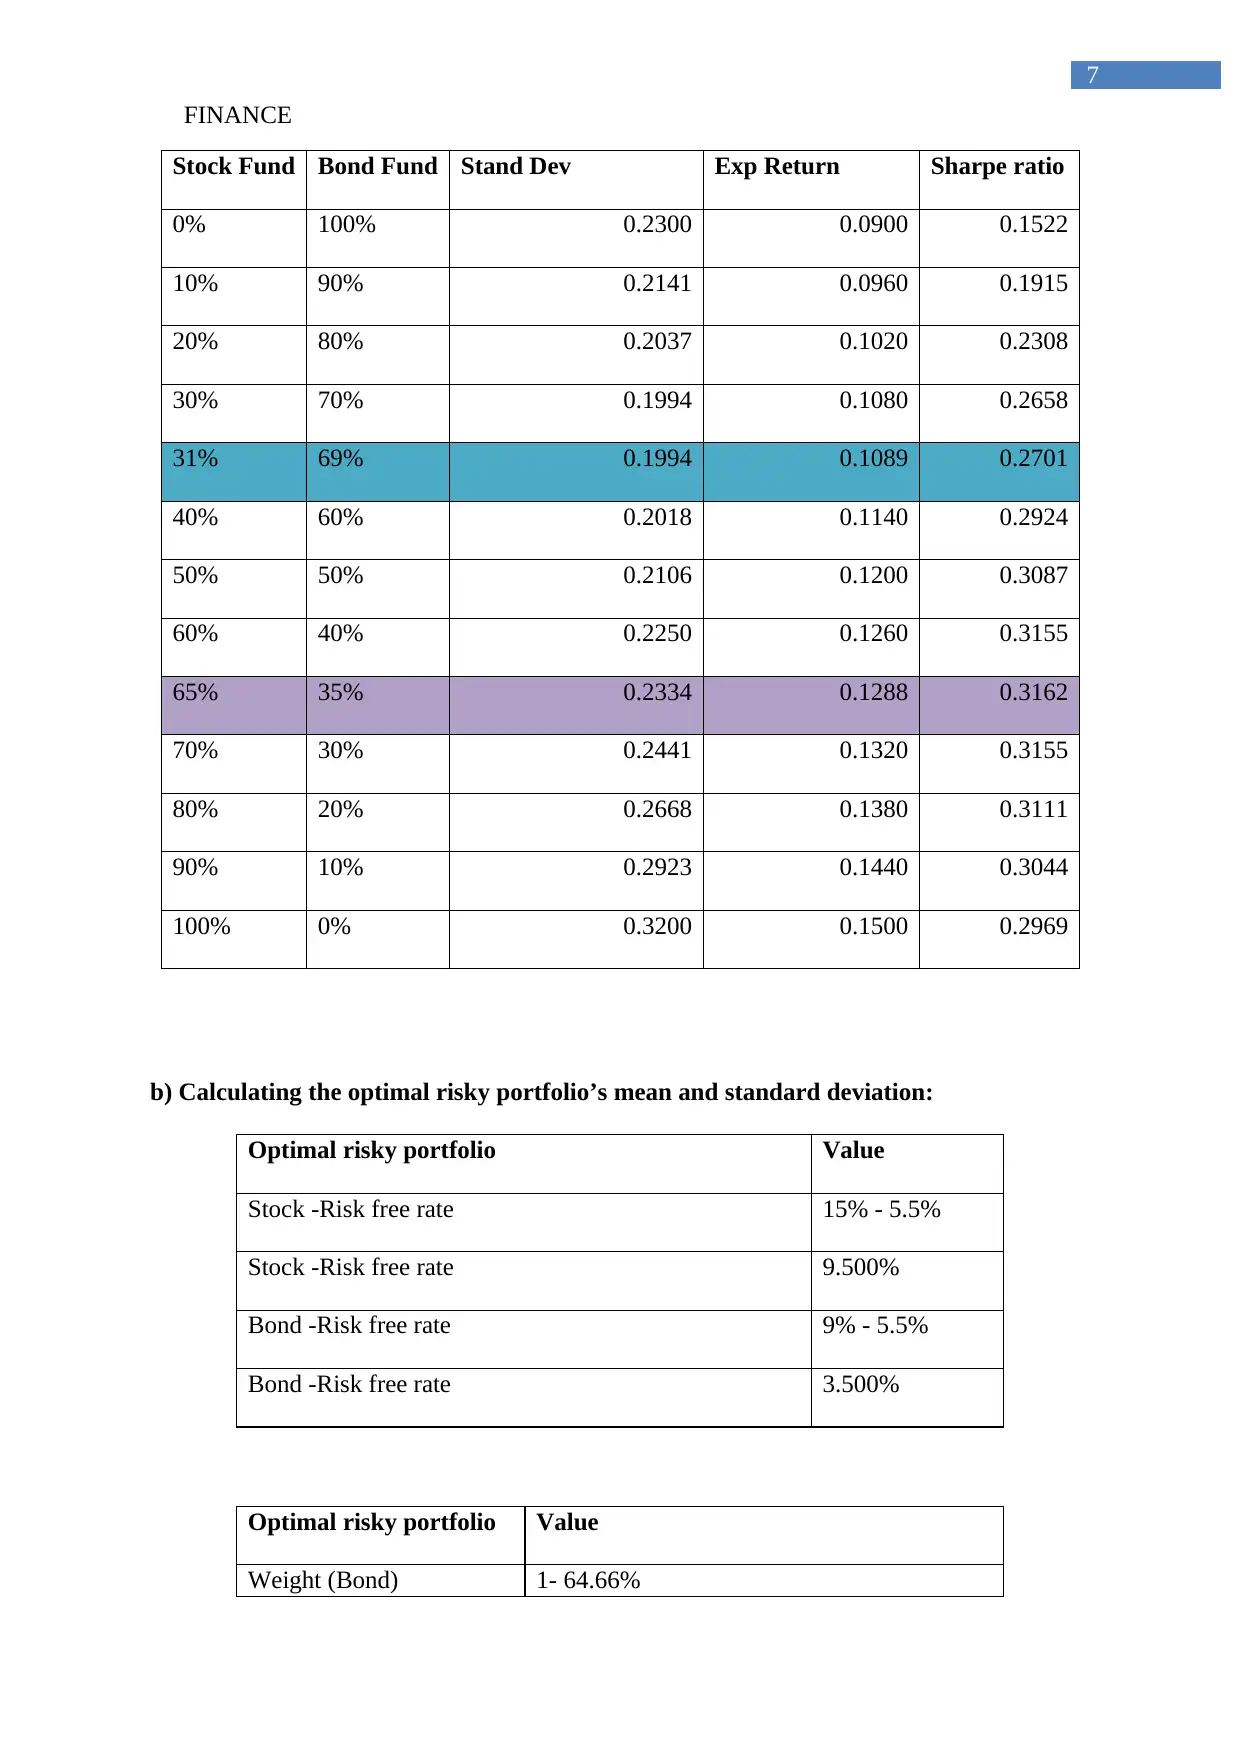
Weight (Bond) 1- 64.66%
7
Stock Fund Bond Fund Stand Dev Exp Return Sharpe ratio
0% 100% 0.2300 0.0900 0.1522
10% 90% 0.2141 0.0960 0.1915
20% 80% 0.2037 0.1020 0.2308
30% 70% 0.1994 0.1080 0.2658
31% 69% 0.1994 0.1089 0.2701
40% 60% 0.2018 0.1140 0.2924
50% 50% 0.2106 0.1200 0.3087
60% 40% 0.2250 0.1260 0.3155
65% 35% 0.2334 0.1288 0.3162
70% 30% 0.2441 0.1320 0.3155
80% 20% 0.2668 0.1380 0.3111
90% 10% 0.2923 0.1440 0.3044
100% 0% 0.3200 0.1500 0.2969
b) Calculating the optimal risky portfolio’s mean and standard deviation:
Optimal risky portfolio Value
Stock -Risk free rate 15% - 5.5%
Stock -Risk free rate 9.500%
Bond -Risk free rate 9% - 5.5%
Bond -Risk free rate 3.500%
Optimal risky portfolio Value
Weight (Bond) 1- 64.66%
FINANCE
8
Weight (Bond) 35.34%
Weight (Stock) ((9.5% * 5.29%) - (3.5% * 1.10%)) / ((9.5%
* 5.29%) + (3.5% * 10.24%) - ((9.5% +
3.5%) * 1.10%))
Weight (Stock) 64.66%
Standard deviation SQRT(((64.66%^2) * 15%) + ((35.34%^2) *
9%) + (2 * 64.66% * 35.34% * 1.10%))
Standard deviation 23.34%
Mean (64.66% * 15%) + (35.34% * 9%)
Mean 12.88%
0.1000 0.1500 0.2000 0.2500 0.3000 0.3500
0.0800
0.0900
0.1000
0.1100
0.1200
0.1300
0.1400
0.1500
0.1600
Optimal risky
portfolio; 0.1288
Optimal risky portfolio
The graph represents the overall optimal risky portfolio, which could provide high
returns with controlled risk.
⊘ This is a preview!⊘
Do you want full access?
Subscribe today to unlock all pages.
Trusted by 1+ million students worldwide
FINANCE
9
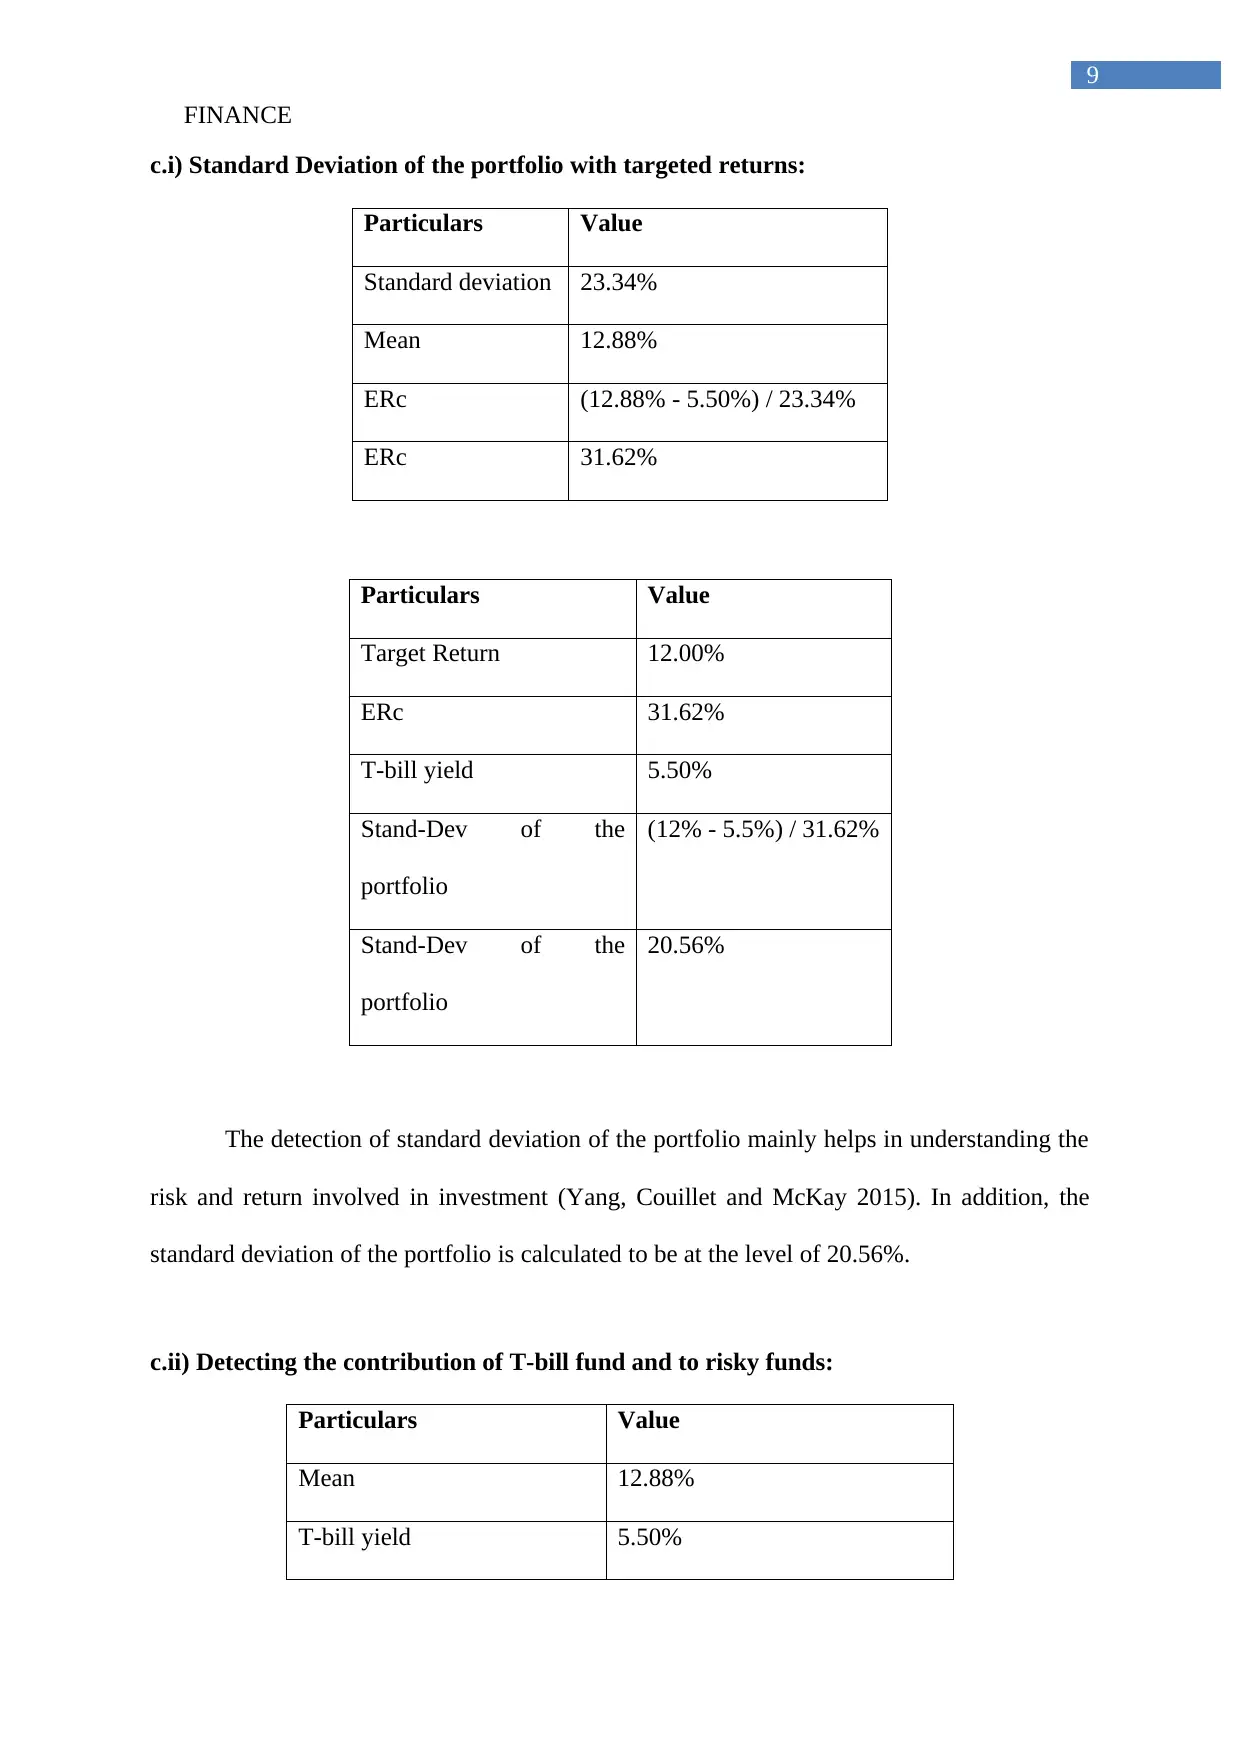
c.i) Standard Deviation of the portfolio with targeted returns:
Particulars Value
Standard deviation 23.34%
Mean 12.88%
ERc (12.88% - 5.50%) / 23.34%
ERc 31.62%
Particulars Value
Target Return 12.00%
ERc 31.62%
T-bill yield 5.50%
Stand-Dev of the
portfolio
(12% - 5.5%) / 31.62%
Stand-Dev of the
portfolio
20.56%
The detection of standard deviation of the portfolio mainly helps in understanding the
risk and return involved in investment (Yang, Couillet and McKay 2015). In addition, the
standard deviation of the portfolio is calculated to be at the level of 20.56%.
c.ii) Detecting the contribution of T-bill fund and to risky funds:
Particulars Value
Mean 12.88%
T-bill yield 5.50%
9
c.i) Standard Deviation of the portfolio with targeted returns:
Particulars Value
Standard deviation 23.34%
Mean 12.88%
ERc (12.88% - 5.50%) / 23.34%
ERc 31.62%
Particulars Value
Target Return 12.00%
ERc 31.62%
T-bill yield 5.50%
Stand-Dev of the
portfolio
(12% - 5.5%) / 31.62%
Stand-Dev of the
portfolio
20.56%
The detection of standard deviation of the portfolio mainly helps in understanding the
risk and return involved in investment (Yang, Couillet and McKay 2015). In addition, the
standard deviation of the portfolio is calculated to be at the level of 20.56%.
c.ii) Detecting the contribution of T-bill fund and to risky funds:
Particulars Value
Mean 12.88%
T-bill yield 5.50%
Paraphrase This Document
Need a fresh take? Get an instant paraphrase of this document with our AI Paraphraser
FINANCE
10
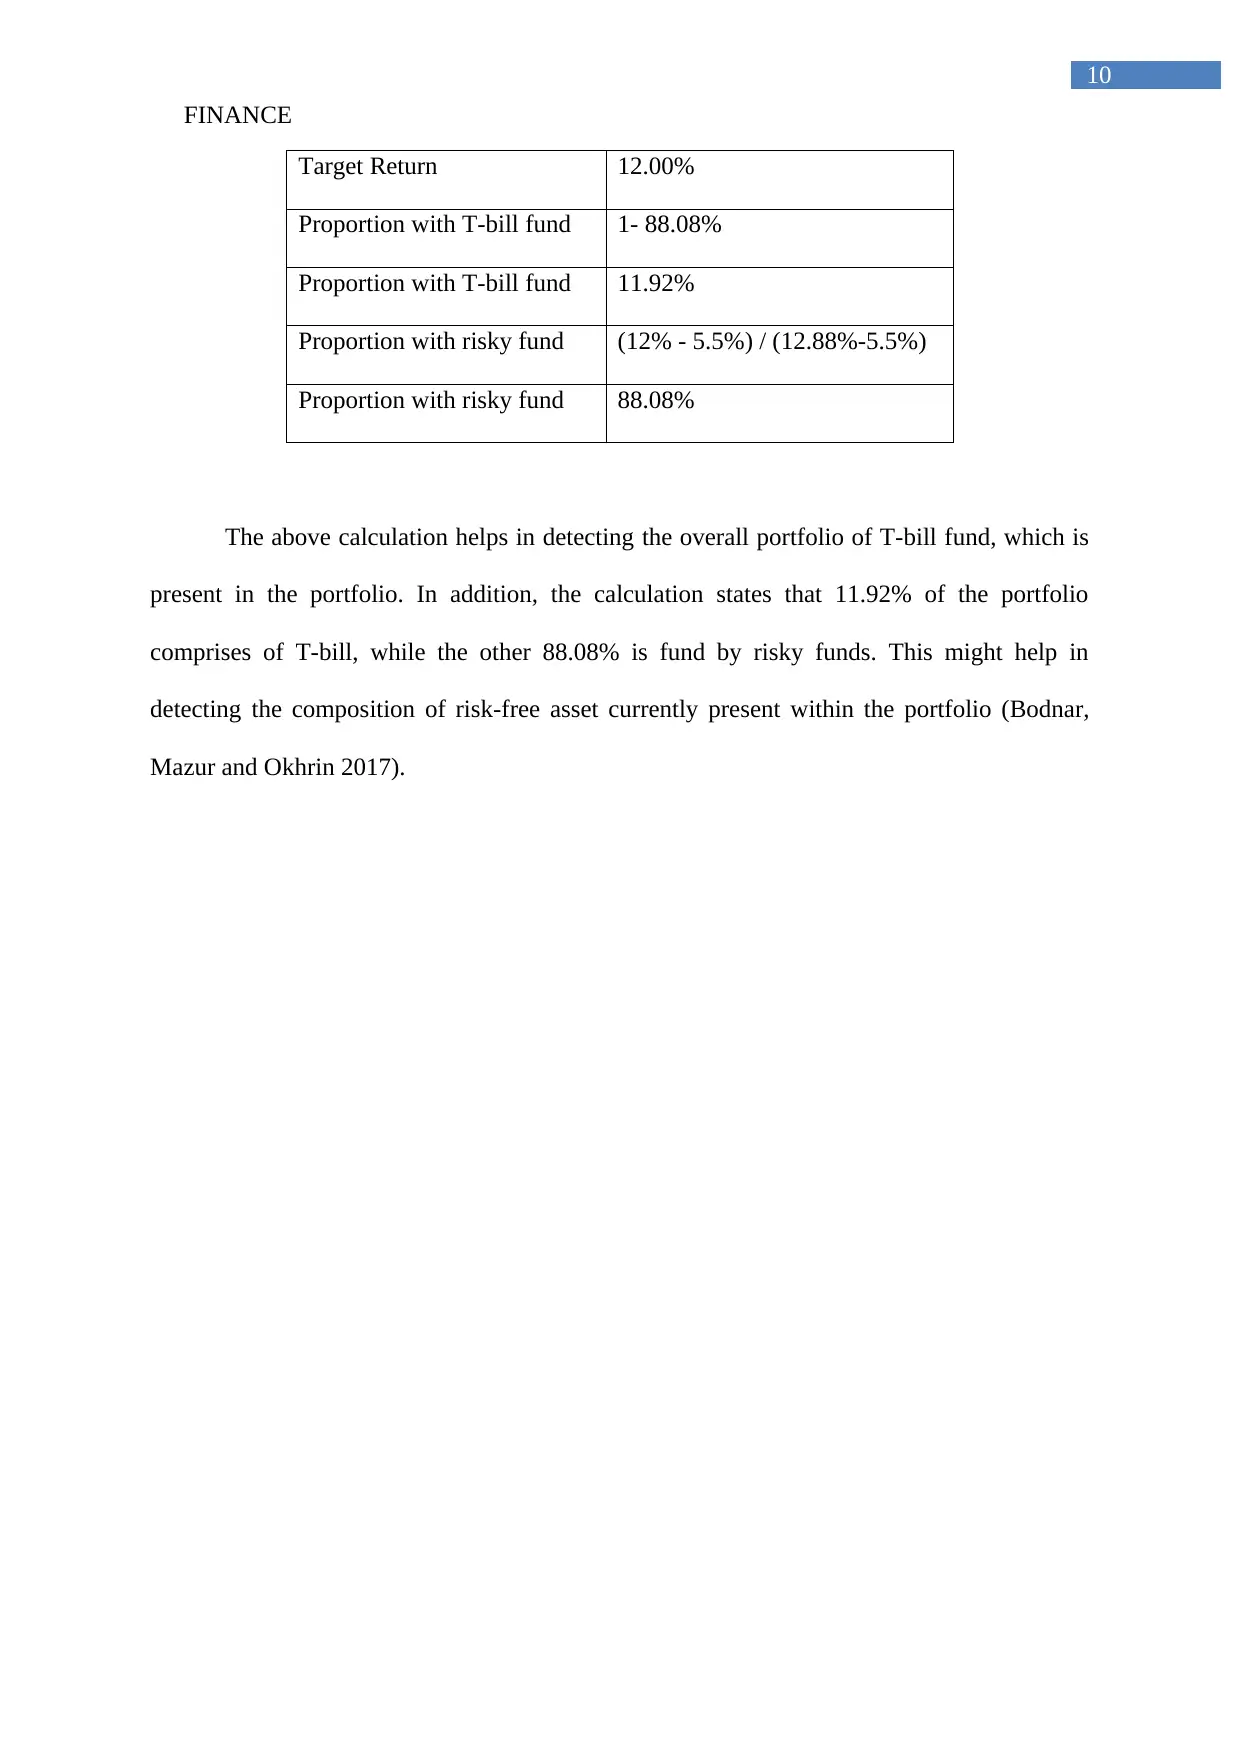
Target Return 12.00%
Proportion with T-bill fund 1- 88.08%
Proportion with T-bill fund 11.92%
Proportion with risky fund (12% - 5.5%) / (12.88%-5.5%)
Proportion with risky fund 88.08%
The above calculation helps in detecting the overall portfolio of T-bill fund, which is
present in the portfolio. In addition, the calculation states that 11.92% of the portfolio
comprises of T-bill, while the other 88.08% is fund by risky funds. This might help in
detecting the composition of risk-free asset currently present within the portfolio (Bodnar,
Mazur and Okhrin 2017).
10
Target Return 12.00%
Proportion with T-bill fund 1- 88.08%
Proportion with T-bill fund 11.92%
Proportion with risky fund (12% - 5.5%) / (12.88%-5.5%)
Proportion with risky fund 88.08%
The above calculation helps in detecting the overall portfolio of T-bill fund, which is
present in the portfolio. In addition, the calculation states that 11.92% of the portfolio
comprises of T-bill, while the other 88.08% is fund by risky funds. This might help in
detecting the composition of risk-free asset currently present within the portfolio (Bodnar,
Mazur and Okhrin 2017).
FINANCE
11
Reference and Bibliography:
Adam, K., Marcet, A. and Nicolini, J.P., 2016. Stock market volatility and learning. The
Journal of Finance, 71(1), pp.33-82.
Björk, T., Murgoci, A. and Zhou, X.Y., 2014. Mean–variance portfolio optimization with
state‐dependent risk aversion. Mathematical Finance, 24(1), pp.1-24.
Bodnar, T. and Gupta, A.K., 2015. Robustness of the inference procedures for the global
minimum variance portfolio weights in a skew-normal model. The European Journal of
Finance, 21(13-14), pp.1176-1194.
Bodnar, T., Mazur, S. and Okhrin, Y., 2017. Bayesian estimation of the global minimum
variance portfolio. European Journal of Operational Research, 256(1), pp.292-307.
Bodnar, T., Parolya, N. and Schmid, W., 2018. Estimation of the global minimum variance
portfolio in high dimensions. European Journal of Operational Research, 266(1), pp.371-
390.
Fama, E. F., and French, K. R. 2016. Choosing factors.
Koijen, R.S., Lustig, H. and Van Nieuwerburgh, S., 2017. The cross-section and time series
of stock and bond returns. Journal of Monetary Economics, 88, pp.50-69.
Shen, K.Y. and Tzeng, G.H., 2015. Combined soft computing model for value stock selection
based on fundamental analysis. Applied Soft Computing, 37, pp.142-155.
Sornette, D., 2017. Why stock markets crash: critical events in complex financial systems.
Princeton University Press.
⊘ This is a preview!⊘
Do you want full access?
Subscribe today to unlock all pages.
Trusted by 1+ million students worldwide
1 out of 12
Related Documents


Your All-in-One AI-Powered Toolkit for Academic Success.
+13062052269
info@desklib.com
Available 24*7 on WhatsApp / Email
![[object Object]](/_next/static/media/star-bottom.7253800d.svg)
Unlock your academic potential
Copyright © 2020–2026 A2Z Services. All Rights Reserved. Developed and managed by ZUCOL.