Farm Equipment International (FEI) Lean Manufacturing Case Study

Verified

Added on  2022/09/10

|6
|1352
|19
Project
AI Summary
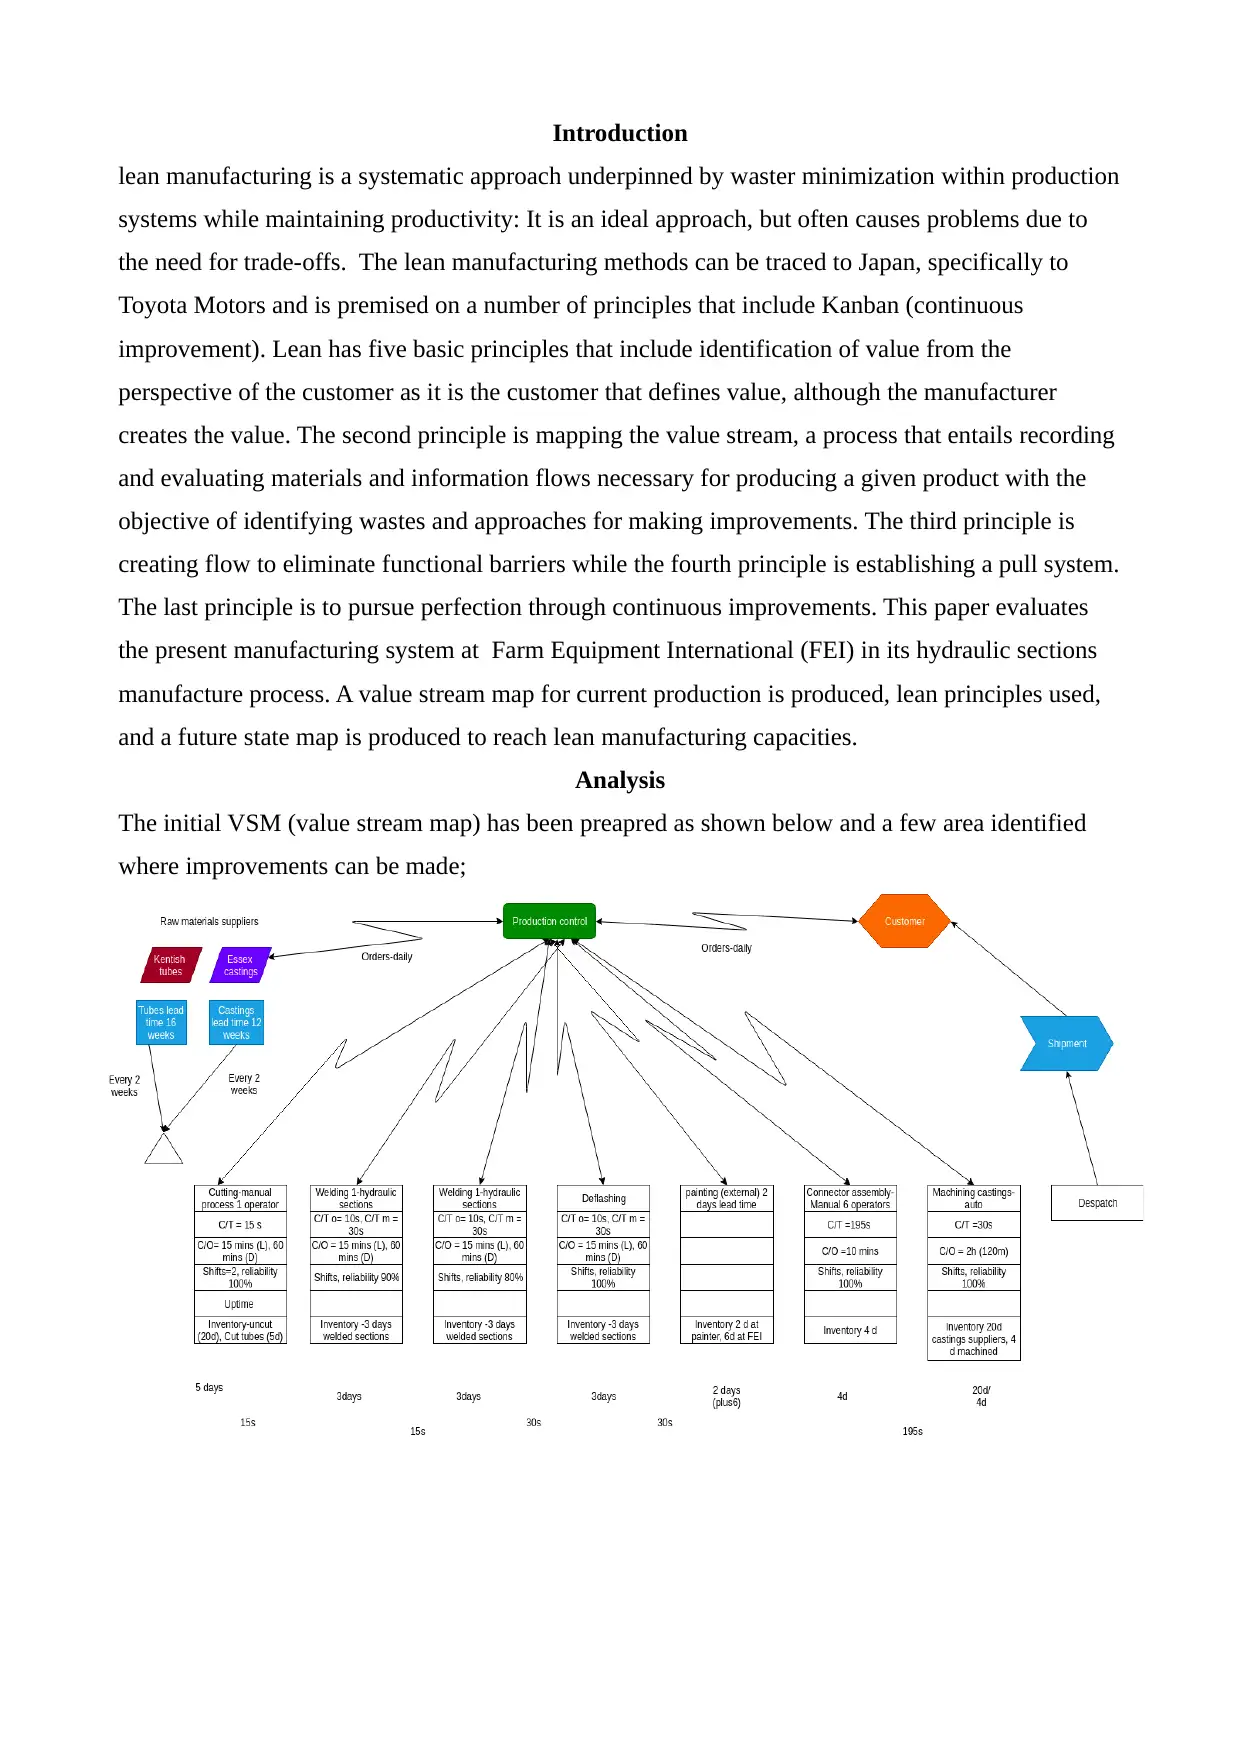
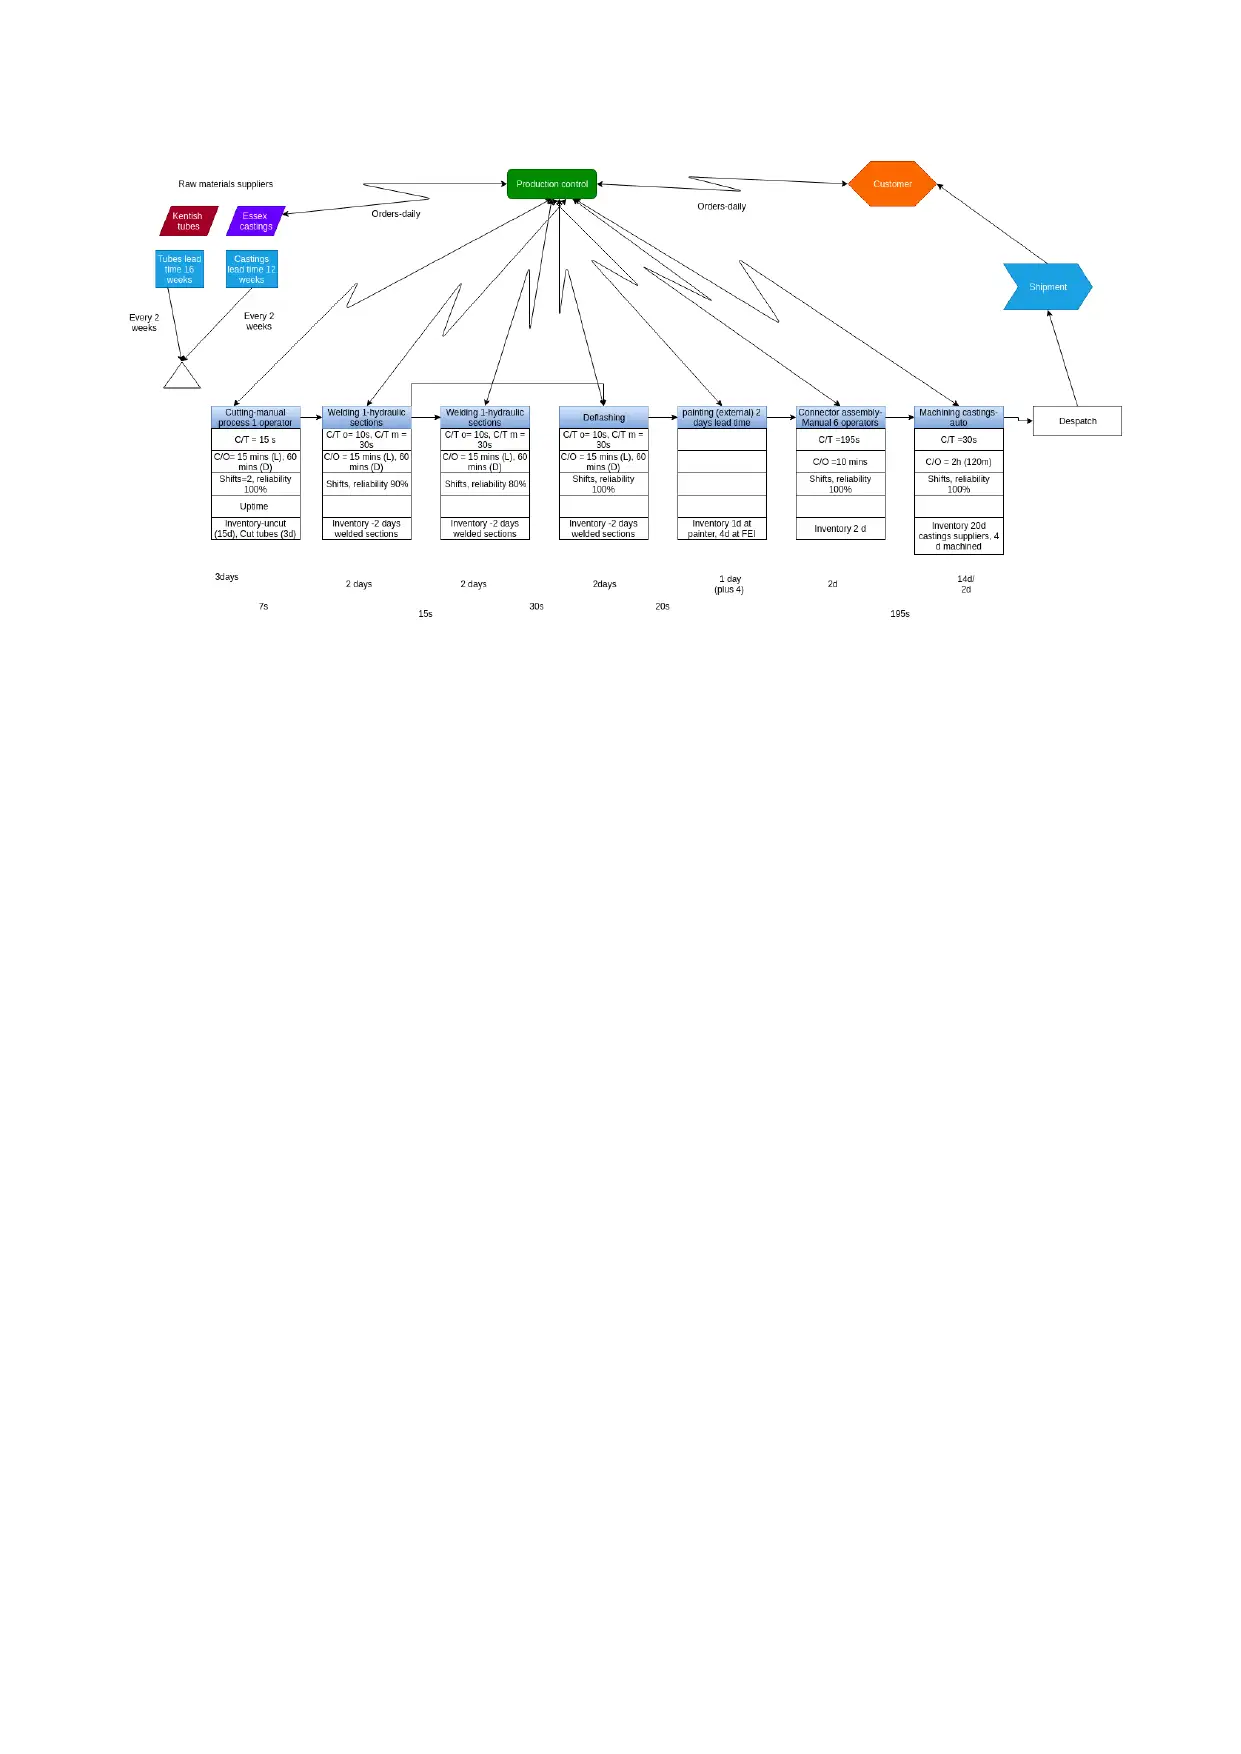
This project analyzes the current manufacturing system at Farm Equipment International (FEI) focusing on the hydraulic sections manufacture process. The assignment involves creating a value stream map of the current production process, applying lean manufacturing principles, and producing a future state map to achieve lean manufacturing capabilities. The analysis identifies bottlenecks in ordering, cutting, welding, deflashing, painting, and assembly processes. The solution proposes improvements such as optimizing supplier lead times, reducing inventory, matching production to demand forecasts, and streamlining workflows. The new value stream map reflects reduced cycle times and inventory days across various sections, emphasizing the importance of demand forecasting and ordering optimization for a pull system. References to relevant literature support the analysis and recommendations.
Document Page
Lean Manufacturing
Farm Equipment International Case Study
tabler-icon-diamond-filled.svg

Paraphrase This Document

Need a fresh take? Get an instant paraphrase of this document with our AI Paraphraser
Document Page
Introduction
lean manufacturing is a systematic approach underpinned by waster minimization within production
systems while maintaining productivity: It is an ideal approach, but often causes problems due to
the need for trade-offs. The lean manufacturing methods can be traced to Japan, specifically to
Toyota Motors and is premised on a number of principles that include Kanban (continuous
improvement). Lean has five basic principles that include identification of value from the
perspective of the customer as it is the customer that defines value, although the manufacturer
creates the value. The second principle is mapping the value stream, a process that entails recording
and evaluating materials and information flows necessary for producing a given product with the
objective of identifying wastes and approaches for making improvements. The third principle is
creating flow to eliminate functional barriers while the fourth principle is establishing a pull system.
The last principle is to pursue perfection through continuous improvements. This paper evaluates
the present manufacturing system at Farm Equipment International (FEI) in its hydraulic sections
manufacture process. A value stream map for current production is produced, lean principles used,
and a future state map is produced to reach lean manufacturing capacities.
Analysis
The initial VSM (value stream map) has been preapred as shown below and a few area identified
where improvements can be made;
Document Page
Ordering from suppliers
The lead time to get goods from Kentish is 16 weeks, however, they deliver every two weeks while
castings are delivered every 2 weeks, with a 12 week lead time. The process can be improved so
that the deliveries match the demand; but because of a longer lead time, FEI will stick with the
ordering schedule so it does not run out of raw materials. The uncut inventory is 20 days, meaning
there is more than enough inventory given the two week ordering window. The company should
reduce the amount of items ordered for the metal rods to minimize inventory holding costs and have
an inventory of 15 days to cover for the 2 week delivery frequency of the raw materials. Fewer
materials should be ordered regularly to reduce inventory and inventory management costs. The
ordering should be based on forecast demand, which is 24000 pieces a month; this works to an
average of 800 a day, so about 1000 should be produced daily.
Cutting
This is a manual process that has a 15 second cycle time and a 15 minute changeover for length
cutting and sixty minutes for diameter cuts while changing between the three types of cast
connectors is two hours. The number of pieces cut should be reduced to match the estimated daily
demand that can be projected using historical data and ordering frequencies (Ramanathan, 2012).
This will ensure that work moves faster and minimize or eliminate the need for two work shifts,
which based on demand, is another waste. This process has 5 inventory days, which means there is
a lot of wastage in terms of inventory management and idle materials that have been cut. There
needs to be two operators rather than one in this stage of the process.
Welding Station 1
have two processes with similar cycle times, an operator takes ten seconds while the machine takes
30 seconds. The inventory days are 3 for both and this also represents a bottleneck because it results
in unnecessary inventory days at the cutting stage (Kalchschmidt, 2012). The number of welded
materials should be reduced to match the fore-casted demand and minimize too much inventory that
only serves to make the system inefficient.
Welding Station 2
The workstation should have reduced workload based on the demand forecast and in this case, it is
recommended 1000 pieces be welded daily so as to match demand forecast and cater to period of
low or higher demand on a daily basis (Roser and Nakano, 2015).
Deflashing
The deflashing section has a bottleneck created by having a single operator taking ten seconds while
the machine takes 30 seconds. Based on the previous section, this section can continue operating as
Document Page
is, based on the pull system which is the average demand and expected demand for parts
(Ramanathan, 2012).
Painting
While this is an external process, it represents a major bottleneck; improvements are definitely
needed in this section by having fewer products delivered so that the lead time is reduced to one day
or less and the inventory of finished painted products is reduced to 4 days or less.
Assembly
The connector assembly is also a bottleneck; there is a 6 day inventory of painted materials, and this
can be reduced by having just the required number of parts worked on at the assembly section. The
current six operators are sufficient for the new workload in two shifts so that the necessary
painted parts are finished and being made ready for delivery. The section has a four day inventory
which can be reduced to 1.5 days by also increasing the frequency of work in the machining
castings. This is a machine process and can have two shifts, but with reduced workload to reduce
the inventory days from 4 to 2 or a single day(s). This section has a 20 day inventory that obviously
needs to be reduced as well.
Dispatch and Shipment
This can be improved so that any changes to specifications from customers can be received within a
week (five days) instead of the current two weeks. The shipping schedule can be updated twice
daily so there are two major dispatches every day, morning and evening.
The process can be further improved through demand forecasting so that raw materials are ordered
based on fairly accurate demand forecasts rater than based on what customers have ordered. This
will result in the pull system being more efficient and orders made upfront and increased or
decreased (as required) such that the raw materials arrive just in time when they are needed (Ghosh,
2012).
The new value stream map is shown below and shows that the cycle times and inventory days have
been reduced for the various sections. This is a continuous process so more improvements can be
made, however, the improvements must start at the extreme ends of the system- demand forecasting
and ordering so that fewer inventory is ordered as per the demand forecast. The demand forecast
will act as the ‘pull’ of the entire system (Yang et al., 2015).
tabler-icon-diamond-filled.svg

Paraphrase This Document

Need a fresh take? Get an instant paraphrase of this document with our AI Paraphraser
Document Page
Document Page
References
Ghosh, M. (2012). Lean manufacturing performance in Indian manufacturing plants. Journal of
Manufacturing Technology Management, 24(1), pp.113-122.
Kalchschmidt, M. (2012). Best practices in demand forecasting: Tests of universalistic, contingency
and configurational theories. International Journal of Production Economics, 140(2), pp.782-793.
Ramanathan, U. (2012). Supply chain collaboration for improved forecast accuracy of promotional
sales. International Journal of Operations & Production Management, 32(6), pp.676-695.
Roser, C. and Nakano, M. (2015). A Quantitative Comparison of Bottleneck Detection Methods in
Manufacturing Systems with Particular Consideration for Shifting Bottlenecks. Advances in
Production Management Systems: Innovative Production Management Towards Sustainable
Growth, pp.273-281.
Yang, T., Kuo, Y., Su, C. and Hou, C. (2015). Lean production system design for fishing net
manufacturing using lean principles and simulation optimization. Journal of Manufacturing
Systems, 34, pp.66-73.
chevron_up_icon
1 out of 6
circle_padding
hide_on_mobile
zoom_out_icon
[object Object]