Financial Analysis and Performance Evaluation of Farsons and Heiniken
VerifiedAdded on 2023/01/18
|33
|4061
|58
Report
AI Summary
This report presents a comprehensive financial analysis of Farsons and Heiniken, two companies in the beer and beverage industry. The analysis employs vertical, horizontal, and ratio analysis techniques to evaluate their financial performance and position. The report examines the income statements and balance sheets of both companies over several years, assessing trends in gross profit, net profit, assets, and liabilities. Furthermore, it includes an evaluation of working capital and cash flow, providing a holistic view of their financial health. The findings offer insights into the companies' profitability, efficiency, and liquidity, aiding in understanding their financial strengths and weaknesses. The report concludes with an overall assessment of the companies' financial performance, drawing comparisons and highlighting key observations.
Financial Analysis
Management
Enterprise
Management
Enterprise
Paraphrase This Document
Need a fresh take? Get an instant paraphrase of this document with our AI Paraphraser
INTRODUCTION...........................................................................................................................3
TASK...............................................................................................................................................3
Evaluation of the financial performance and financial position of Farsons and Heiniken:.. .4
Evaluation of the Working Capital:...................................................................................9
Assessment of the Cash Flow:..............................................................................................10
Overall assessment:..............................................................................................................11
CONCLUSION..............................................................................................................................11
REFERENCES..............................................................................................................................12
APPENDIX....................................................................................................................................13
INTRODUCTION
Financial analyses are the tool which is used by the organization in order to evaluate the
financial information as well s performance of the company in the accounting period. It is
recommended to measure the performance of the company in terms of liquidity, profitability or
efficiecncy of the company. It is used to measured the enterprise is effectively operating, solvent,
having favourable liquidity position, or competitive to justify any investment in capital
(Williams and Dobelman, 2017). This project report cover various evaluations such as vertical,
horizontal or ratio analysis which helps in measuring financial performance of Farsons and
Heiniken. Both organizations are beer, wine or soft drink manufacturing companies. This report
includes the comparative analysis of working capital and cash flows of respective companies.
TASK
Overview of Companies:
Farsons: It is Malta based company which manufacture the beer and beverages item.
Company is engaged in production, brewing, sales and distribution of premium quality beers and
other beverages. Company directly supply their products as wholesale as well as retailers.
Company offer wide range of beer which attracts the customers or make their brand leading
company of the industry. There are some most popular beers or products of the company such as
are Blue Label Ale, Kinnie range of soft drinks, Hopleaf Pale Ale, San Michel table water, Cisk
Lager etc. Farsons is the first non-commercial banking company which listed on Malta Stock
Exchange and its share traded as SFC in the market.
Heiniken: It is the most popular manufacture of seller of beer which offer quality
products. It is Dutch company which approx. manufacture over 300 global, local and speciality
ciders and beers. Company globally diversify which have skilled person to perform its
operational activities in well manner, approximately over 85000 operate breweries, workers and
employees. Company is currently operated in over 70 countries and capture the major share of
the overall beverage industry. Heiniken introduce variety of products that’s why it is called
innovated Company of their sector. Main agenda of this business is to create value for consumers
which are the biggest strength and then success criteria.
⊘ This is a preview!⊘
Do you want full access?
Subscribe today to unlock all pages.
Trusted by 1+ million students worldwide
Evaluation of the financial performance and financial position of Farsons and Heiniken:
Vertical analysis: In this analysis, each item proportion will be evaluated which
mentioned in the financial statement of the company. Each and every item described in a (%)
proportion form. Evaluation based on increase or decrease in the proportion of each item of
Income Statement such as gross profit, overall sales, revenue etc. Balance sheet item also
evaluated in proportion form and it includes the value of assets as well as liability. Vertical
analysis of selected companies is mentioned below and it is based on the financial statements:
Heiniken:
Income Statement:
With the help of vertical analysis of income statement of Heiniken Plc it has been
evacuate that gross profits of the company in proportion declined in 2018 to 51.29% but it will
be reported after continuous improvement from the period of 2015 to 2017. Along with this,
further analysis based on net profit of the company was like 4.67% in 2015 which is increases in
comparisons to 2016 and it was 3.75%. Further this proportion reached at 4.46% and 4.28% in
2017 and 2018 respectively (Annual Report of Heiniken. 2019).
Statement of financial position:
Further analysis based on the Balance sheet item which represent that non current assets
of the company are 84.32%, 79.31%, 79.90% and 78.38% of total assets for the period of 2015,
2016, 2017 and 2018 respectively. It shows the decline in the value of non current assets for the
respective years. Other than this, cash value proportion of the company in comparisons to total
assets of the company. It was increased in 2018 to 6.92%, 2.23% in 2015, 7.72% in 2016 and
5.95% in 2017. In addition it include the analysis of current assets which are 15.68%, 20.69%,
20.10% and 21.62% of total assets of company for the period of 2015, 2016, 2017 and 2018
respectively.
Shareholder's funds of the company evaluated as 17.06% of total assets in 2018 and in
the previous years it was 17.90%, 16.78% and 16.16% for the duration of 2015, 2016 and 2017
respectively. Current liabilities of the company reduce from 26.44% to 24.91% in the period of
2016 to 2018. Along with this, vertical analysis evaluates the non-current liabilities which were
decreases from 59.52% to 58.03% for the duration of 2015 to 2018.
Farsons:
Income Statement:
Paraphrase This Document
Need a fresh take? Get an instant paraphrase of this document with our AI Paraphraser
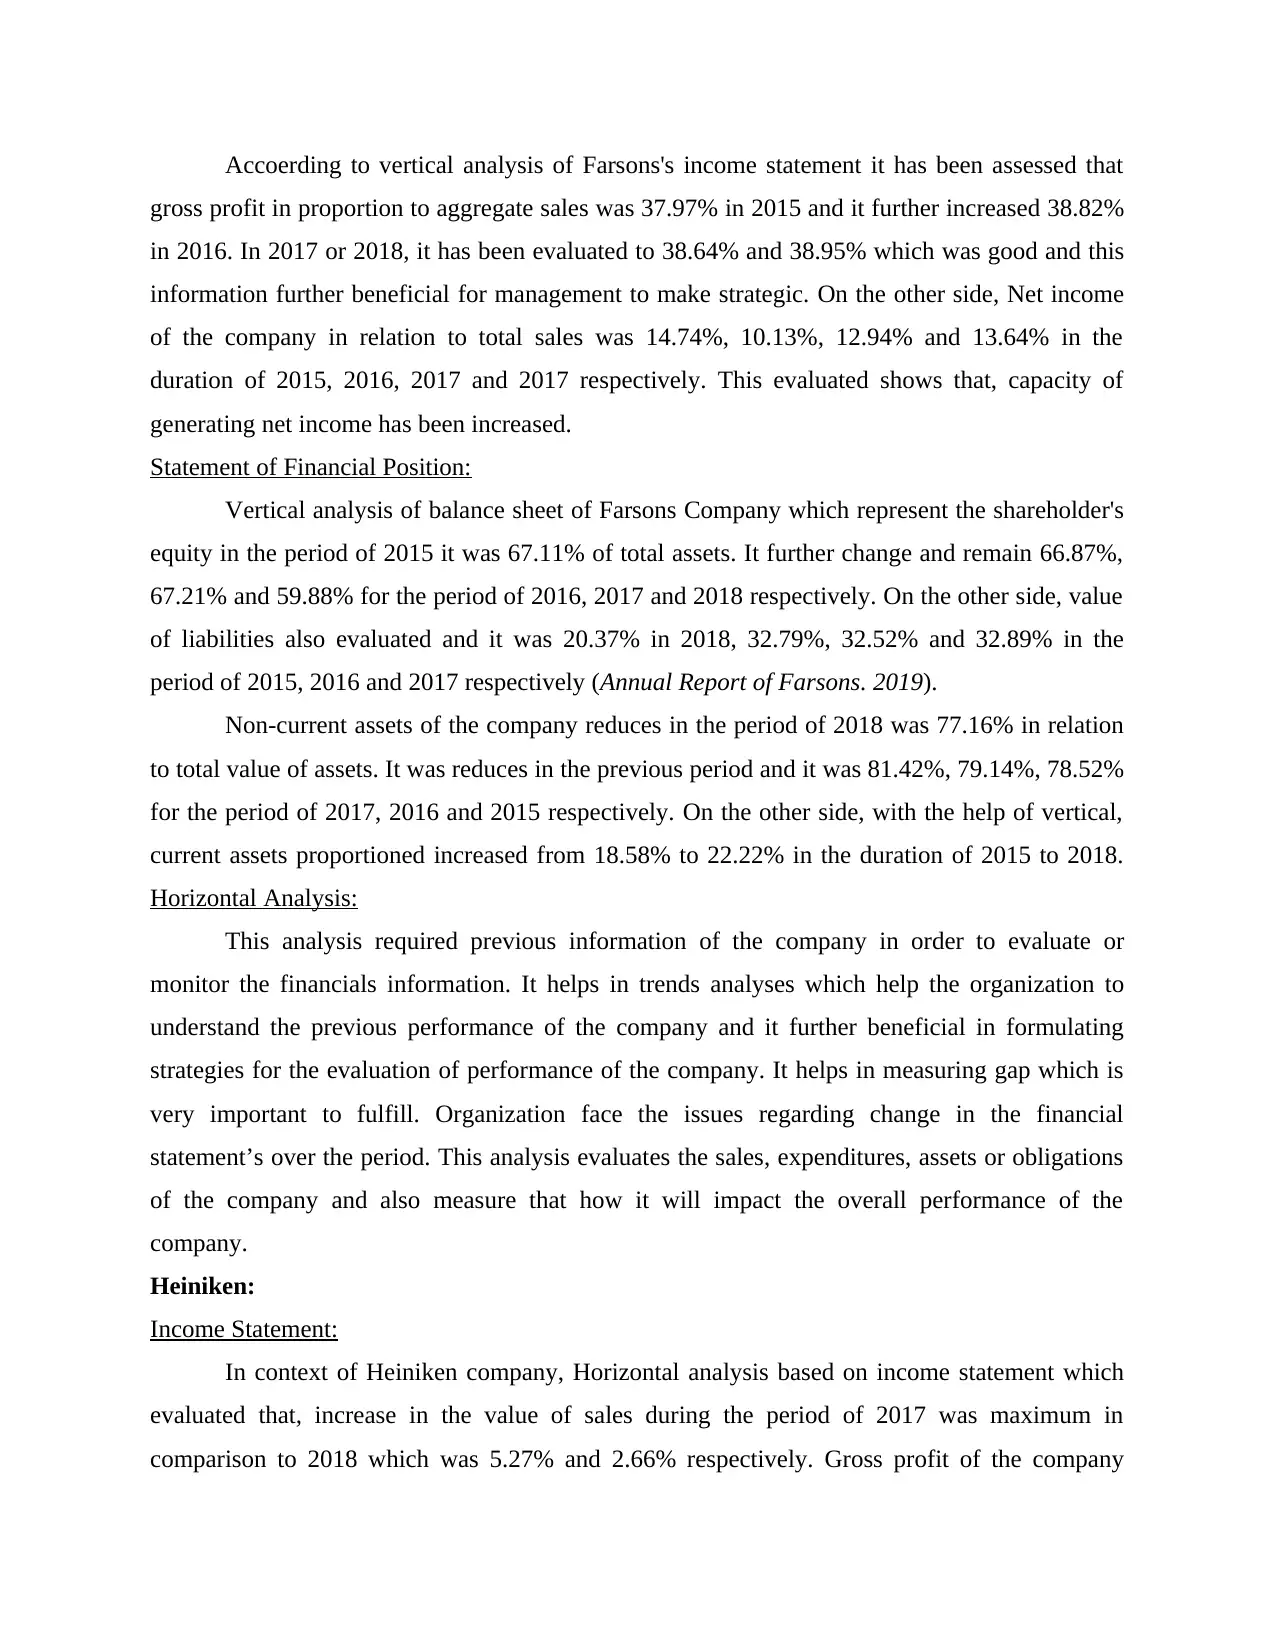
Accoerding to vertical analysis of Farsons's income statement it has been assessed that
gross profit in proportion to aggregate sales was 37.97% in 2015 and it further increased 38.82%
in 2016. In 2017 or 2018, it has been evaluated to 38.64% and 38.95% which was good and this
information further beneficial for management to make strategic. On the other side, Net income
of the company in relation to total sales was 14.74%, 10.13%, 12.94% and 13.64% in the
duration of 2015, 2016, 2017 and 2017 respectively. This evaluated shows that, capacity of
generating net income has been increased.
Statement of Financial Position:
Vertical analysis of balance sheet of Farsons Company which represent the shareholder's
equity in the period of 2015 it was 67.11% of total assets. It further change and remain 66.87%,
67.21% and 59.88% for the period of 2016, 2017 and 2018 respectively. On the other side, value
of liabilities also evaluated and it was 20.37% in 2018, 32.79%, 32.52% and 32.89% in the
period of 2015, 2016 and 2017 respectively (Annual Report of Farsons. 2019).
Non-current assets of the company reduces in the period of 2018 was 77.16% in relation
to total value of assets. It was reduces in the previous period and it was 81.42%, 79.14%, 78.52%
for the period of 2017, 2016 and 2015 respectively. On the other side, with the help of vertical,
current assets proportioned increased from 18.58% to 22.22% in the duration of 2015 to 2018.
Horizontal Analysis:
This analysis required previous information of the company in order to evaluate or
monitor the financials information. It helps in trends analyses which help the organization to
understand the previous performance of the company and it further beneficial in formulating
strategies for the evaluation of performance of the company. It helps in measuring gap which is
very important to fulfill. Organization face the issues regarding change in the financial
statement’s over the period. This analysis evaluates the sales, expenditures, assets or obligations
of the company and also measure that how it will impact the overall performance of the
company.
Heiniken:
Income Statement:
In context of Heiniken company, Horizontal analysis based on income statement which
evaluated that, increase in the value of sales during the period of 2017 was maximum in
comparison to 2018 which was 5.27% and 2.66% respectively. Gross profit of the company
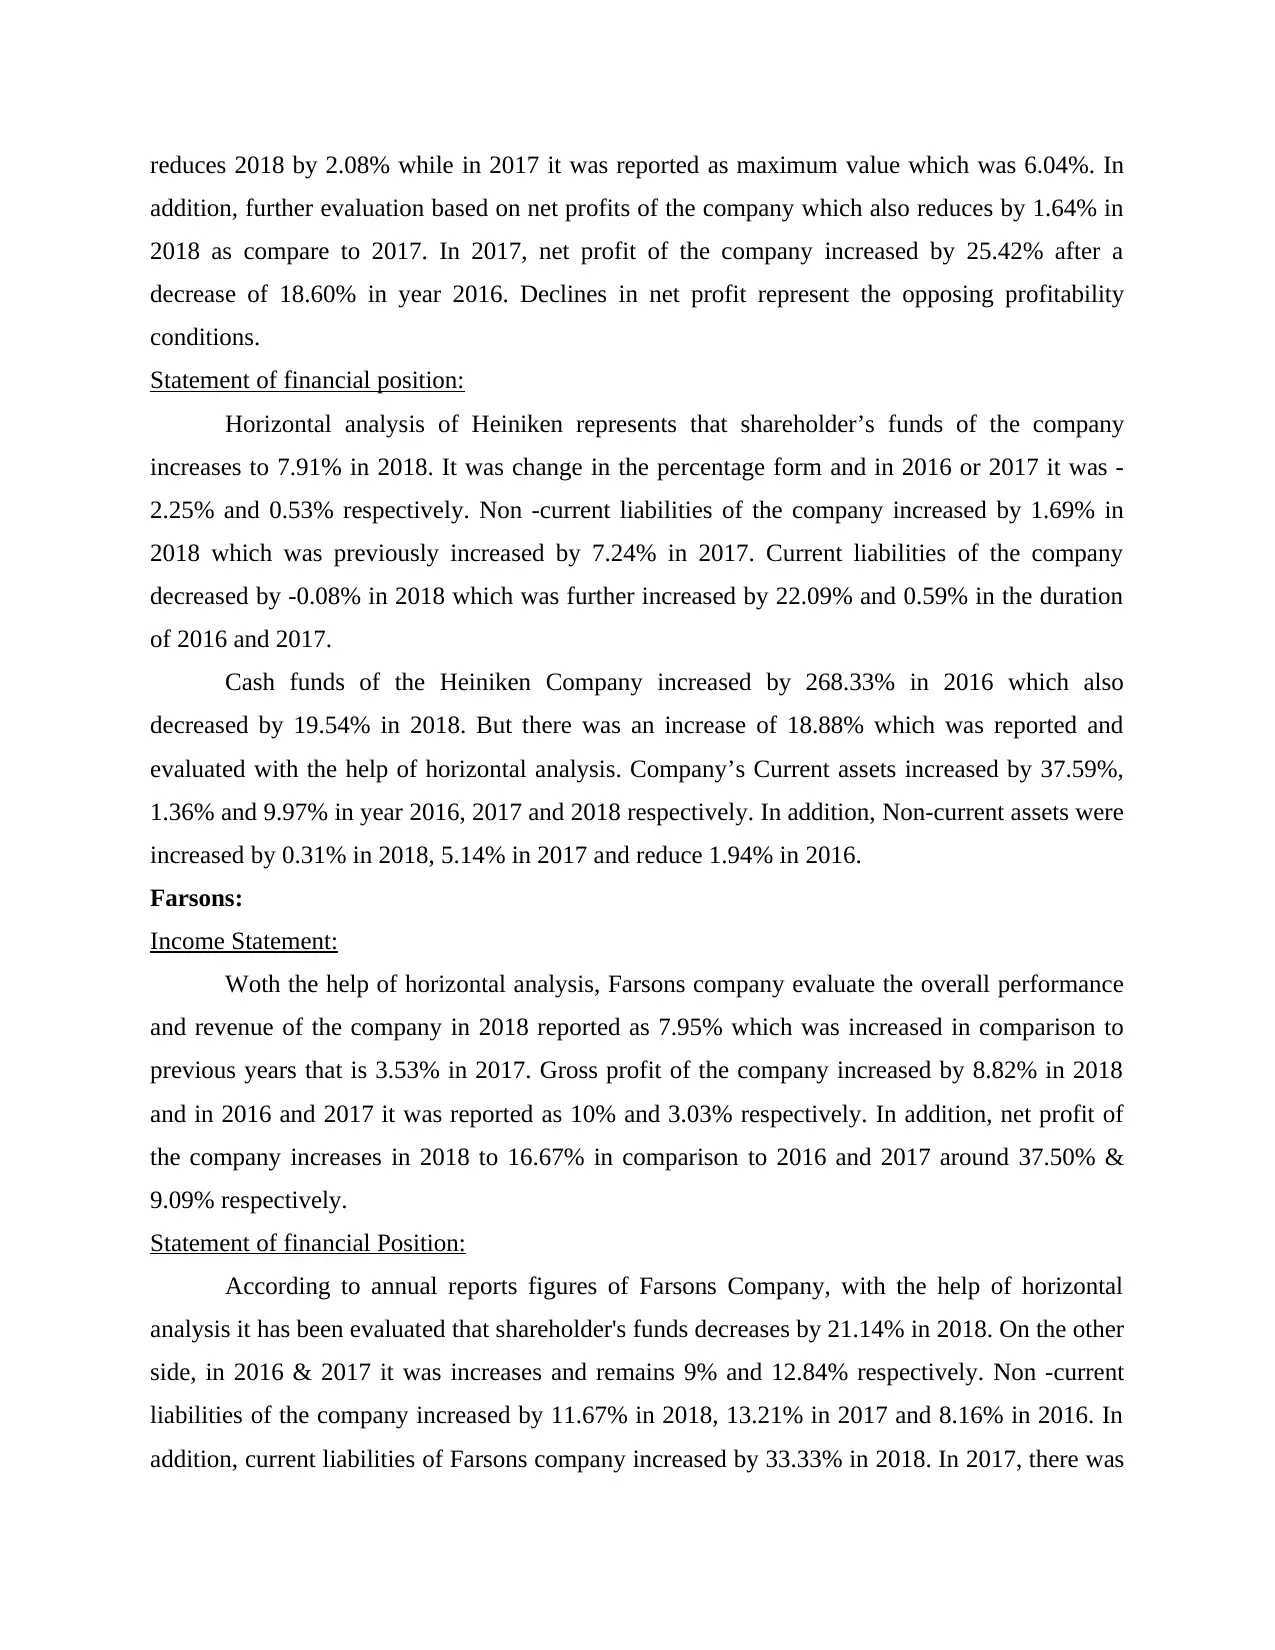
reduces 2018 by 2.08% while in 2017 it was reported as maximum value which was 6.04%. In
addition, further evaluation based on net profits of the company which also reduces by 1.64% in
2018 as compare to 2017. In 2017, net profit of the company increased by 25.42% after a
decrease of 18.60% in year 2016. Declines in net profit represent the opposing profitability
conditions.
Statement of financial position:
Horizontal analysis of Heiniken represents that shareholder’s funds of the company
increases to 7.91% in 2018. It was change in the percentage form and in 2016 or 2017 it was -
2.25% and 0.53% respectively. Non -current liabilities of the company increased by 1.69% in
2018 which was previously increased by 7.24% in 2017. Current liabilities of the company
decreased by -0.08% in 2018 which was further increased by 22.09% and 0.59% in the duration
of 2016 and 2017.
Cash funds of the Heiniken Company increased by 268.33% in 2016 which also
decreased by 19.54% in 2018. But there was an increase of 18.88% which was reported and
evaluated with the help of horizontal analysis. Company’s Current assets increased by 37.59%,
1.36% and 9.97% in year 2016, 2017 and 2018 respectively. In addition, Non-current assets were
increased by 0.31% in 2018, 5.14% in 2017 and reduce 1.94% in 2016.
Farsons:
Income Statement:
Woth the help of horizontal analysis, Farsons company evaluate the overall performance
and revenue of the company in 2018 reported as 7.95% which was increased in comparison to
previous years that is 3.53% in 2017. Gross profit of the company increased by 8.82% in 2018
and in 2016 and 2017 it was reported as 10% and 3.03% respectively. In addition, net profit of
the company increases in 2018 to 16.67% in comparison to 2016 and 2017 around 37.50% &
9.09% respectively.
Statement of financial Position:
According to annual reports figures of Farsons Company, with the help of horizontal
analysis it has been evaluated that shareholder's funds decreases by 21.14% in 2018. On the other
side, in 2016 & 2017 it was increases and remains 9% and 12.84% respectively. Non -current
liabilities of the company increased by 11.67% in 2018, 13.21% in 2017 and 8.16% in 2016. In
addition, current liabilities of Farsons company increased by 33.33% in 2018. In 2017, there was
⊘ This is a preview!⊘
Do you want full access?
Subscribe today to unlock all pages.
Trusted by 1+ million students worldwide
nothing change in the figures and total assets value reduced by 11.48% in 2018 but it was
increased in 2017 and 2016 from 12.27% and 9.40% respectively. Non- current assets of the
company reduces by 16.11% which was previously increased by 15.50% in 2017 and 10.26% in
year 2016.
Ratio Analysis:
It is refer to the systematic approach which used in evaluating organisational performance
in terms of profitability, liquidity, efficiency etc. This analysis based on the financial information
of the years. Evaluation will be done by top managements or analyst in order to analyse the
various aspect which is beneficial for making future strategies. Ration analysis of the selected
companies are mentioned below:
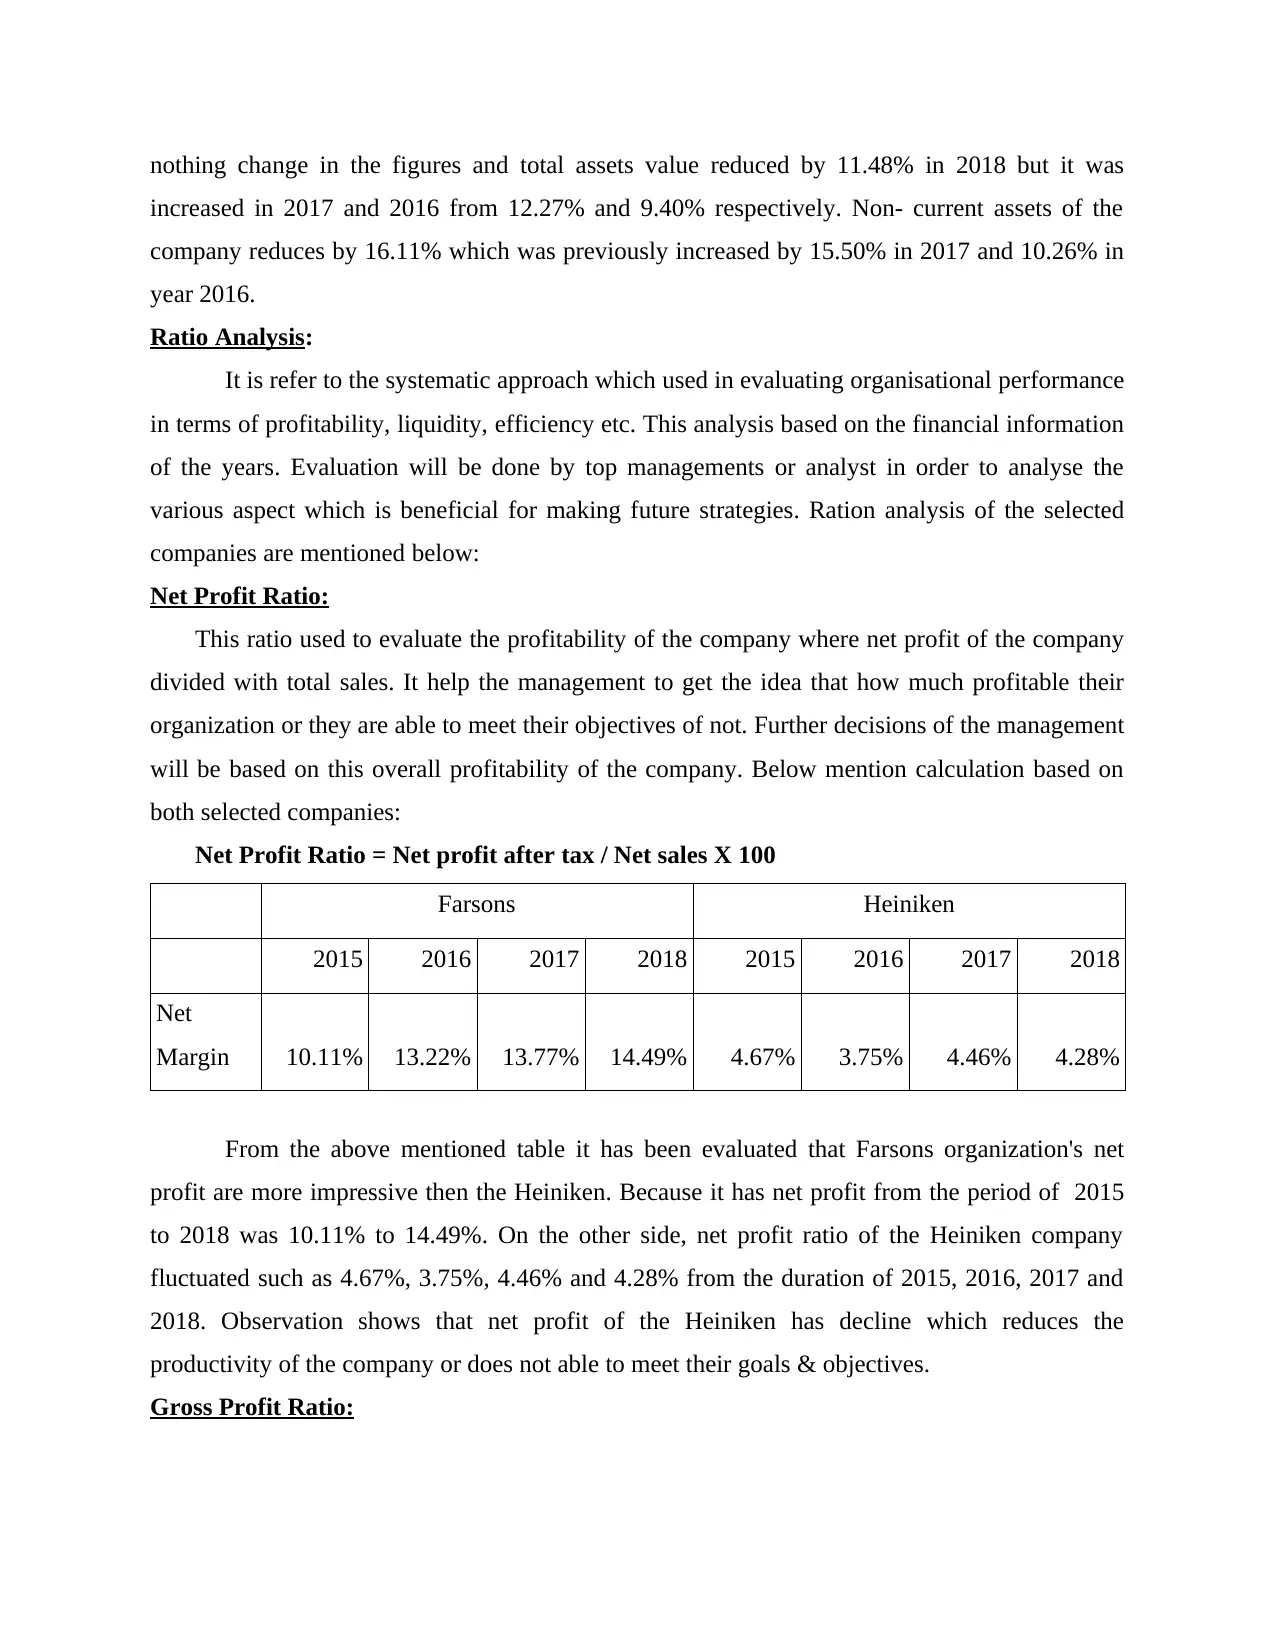
Net Profit Ratio:
This ratio used to evaluate the profitability of the company where net profit of the company
divided with total sales. It help the management to get the idea that how much profitable their
organization or they are able to meet their objectives of not. Further decisions of the management
will be based on this overall profitability of the company. Below mention calculation based on
both selected companies:
Net Profit Ratio = Net profit after tax / Net sales X 100
Farsons Heiniken
2015 2016 2017 2018 2015 2016 2017 2018
Net
Margin 10.11% 13.22% 13.77% 14.49% 4.67% 3.75% 4.46% 4.28%
From the above mentioned table it has been evaluated that Farsons organization's net
profit are more impressive then the Heiniken. Because it has net profit from the period of 2015
to 2018 was 10.11% to 14.49%. On the other side, net profit ratio of the Heiniken company
fluctuated such as 4.67%, 3.75%, 4.46% and 4.28% from the duration of 2015, 2016, 2017 and
2018. Observation shows that net profit of the Heiniken has decline which reduces the
productivity of the company or does not able to meet their goals & objectives.
Gross Profit Ratio:
increased in 2017 and 2016 from 12.27% and 9.40% respectively. Non- current assets of the
company reduces by 16.11% which was previously increased by 15.50% in 2017 and 10.26% in
year 2016.
Ratio Analysis:
It is refer to the systematic approach which used in evaluating organisational performance
in terms of profitability, liquidity, efficiency etc. This analysis based on the financial information
of the years. Evaluation will be done by top managements or analyst in order to analyse the
various aspect which is beneficial for making future strategies. Ration analysis of the selected
companies are mentioned below:
Net Profit Ratio:
This ratio used to evaluate the profitability of the company where net profit of the company
divided with total sales. It help the management to get the idea that how much profitable their
organization or they are able to meet their objectives of not. Further decisions of the management
will be based on this overall profitability of the company. Below mention calculation based on
both selected companies:
Net Profit Ratio = Net profit after tax / Net sales X 100
Farsons Heiniken
2015 2016 2017 2018 2015 2016 2017 2018
Net
Margin 10.11% 13.22% 13.77% 14.49% 4.67% 3.75% 4.46% 4.28%
From the above mentioned table it has been evaluated that Farsons organization's net
profit are more impressive then the Heiniken. Because it has net profit from the period of 2015
to 2018 was 10.11% to 14.49%. On the other side, net profit ratio of the Heiniken company
fluctuated such as 4.67%, 3.75%, 4.46% and 4.28% from the duration of 2015, 2016, 2017 and
2018. Observation shows that net profit of the Heiniken has decline which reduces the
productivity of the company or does not able to meet their goals & objectives.
Gross Profit Ratio:
Paraphrase This Document
Need a fresh take? Get an instant paraphrase of this document with our AI Paraphraser
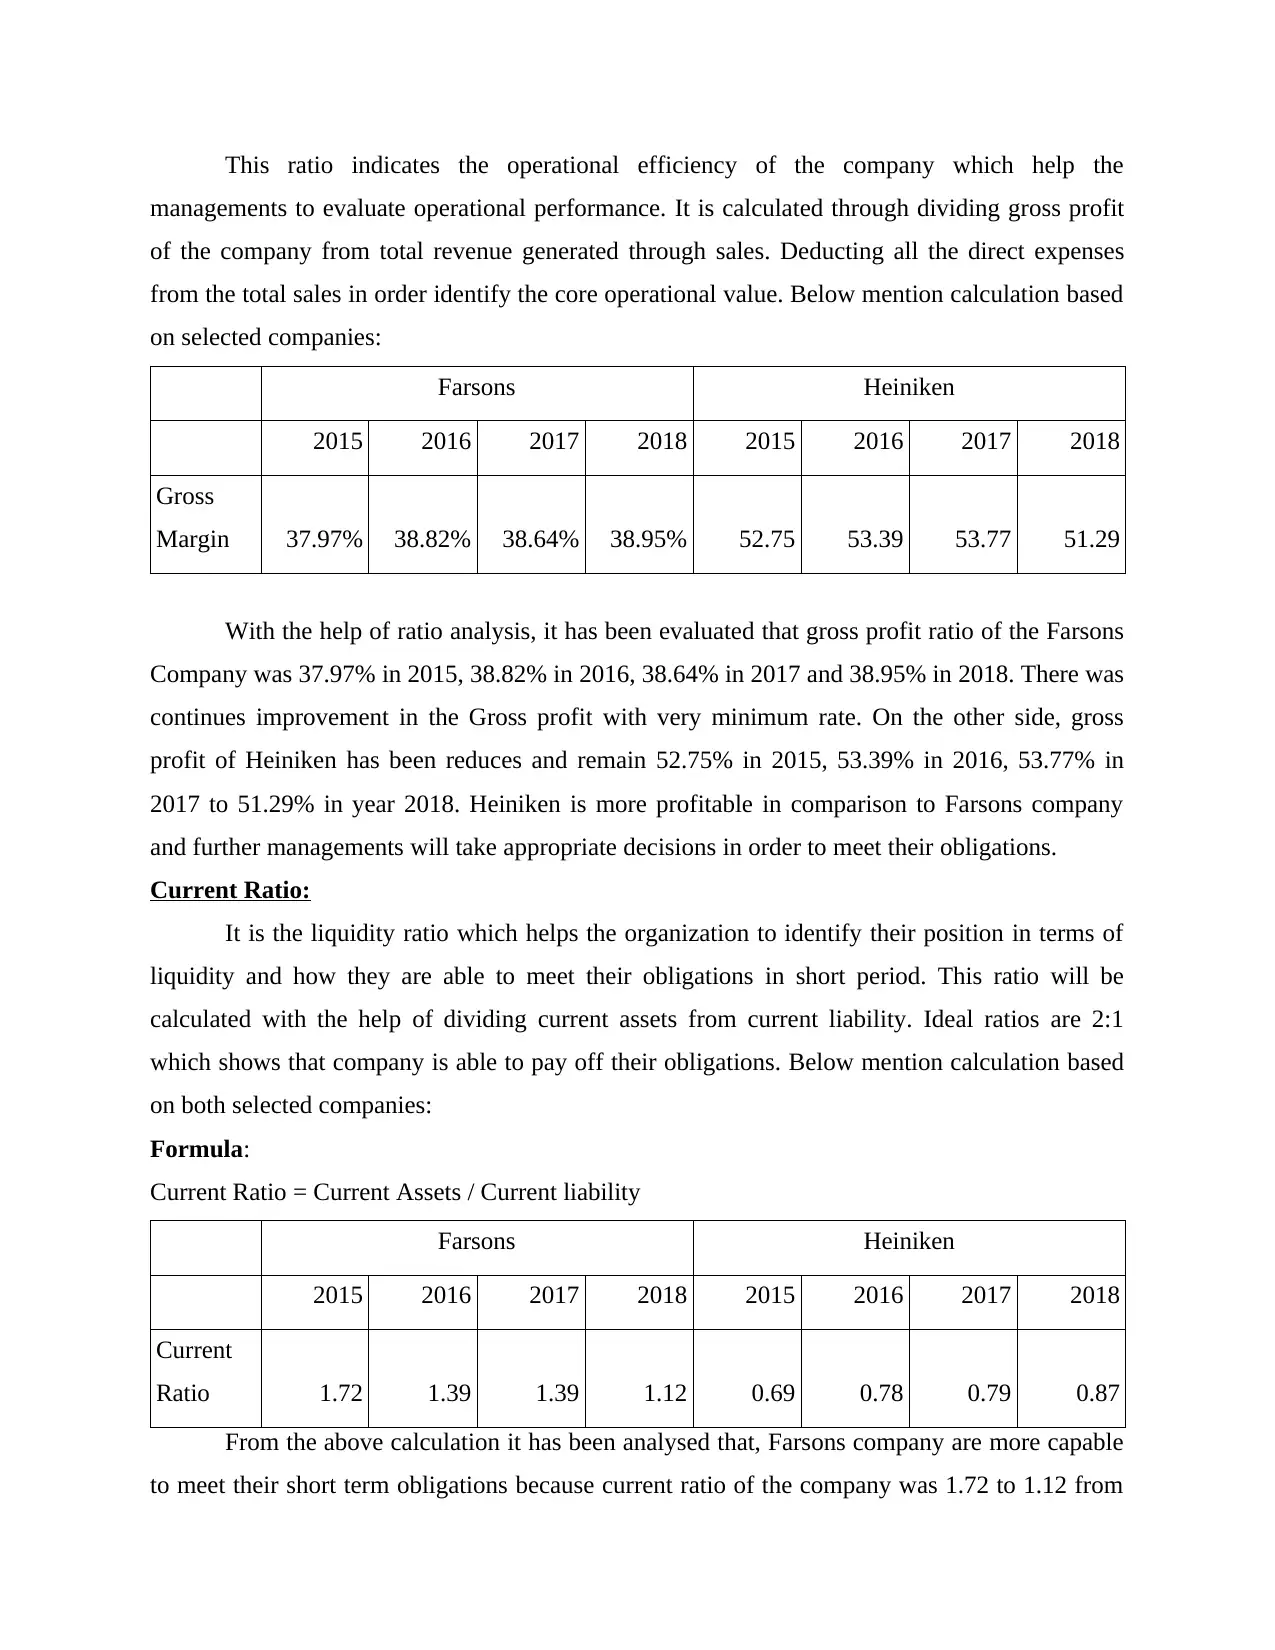
This ratio indicates the operational efficiency of the company which help the
managements to evaluate operational performance. It is calculated through dividing gross profit
of the company from total revenue generated through sales. Deducting all the direct expenses
from the total sales in order identify the core operational value. Below mention calculation based
on selected companies:
Farsons Heiniken
2015 2016 2017 2018 2015 2016 2017 2018
Gross
Margin 37.97% 38.82% 38.64% 38.95% 52.75 53.39 53.77 51.29
With the help of ratio analysis, it has been evaluated that gross profit ratio of the Farsons
Company was 37.97% in 2015, 38.82% in 2016, 38.64% in 2017 and 38.95% in 2018. There was
continues improvement in the Gross profit with very minimum rate. On the other side, gross
profit of Heiniken has been reduces and remain 52.75% in 2015, 53.39% in 2016, 53.77% in
2017 to 51.29% in year 2018. Heiniken is more profitable in comparison to Farsons company
and further managements will take appropriate decisions in order to meet their obligations.
Current Ratio:
It is the liquidity ratio which helps the organization to identify their position in terms of
liquidity and how they are able to meet their obligations in short period. This ratio will be
calculated with the help of dividing current assets from current liability. Ideal ratios are 2:1
which shows that company is able to pay off their obligations. Below mention calculation based
on both selected companies:
Formula:
Current Ratio = Current Assets / Current liability
Farsons Heiniken
2015 2016 2017 2018 2015 2016 2017 2018
Current
Ratio 1.72 1.39 1.39 1.12 0.69 0.78 0.79 0.87
From the above calculation it has been analysed that, Farsons company are more capable
to meet their short term obligations because current ratio of the company was 1.72 to 1.12 from
the period of 2015 to 2018. Current ratio of Heiniken company which was 0.69 to 0.87 for the
period of 2015 to 2018. It was low in comparison to Farsons. It means Farson is more capable to
pay off their debt ort meet their operational requirements
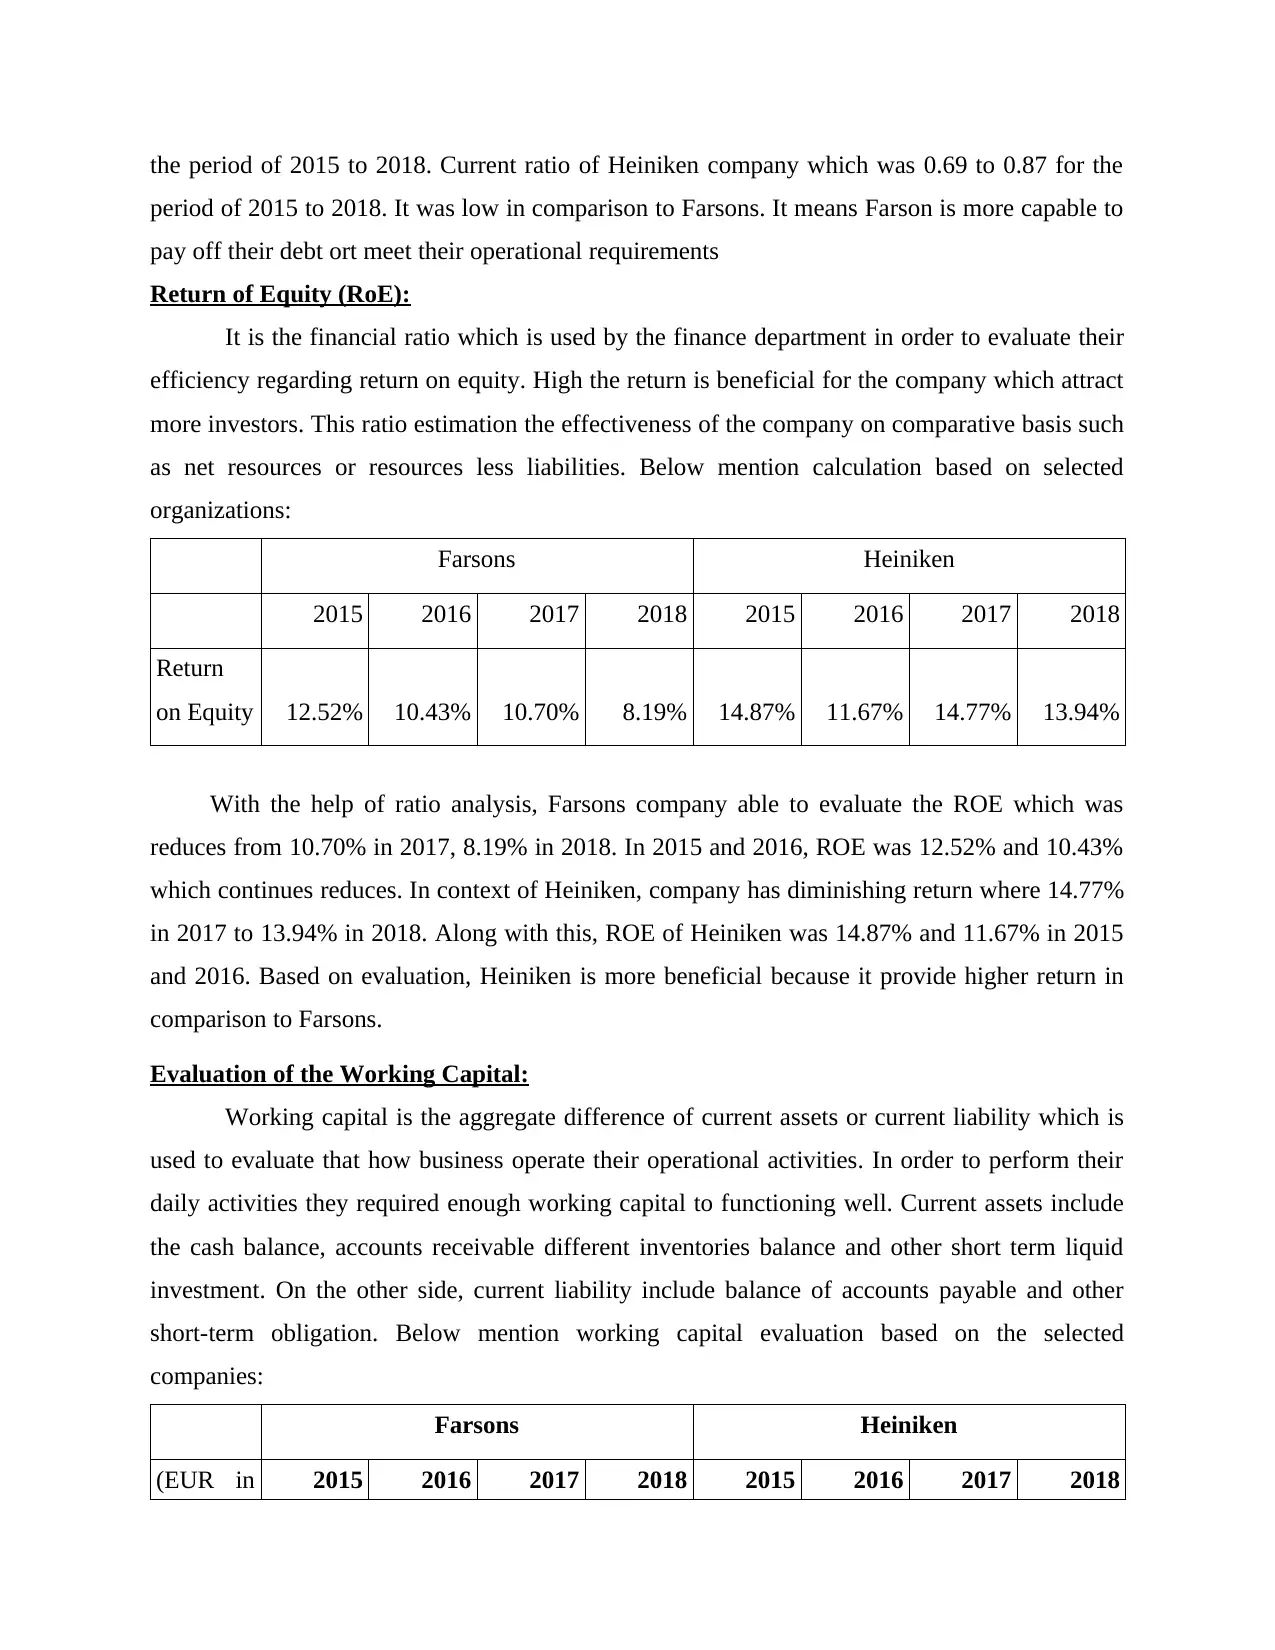
Return of Equity (RoE):
It is the financial ratio which is used by the finance department in order to evaluate their
efficiency regarding return on equity. High the return is beneficial for the company which attract
more investors. This ratio estimation the effectiveness of the company on comparative basis such
as net resources or resources less liabilities. Below mention calculation based on selected
organizations:
Farsons Heiniken
2015 2016 2017 2018 2015 2016 2017 2018
Return
on Equity 12.52% 10.43% 10.70% 8.19% 14.87% 11.67% 14.77% 13.94%
With the help of ratio analysis, Farsons company able to evaluate the ROE which was
reduces from 10.70% in 2017, 8.19% in 2018. In 2015 and 2016, ROE was 12.52% and 10.43%
which continues reduces. In context of Heiniken, company has diminishing return where 14.77%
in 2017 to 13.94% in 2018. Along with this, ROE of Heiniken was 14.87% and 11.67% in 2015
and 2016. Based on evaluation, Heiniken is more beneficial because it provide higher return in
comparison to Farsons.
Evaluation of the Working Capital:
Working capital is the aggregate difference of current assets or current liability which is
used to evaluate that how business operate their operational activities. In order to perform their
daily activities they required enough working capital to functioning well. Current assets include
the cash balance, accounts receivable different inventories balance and other short term liquid
investment. On the other side, current liability include balance of accounts payable and other
short-term obligation. Below mention working capital evaluation based on the selected
companies:
Farsons Heiniken
(EUR in 2015 2016 2017 2018 2015 2016 2017 2018
period of 2015 to 2018. It was low in comparison to Farsons. It means Farson is more capable to
pay off their debt ort meet their operational requirements
Return of Equity (RoE):
It is the financial ratio which is used by the finance department in order to evaluate their
efficiency regarding return on equity. High the return is beneficial for the company which attract
more investors. This ratio estimation the effectiveness of the company on comparative basis such
as net resources or resources less liabilities. Below mention calculation based on selected
organizations:
Farsons Heiniken
2015 2016 2017 2018 2015 2016 2017 2018
Return
on Equity 12.52% 10.43% 10.70% 8.19% 14.87% 11.67% 14.77% 13.94%
With the help of ratio analysis, Farsons company able to evaluate the ROE which was
reduces from 10.70% in 2017, 8.19% in 2018. In 2015 and 2016, ROE was 12.52% and 10.43%
which continues reduces. In context of Heiniken, company has diminishing return where 14.77%
in 2017 to 13.94% in 2018. Along with this, ROE of Heiniken was 14.87% and 11.67% in 2015
and 2016. Based on evaluation, Heiniken is more beneficial because it provide higher return in
comparison to Farsons.
Evaluation of the Working Capital:
Working capital is the aggregate difference of current assets or current liability which is
used to evaluate that how business operate their operational activities. In order to perform their
daily activities they required enough working capital to functioning well. Current assets include
the cash balance, accounts receivable different inventories balance and other short term liquid
investment. On the other side, current liability include balance of accounts payable and other
short-term obligation. Below mention working capital evaluation based on the selected
companies:
Farsons Heiniken
(EUR in 2015 2016 2017 2018 2015 2016 2017 2018
⊘ This is a preview!⊘
Do you want full access?
Subscribe today to unlock all pages.
Trusted by 1+ million students worldwide
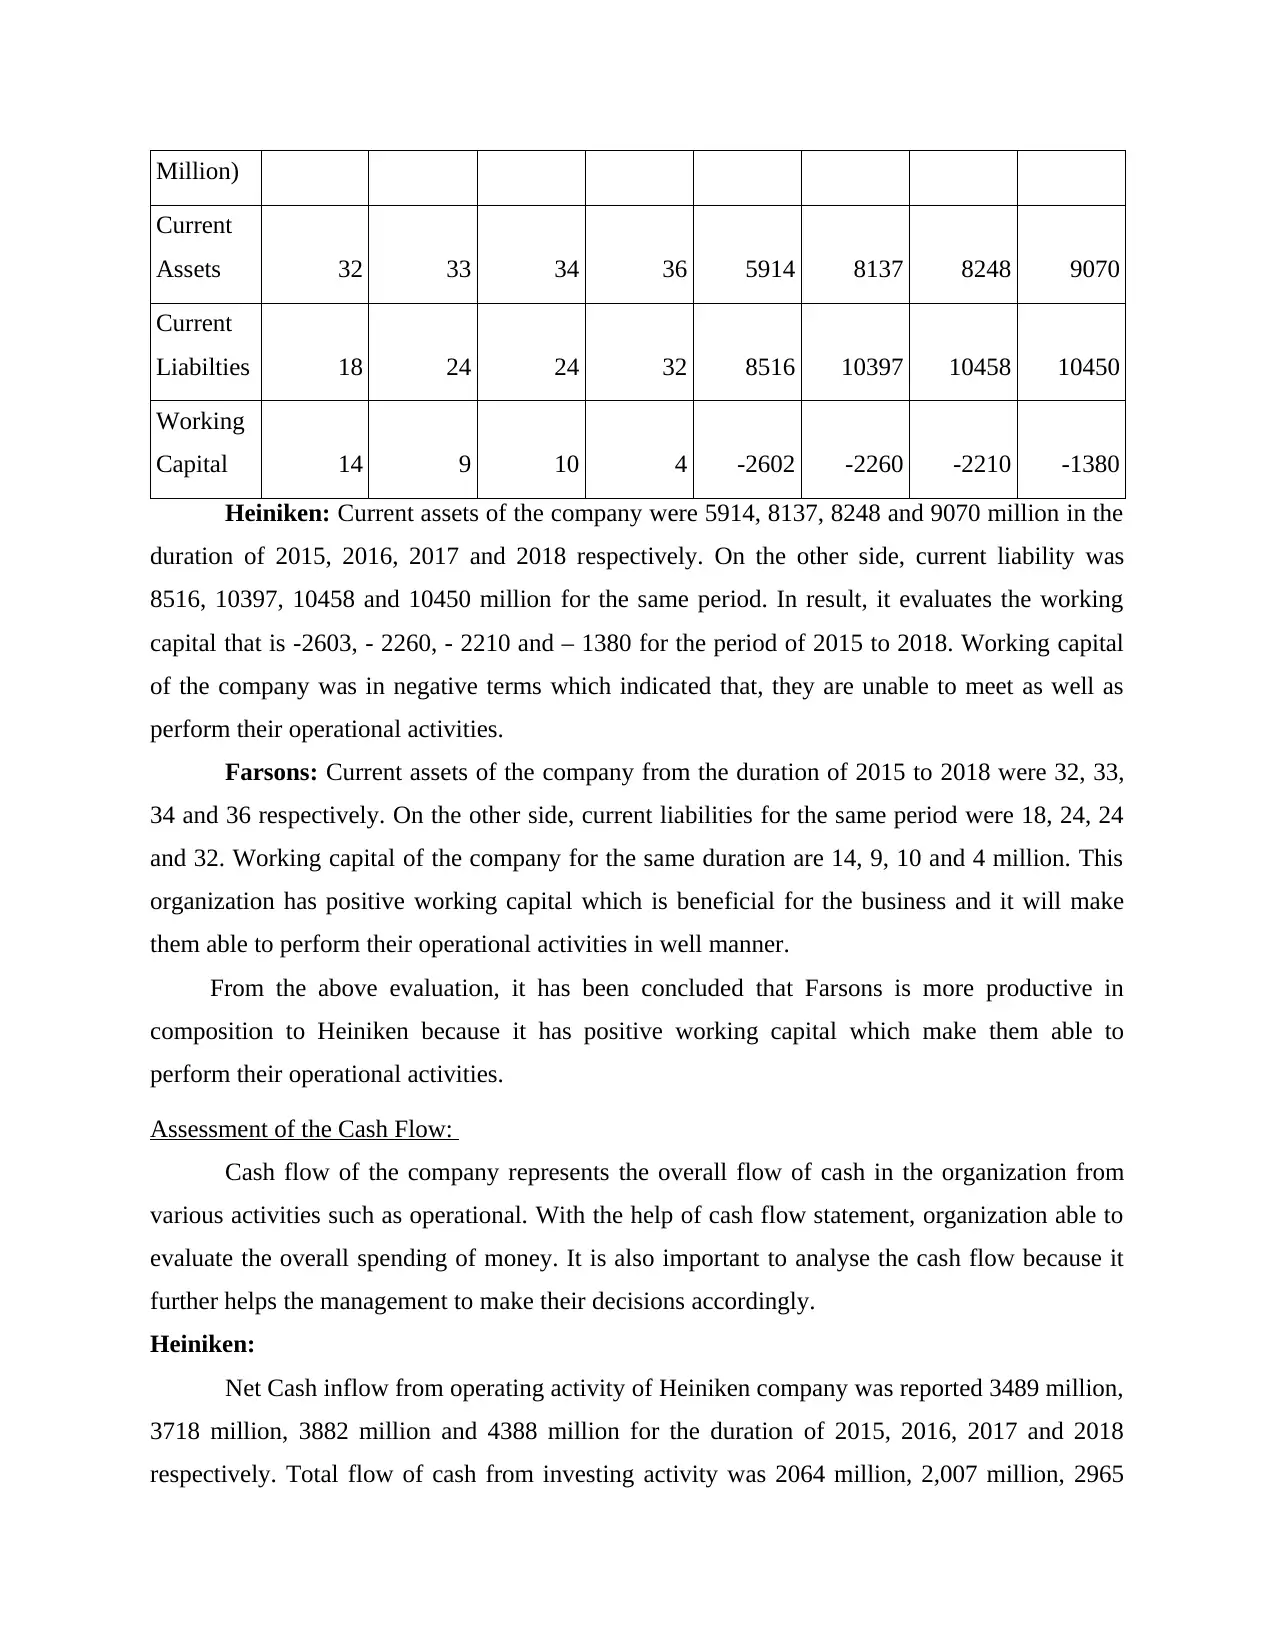
Million)
Current
Assets 32 33 34 36 5914 8137 8248 9070
Current
Liabilties 18 24 24 32 8516 10397 10458 10450
Working
Capital 14 9 10 4 -2602 -2260 -2210 -1380
Heiniken: Current assets of the company were 5914, 8137, 8248 and 9070 million in the
duration of 2015, 2016, 2017 and 2018 respectively. On the other side, current liability was
8516, 10397, 10458 and 10450 million for the same period. In result, it evaluates the working
capital that is -2603, - 2260, - 2210 and – 1380 for the period of 2015 to 2018. Working capital
of the company was in negative terms which indicated that, they are unable to meet as well as
perform their operational activities.
Farsons: Current assets of the company from the duration of 2015 to 2018 were 32, 33,
34 and 36 respectively. On the other side, current liabilities for the same period were 18, 24, 24
and 32. Working capital of the company for the same duration are 14, 9, 10 and 4 million. This
organization has positive working capital which is beneficial for the business and it will make
them able to perform their operational activities in well manner.
From the above evaluation, it has been concluded that Farsons is more productive in
composition to Heiniken because it has positive working capital which make them able to
perform their operational activities.
Assessment of the Cash Flow:
Cash flow of the company represents the overall flow of cash in the organization from
various activities such as operational. With the help of cash flow statement, organization able to
evaluate the overall spending of money. It is also important to analyse the cash flow because it
further helps the management to make their decisions accordingly.
Heiniken:
Net Cash inflow from operating activity of Heiniken company was reported 3489 million,
3718 million, 3882 million and 4388 million for the duration of 2015, 2016, 2017 and 2018
respectively. Total flow of cash from investing activity was 2064 million, 2,007 million, 2965
Current
Assets 32 33 34 36 5914 8137 8248 9070
Current
Liabilties 18 24 24 32 8516 10397 10458 10450
Working
Capital 14 9 10 4 -2602 -2260 -2210 -1380
Heiniken: Current assets of the company were 5914, 8137, 8248 and 9070 million in the
duration of 2015, 2016, 2017 and 2018 respectively. On the other side, current liability was
8516, 10397, 10458 and 10450 million for the same period. In result, it evaluates the working
capital that is -2603, - 2260, - 2210 and – 1380 for the period of 2015 to 2018. Working capital
of the company was in negative terms which indicated that, they are unable to meet as well as
perform their operational activities.
Farsons: Current assets of the company from the duration of 2015 to 2018 were 32, 33,
34 and 36 respectively. On the other side, current liabilities for the same period were 18, 24, 24
and 32. Working capital of the company for the same duration are 14, 9, 10 and 4 million. This
organization has positive working capital which is beneficial for the business and it will make
them able to perform their operational activities in well manner.
From the above evaluation, it has been concluded that Farsons is more productive in
composition to Heiniken because it has positive working capital which make them able to
perform their operational activities.
Assessment of the Cash Flow:
Cash flow of the company represents the overall flow of cash in the organization from
various activities such as operational. With the help of cash flow statement, organization able to
evaluate the overall spending of money. It is also important to analyse the cash flow because it
further helps the management to make their decisions accordingly.
Heiniken:
Net Cash inflow from operating activity of Heiniken company was reported 3489 million,
3718 million, 3882 million and 4388 million for the duration of 2015, 2016, 2017 and 2018
respectively. Total flow of cash from investing activity was 2064 million, 2,007 million, 2965
Paraphrase This Document
Need a fresh take? Get an instant paraphrase of this document with our AI Paraphraser
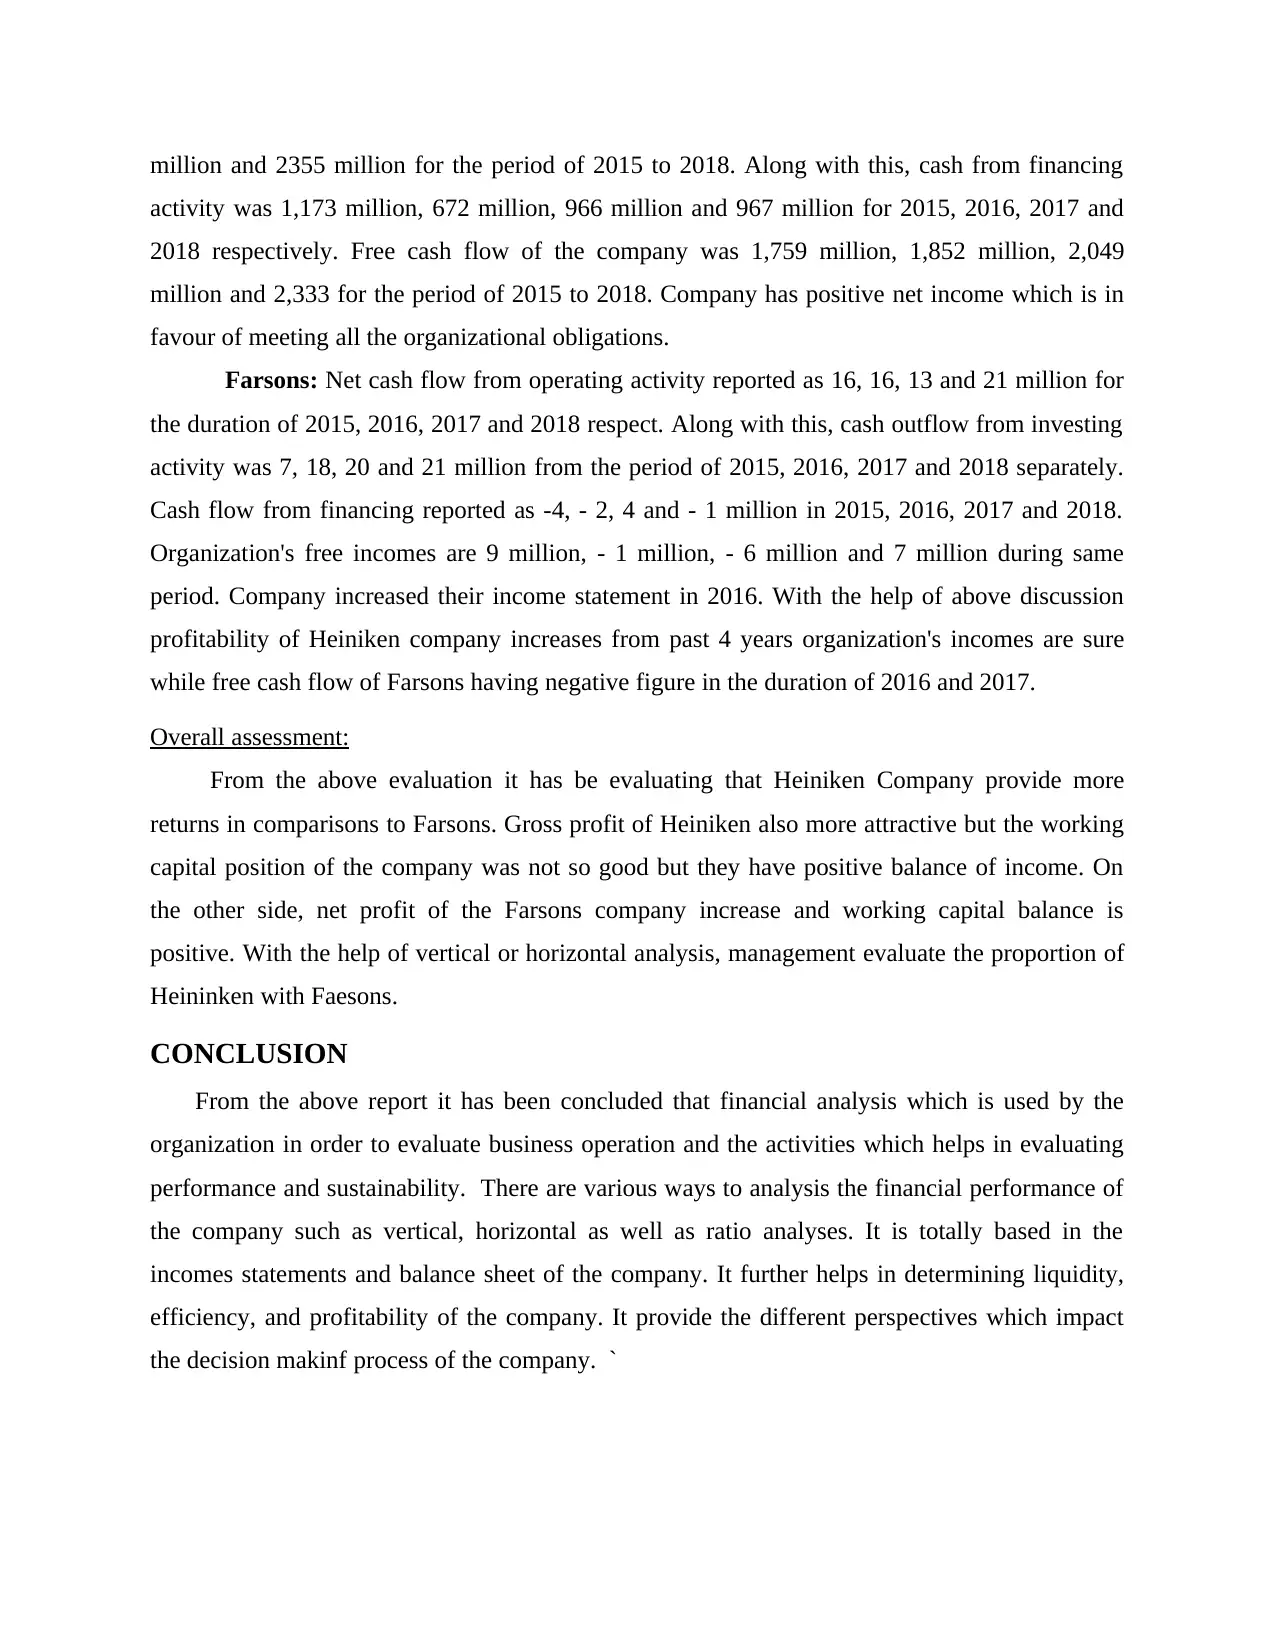
million and 2355 million for the period of 2015 to 2018. Along with this, cash from financing
activity was 1,173 million, 672 million, 966 million and 967 million for 2015, 2016, 2017 and
2018 respectively. Free cash flow of the company was 1,759 million, 1,852 million, 2,049
million and 2,333 for the period of 2015 to 2018. Company has positive net income which is in
favour of meeting all the organizational obligations.
Farsons: Net cash flow from operating activity reported as 16, 16, 13 and 21 million for
the duration of 2015, 2016, 2017 and 2018 respect. Along with this, cash outflow from investing
activity was 7, 18, 20 and 21 million from the period of 2015, 2016, 2017 and 2018 separately.
Cash flow from financing reported as -4, - 2, 4 and - 1 million in 2015, 2016, 2017 and 2018.
Organization's free incomes are 9 million, - 1 million, - 6 million and 7 million during same
period. Company increased their income statement in 2016. With the help of above discussion
profitability of Heiniken company increases from past 4 years organization's incomes are sure
while free cash flow of Farsons having negative figure in the duration of 2016 and 2017.
Overall assessment:
From the above evaluation it has be evaluating that Heiniken Company provide more
returns in comparisons to Farsons. Gross profit of Heiniken also more attractive but the working
capital position of the company was not so good but they have positive balance of income. On
the other side, net profit of the Farsons company increase and working capital balance is
positive. With the help of vertical or horizontal analysis, management evaluate the proportion of
Heininken with Faesons.
CONCLUSION
From the above report it has been concluded that financial analysis which is used by the
organization in order to evaluate business operation and the activities which helps in evaluating
performance and sustainability. There are various ways to analysis the financial performance of
the company such as vertical, horizontal as well as ratio analyses. It is totally based in the
incomes statements and balance sheet of the company. It further helps in determining liquidity,
efficiency, and profitability of the company. It provide the different perspectives which impact
the decision makinf process of the company. `
REFERENCES
Books and Journals:
Blum, P. and Dacorogna, M., 2014. DFA‐Dynamic Financial Analysis. Wiley StatsRef: Statistics
Reference Online.
Bragg, S. M., 2012. Financial Analysis.: A Controller's Guide. John Wiley & Sons.
Cucchiella, F., D’Adamo, I. and Gastaldi, M., 2015. Financial analysis for investment and policy
decisions in the renewable energy sector. Clean Technologies and Environmental
Policy. 17(4). pp.887-904.
El Kasmioui, O. and Ceulemans, R., 2012. Financial analysis of the cultivation of poplar and
willow for bioenergy. Biomass and bioenergy. 43. pp.52-64.
García, J. G., Martínez-Cutillas, A. and Romero, P., 2012. Financial analysis of wine grape
production using regulated deficit irrigation and partial-root zone drying
strategies. Irrigation Science. 30(3). pp.179-188.
Isberg, S. and Pitta, D., 2013. Using financial analysis to assess brand equity. Journal of Product
& Brand Management. 22(1). pp.65-78.
Palepu, K. G. and Healy, P. M., 2013. Business analysis and valuation: Using financial
statements, text and cases.
Post, C. and Byron, K., 2015. Women on boards and firm financial performance: A meta-
analysis. Academy of Management Journal. 58(5), pp.1546-1571.
Sheikhi, A., Ranjbar, A. M. and Oraee, H., 2012. Financial analysis and optimal size and
operation for a multicarrier energy system. Energy and buildings. 48. pp.71-78.
Vogel, H. L., 2014. Entertainment industry economics: A guide for financial analysis.
Cambridge University Press.
Williams, E. E. and Dobelman, J. A., 2017. Financial statement analysis. World Scientific Book
Chapters, pp.109-169.
Online:
Annual Report of Farsons, 2019. [Online]. Available through:
<https://www.farsons.com/en/financial-statements-archive>
Annual Report of Heiniken, 2019. [Online]. Available through:
<https://www.theheinekencompany.com/Age-gate.aspx?returnurl=%2f>
⊘ This is a preview!⊘
Do you want full access?
Subscribe today to unlock all pages.
Trusted by 1+ million students worldwide
1 out of 33
Related Documents


Your All-in-One AI-Powered Toolkit for Academic Success.
+13062052269
info@desklib.com
Available 24*7 on WhatsApp / Email
![[object Object]](/_next/static/media/star-bottom.7253800d.svg)
Unlock your academic potential
Copyright © 2020–2026 A2Z Services. All Rights Reserved. Developed and managed by ZUCOL.