Financial Analysis and Performance Comparison: Farsons vs. Heiniken
VerifiedAdded on 2023/01/18
|20
|4806
|32
Report
AI Summary
This report presents a detailed financial analysis comparing Farsons and Heiniken, two companies in the beer manufacturing industry. The analysis includes a comprehensive examination of profitability ratios, such as operating profit margin, net profit margin, return on assets (ROA), and return on equity (ROE), to assess their financial performance. Leverage ratios like the debt-equity ratio and debt-assets ratio are evaluated to understand their financial risk and capital structure. Liquidity ratios, including the current ratio and quick ratio, are assessed to determine their ability to meet short-term obligations. Efficiency ratios, such as receivable turnover, payable turnover, asset turnover, and inventory days, are analyzed to gauge their operational efficiency. The report also includes an analysis of working capital and annual cash flow for both companies, along with vertical and horizontal analysis for both companies to provide a more comprehensive financial overview. The findings highlight the strengths and weaknesses of each company, offering insights into their financial health and performance trends.

Financial Analysis Management &
Enterprise - FAME
Enterprise - FAME
Paraphrase This Document
Need a fresh take? Get an instant paraphrase of this document with our AI Paraphraser
Table of Contents
INTRODUCTION...........................................................................................................................3
MAIN BODY...................................................................................................................................3
1. Presentation of the detailed analysis in the financial performance between the two
companies....................................................................................................................................3
2. Importance of analysing working capital -..............................................................................8
3. Analysis of annual cash flow of both the companies...............................................................9
CONCLUSION..............................................................................................................................11
REFERENCES..............................................................................................................................12
APPENDIXE.................................................................................................................................13
INTRODUCTION
Financial analysis helps the company to have the major impacts in masking the effective
decision-making in the organization. There are various level of ways which will help in proper
analysing the business situation of company in more effective way for particular level of
development. For the comparison two firm which have been chosen to have the proper analysis.
The companies are Farsons and Heiniken as both are beer manufacture company as the level of
competitor firm. Farsons is a Maltese food and beverage conglomerate. The businesses of the
Farsons Group include brewing, production, sale and distribution of beers. On the other hand is
a pale lager beer with 5% alcohol by volume produced by the Dutch brewing company Heiniken
International. Heiniken beer is sold in a green bottle with a red star.
MAIN BODY
1. Presentation of the detailed analysis in the financial performance between the two companies.
Profitability ratio
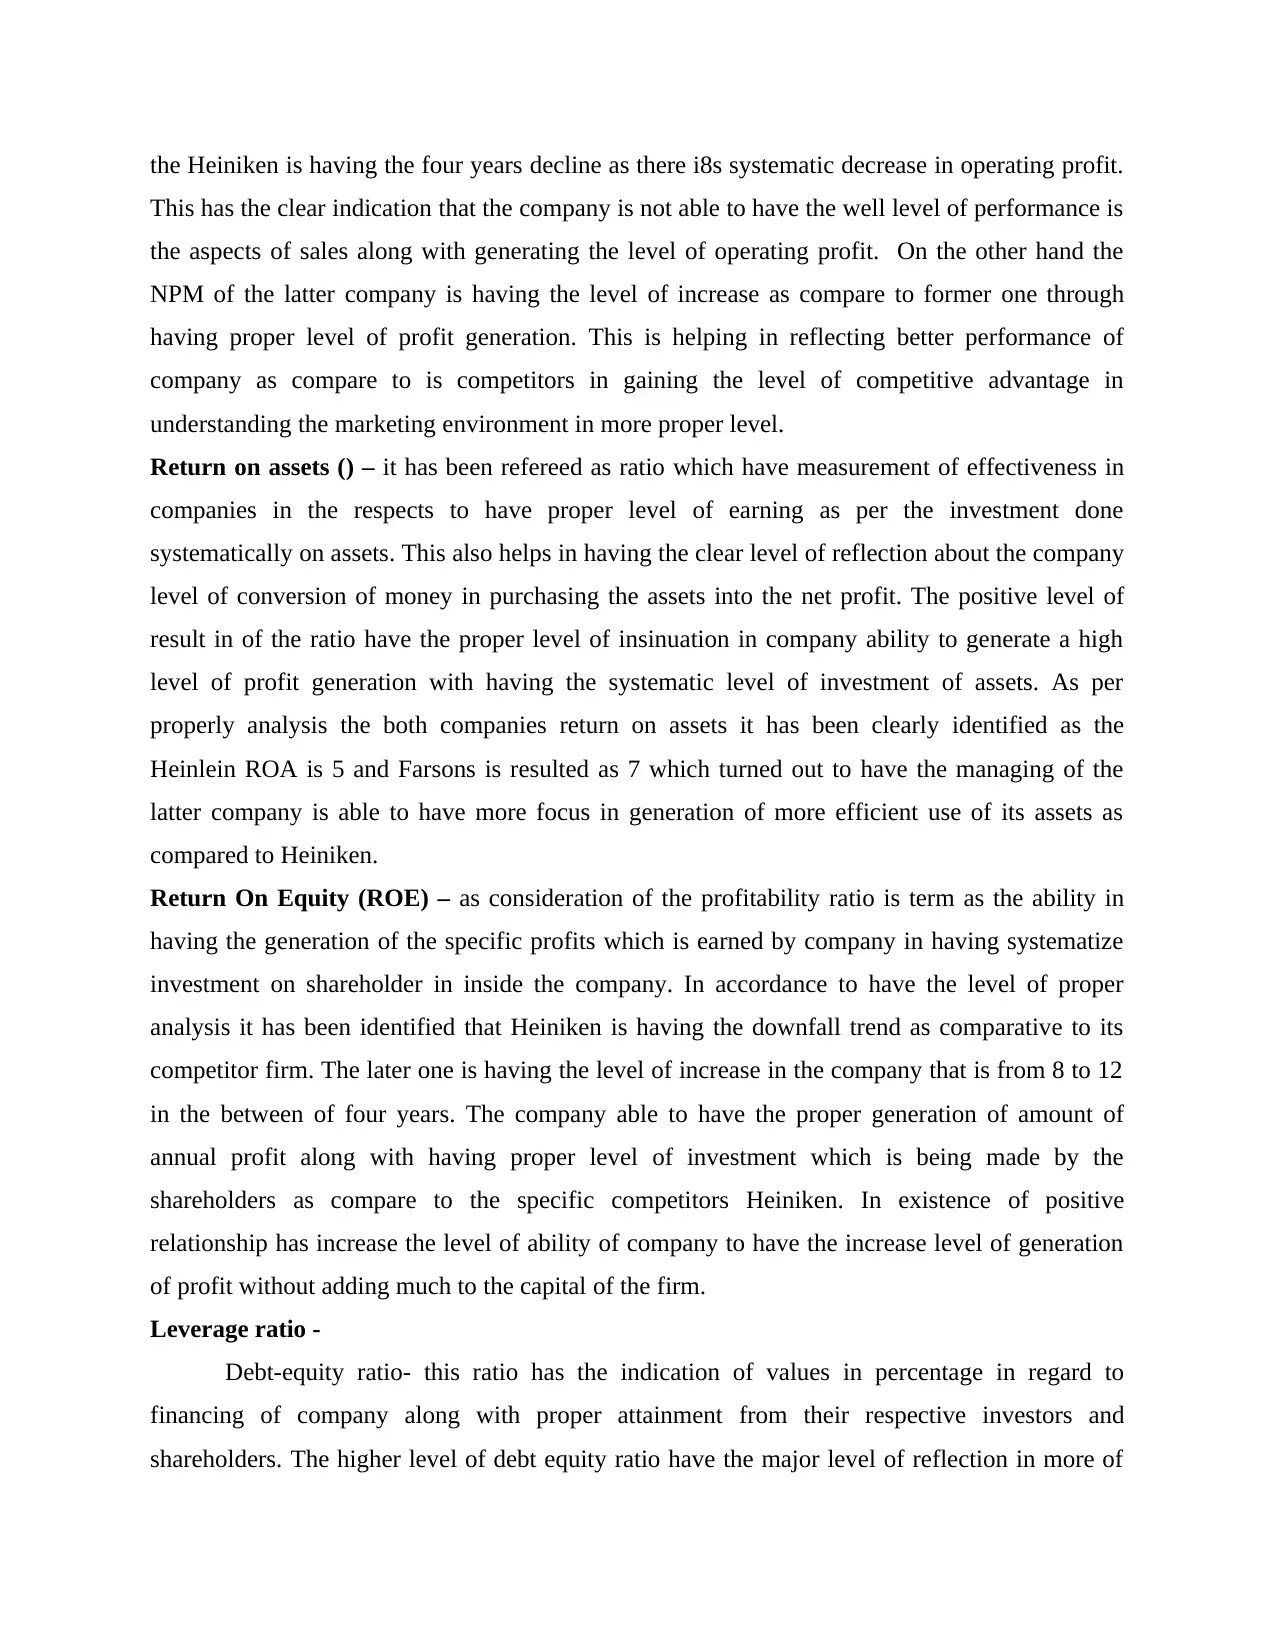
Operating profit margin- the operating profit ratio have the clear indication regarding
the profits which is earned by company after meeting all the level of cost such as raw material
and wages of labour etc. the company has been type of profitably ratio which have the depiction
of efficiency as per firm in keeping control in the cost and expenses which have been attached in
business operation development. The higher level of margining in operation profit have the
reselection of the better level of performance in an enterprise in the systematic accounting
period. The ratio analysis of company Heiniken has seen that operating margin is having the
steep level of declining as comparative to the competitor firm arson in the level of increasing
trend. This has the clear indication that the latter company have the more level of efficiency in
order to meet in operation expenses as the former one. The companies are considered to be more
effective which is somewhere having the major level of contribution in development of company
in more appropriate manner.
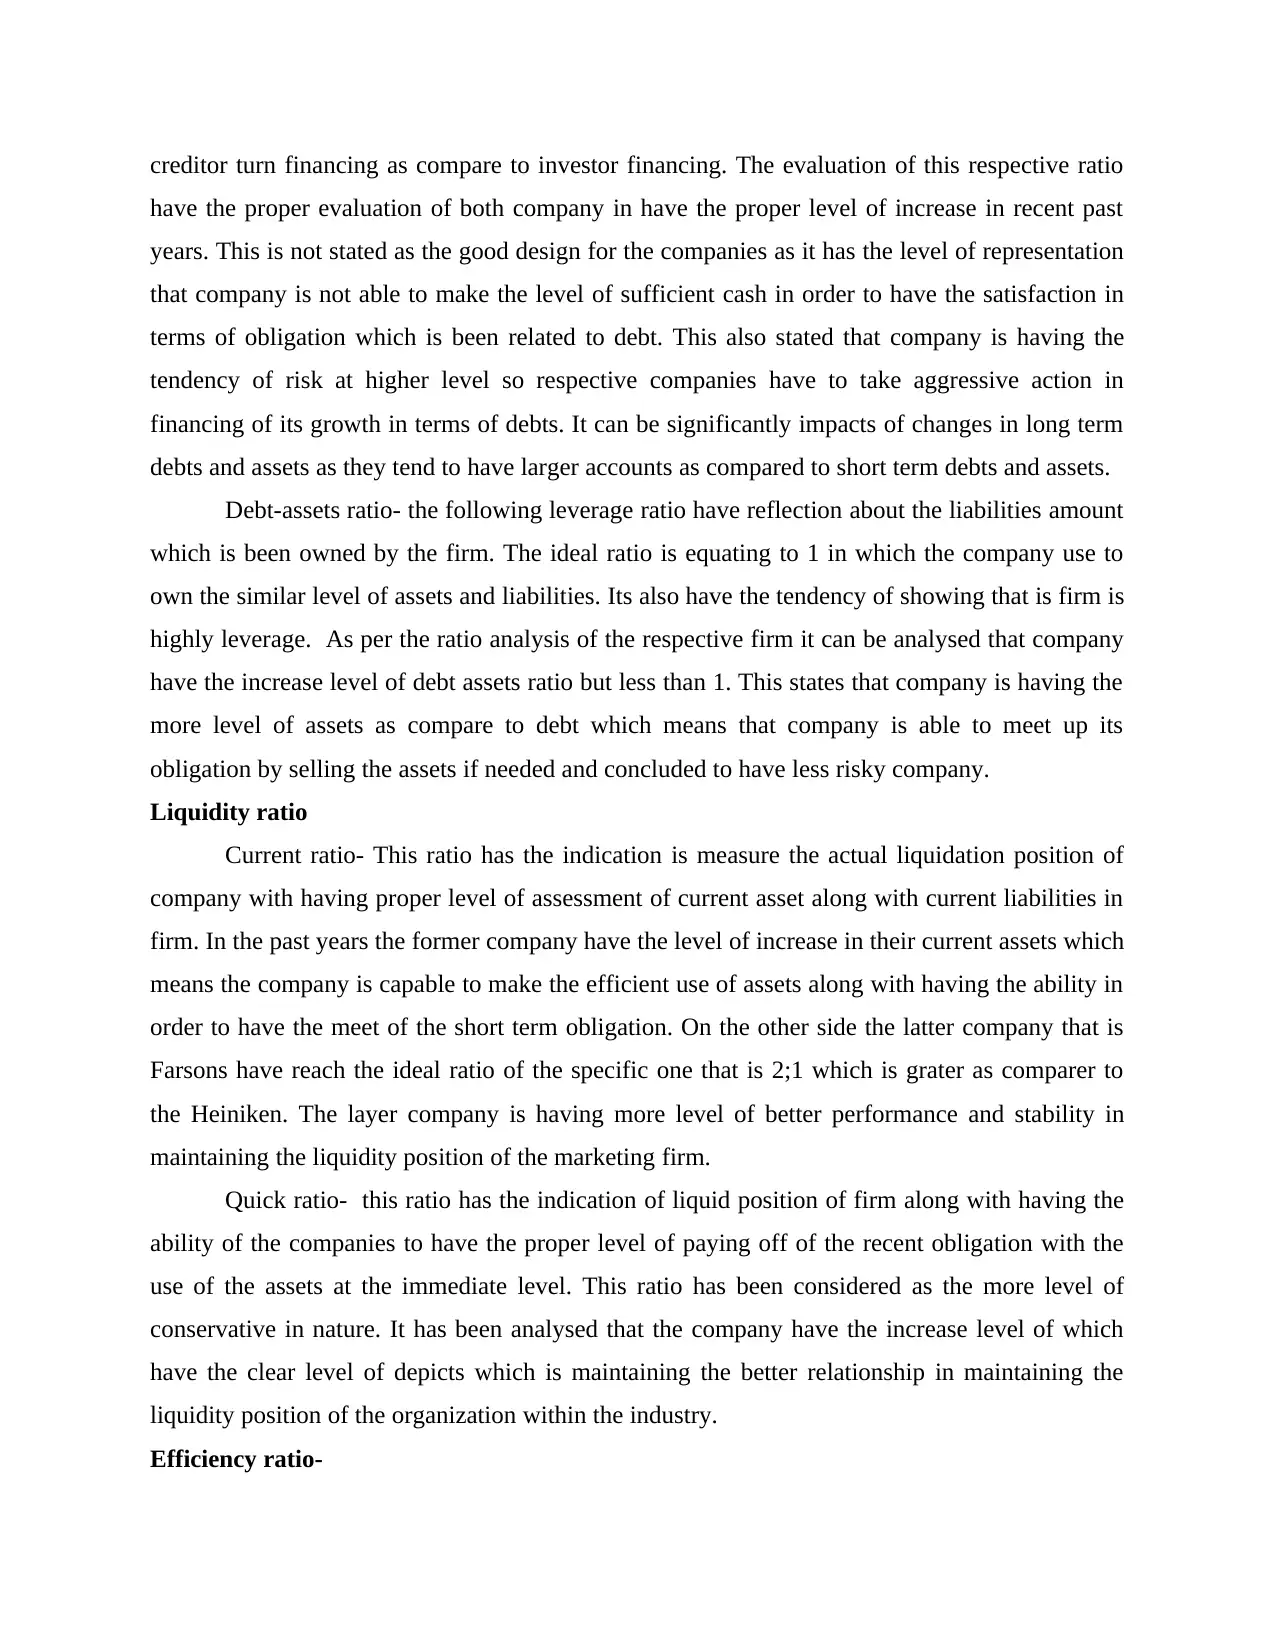
Net profit margin- The profitability ratio have the proper level of indication which are in
level of sales proportion of the systematic sales revenue which can be converted into the net
profit. The ratio has been analysed as the measure of key performance in the profitability of firm.
The increase higher level of profit margin makes the company more effective along with
efficiency in range of conversing the sales into net profit. As per the result of the analysed that
Financial analysis helps the company to have the major impacts in masking the effective
decision-making in the organization. There are various level of ways which will help in proper
analysing the business situation of company in more effective way for particular level of
development. For the comparison two firm which have been chosen to have the proper analysis.
The companies are Farsons and Heiniken as both are beer manufacture company as the level of
competitor firm. Farsons is a Maltese food and beverage conglomerate. The businesses of the
Farsons Group include brewing, production, sale and distribution of beers. On the other hand is
a pale lager beer with 5% alcohol by volume produced by the Dutch brewing company Heiniken
International. Heiniken beer is sold in a green bottle with a red star.
MAIN BODY
1. Presentation of the detailed analysis in the financial performance between the two companies.
Profitability ratio
Operating profit margin- the operating profit ratio have the clear indication regarding
the profits which is earned by company after meeting all the level of cost such as raw material
and wages of labour etc. the company has been type of profitably ratio which have the depiction
of efficiency as per firm in keeping control in the cost and expenses which have been attached in
business operation development. The higher level of margining in operation profit have the
reselection of the better level of performance in an enterprise in the systematic accounting
period. The ratio analysis of company Heiniken has seen that operating margin is having the
steep level of declining as comparative to the competitor firm arson in the level of increasing
trend. This has the clear indication that the latter company have the more level of efficiency in
order to meet in operation expenses as the former one. The companies are considered to be more
effective which is somewhere having the major level of contribution in development of company
in more appropriate manner.
Net profit margin- The profitability ratio have the proper level of indication which are in
level of sales proportion of the systematic sales revenue which can be converted into the net
profit. The ratio has been analysed as the measure of key performance in the profitability of firm.
The increase higher level of profit margin makes the company more effective along with
efficiency in range of conversing the sales into net profit. As per the result of the analysed that
⊘ This is a preview!⊘
Do you want full access?
Subscribe today to unlock all pages.
Trusted by 1+ million students worldwide
the Heiniken is having the four years decline as there i8s systematic decrease in operating profit.
This has the clear indication that the company is not able to have the well level of performance is
the aspects of sales along with generating the level of operating profit. On the other hand the
NPM of the latter company is having the level of increase as compare to former one through
having proper level of profit generation. This is helping in reflecting better performance of
company as compare to is competitors in gaining the level of competitive advantage in
understanding the marketing environment in more proper level.
Return on assets () – it has been refereed as ratio which have measurement of effectiveness in
companies in the respects to have proper level of earning as per the investment done
systematically on assets. This also helps in having the clear level of reflection about the company
level of conversion of money in purchasing the assets into the net profit. The positive level of
result in of the ratio have the proper level of insinuation in company ability to generate a high
level of profit generation with having the systematic level of investment of assets. As per
properly analysis the both companies return on assets it has been clearly identified as the
Heinlein ROA is 5 and Farsons is resulted as 7 which turned out to have the managing of the
latter company is able to have more focus in generation of more efficient use of its assets as
compared to Heiniken.
Return On Equity (ROE) – as consideration of the profitability ratio is term as the ability in
having the generation of the specific profits which is earned by company in having systematize
investment on shareholder in inside the company. In accordance to have the level of proper
analysis it has been identified that Heiniken is having the downfall trend as comparative to its
competitor firm. The later one is having the level of increase in the company that is from 8 to 12
in the between of four years. The company able to have the proper generation of amount of
annual profit along with having proper level of investment which is being made by the
shareholders as compare to the specific competitors Heiniken. In existence of positive
relationship has increase the level of ability of company to have the increase level of generation
of profit without adding much to the capital of the firm.
Leverage ratio -
Debt-equity ratio- this ratio has the indication of values in percentage in regard to
financing of company along with proper attainment from their respective investors and
shareholders. The higher level of debt equity ratio have the major level of reflection in more of
Paraphrase This Document
Need a fresh take? Get an instant paraphrase of this document with our AI Paraphraser
creditor turn financing as compare to investor financing. The evaluation of this respective ratio
have the proper evaluation of both company in have the proper level of increase in recent past
years. This is not stated as the good design for the companies as it has the level of representation
that company is not able to make the level of sufficient cash in order to have the satisfaction in
terms of obligation which is been related to debt. This also stated that company is having the
tendency of risk at higher level so respective companies have to take aggressive action in
financing of its growth in terms of debts. It can be significantly impacts of changes in long term
debts and assets as they tend to have larger accounts as compared to short term debts and assets.
Debt-assets ratio- the following leverage ratio have reflection about the liabilities amount
which is been owned by the firm. The ideal ratio is equating to 1 in which the company use to
own the similar level of assets and liabilities. Its also have the tendency of showing that is firm is
highly leverage. As per the ratio analysis of the respective firm it can be analysed that company
have the increase level of debt assets ratio but less than 1. This states that company is having the
more level of assets as compare to debt which means that company is able to meet up its
obligation by selling the assets if needed and concluded to have less risky company.
Liquidity ratio
Current ratio- This ratio has the indication is measure the actual liquidation position of
company with having proper level of assessment of current asset along with current liabilities in
firm. In the past years the former company have the level of increase in their current assets which
means the company is capable to make the efficient use of assets along with having the ability in
order to have the meet of the short term obligation. On the other side the latter company that is
Farsons have reach the ideal ratio of the specific one that is 2;1 which is grater as comparer to
the Heiniken. The layer company is having more level of better performance and stability in
maintaining the liquidity position of the marketing firm.
Quick ratio- this ratio has the indication of liquid position of firm along with having the
ability of the companies to have the proper level of paying off of the recent obligation with the
use of the assets at the immediate level. This ratio has been considered as the more level of
conservative in nature. It has been analysed that the company have the increase level of which
have the clear level of depicts which is maintaining the better relationship in maintaining the
liquidity position of the organization within the industry.
Efficiency ratio-
Receivable turnover- the ratio have the indication in collection process in company to
have assurance the large numbers of customer quality pay-off along with debt settlement in quick
basis. The high level of receivable turnover have clear indication which have reflection that t5he
company have the more basis in cash basis rather than having the credit basis. From the above
figure it can be clearly evaluated that the company Farsons is having the higher level of turnover
of receivable as compare to the Heiniken. This result that company is having the higher level of
efficiency. The company is able to have the high proportion of the quality customers who are
pausing the debt in quicker manner. This also have the indication that the company us bale to
have the clear level of operation's of the cash basis.
Payable turnover which have ratio which shows the creditors the level of liquidity along
with credit wordiness of the company. The huge level of reflection have the promptness that the
payment can be made in purchasing the level of supplier in credit. The companies are having the
level of stable ratio which shows that there are makes of the payment on correct times without
taking the long period.
Asset turnover- the ratio have the application in generating the level of assets which are
higher in nature. This situation has been considered as the favourable one which is due to more
and efficient level of use of assets. In the proper level of ration analysis it has been analysed that
both companies are non-performing well. This is also helped the company in order to have rise in
producing sales along with meeting up target.
Inventory days- this has the indication of the fast moving inventories which is resultant as
the high ratio along with slow moving will result as the obsolete level of inventory. In analysis, it
can be interpreted that the both companies are high which means that there is more level of stock
which is moving as there is no existence of extra inventory in company.
Shareholders ratio
Shareholders equity ratio-it is the financial ratio which have the indication in level of
proportional with is relative to equity which is considered as the major element on financing the
companies. The companies' shareholder ratio is stable over the years which means better
financial state of an entity.
Vertical analysis of Farsons
⊘ This is a preview!⊘
Do you want full access?
Subscribe today to unlock all pages.
Trusted by 1+ million students worldwide
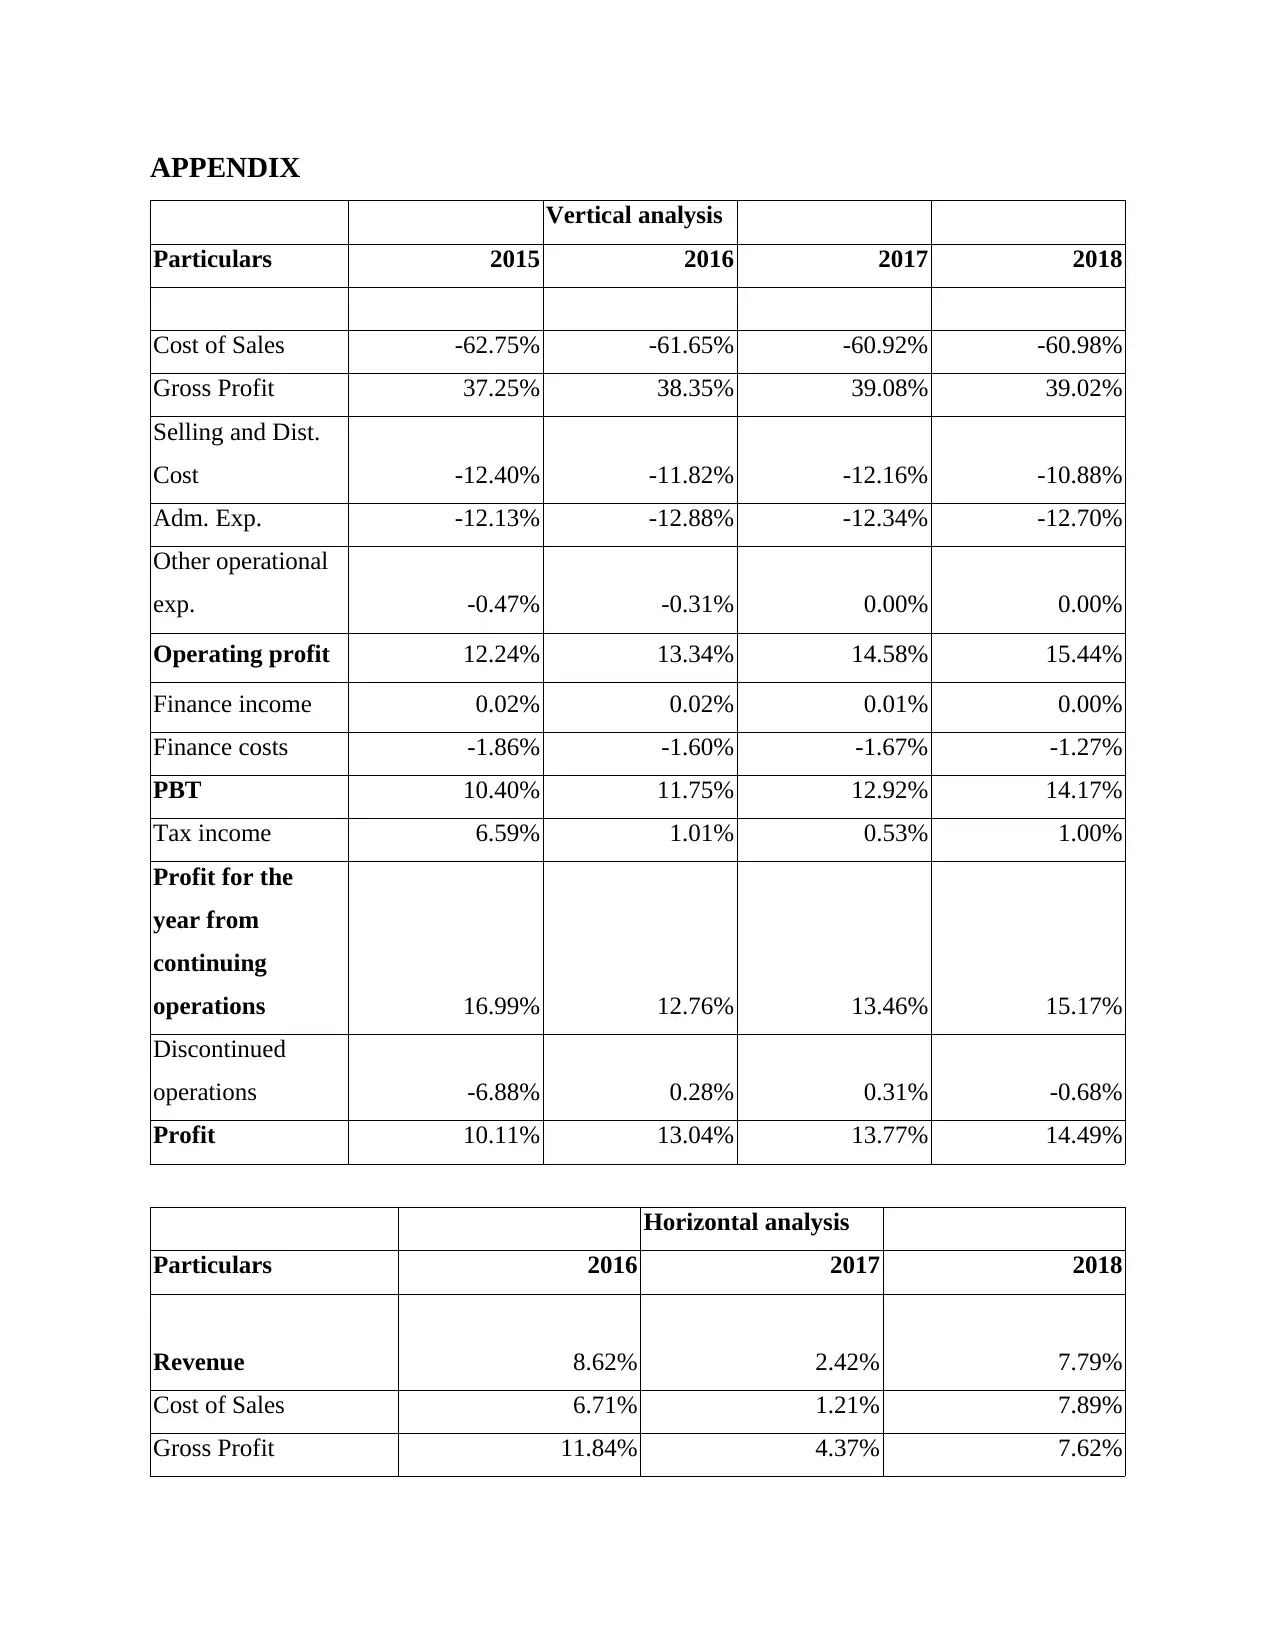
For the vertical analysis it can be concluded that the company is not able to have the there is the
increased level of profit from the year 2015 to years 2018. That is the company have almost 5%
increase in level of profit as compare to is the previous years.
Horizontal analysis of Farsons.
In the horizontal analysis it has been concluded that the company has reduced to the level in
making the profit in the last years . The company has almost below less than 50% as compared to
the base years in make the level of profit.
Horizontal analysis of Heiniken
On the basis of the horizontals' analysis it can be analysed the as competitive to the base year
2015 the company have maximum reduction in years 2016 and the years 2018.
Vertical analysis of Heiniken
The vertical analysis of the company states that the profitability of company doesn't have the
belongingness to any ODF the specific trends. But is has been evaluated all around the 10% in
last four years. But in last year 2018 it has been reduced as the steep level.
2. Importance of analysing working capital -
Working capital :
The working capital has been considered as the calculation of variance between the
current assess the company and the current liabilities. The current assets re such as the s accounts
receivable, cash and current outstanding expenses, accounts payable etc. the company have the
consideration of the different types of working capital which are considered as the temporary and
permanent, gross and net working capital etc . For instance, it can be considered as company has
the portion which is debt within the time period of one year. The working capital have the
consideration of resultants of various level of activities such as the debt management, payment to
creditors etc. on the further level the analysis of working capital as can be defined as the analysis
which is helping in having proper level of determination in sufficiency and liquidity as compared
current assets to current liabilities.
Farsons
The analysis of the both the companies is considered as important part before taking any
level of decision. There should be proper evaluation of the working capital by Farsons before
taking any level of particular decision as it helps in examiner the timeline of the current
liabilities. The information helps in gaining the level of capitals which helps the company to
Paraphrase This Document
Need a fresh take? Get an instant paraphrase of this document with our AI Paraphraser
have the proper level of determination with in the level of currents availabilities which will have
the acquirement of the funds on term basis which is performed in aversion types of the
organization. The company will be able to make the plan to shift additional cash into long term
investment vehicles. This will help the company in longer term in taking the decision and
consideration ODF all aspects which will have the maximization operation. This will have the
lead to the maintenance of the level of operation which are smooth in nature a support the
company in order to have the level of improbability and crabbing as well. The company will be
ensured by effectiveness in managing proper level if accounts payables and management of
stock.
Heiniken
The company can have the use of the account payable repost to have the proper division of
the variant accounts payable into the next 30 days bucket in having the proper level of evaluation
of the liquidity available with company. On the other hand on further level the payment timings
of remaining liabilities which will be highly dependable in analysis of working capital in which
there will be clear indication related to payment of outstanding obligation. The company will be
able to make the proper variability and analysis of debtors. This will helps in ageing the accounts
receivable report and also with the help of short term-time buckets. There will be consideration
of revisitation of clients which is having the consideration of paying and amount due date which
will have involvement of correct assessment in potential incoming and cash flows. The
e4ffcetive system of the working capital make the analysis to determine and evaluate areas that
require attention in order to maintain profitability and liquidity. This will not only help company
to meet out financial obligations but also assist the management to improve the earnings of the
business.
3. Analysis of annual cash flow of both the companies.
Definitions -
Cash flow margin ratio is helps in measuring the operating objectivities in percentage of the
generalized revenue from the given sales.
Cash flow coverage ratio it helps in indicating the firm capacity's which is paying the amount of
the principal along with interest around the due date.
Current liabilities' coverage ratio it helps in measuring the level of realizing between the level
of generalizing cash from the current liabilities of the company.
Farsons Heniken
Particulars Formula 2017 2018 2017 2018
Cash flow from operations 15513 22933 4924 5540
Sales 88119 94980 21888 26811
Total debt 59670 66896 26513 26416
Current liabilities 24297 32444 10458 10450
Cash flow margin ratio
Cash flow from
operations/Net sales
0.1760460
287
0.241450
8318
0.22496345
03
0.2066
316064
Cash flow coverage ratio
Cash flow from
operations/Total
debt
0.2599798
894
0.342815
7139
0.18572021
27
0.2097
21381
Current liabilities' coverage
ratio
Cash flow from
operations/Current
liabilities
0.6384738
857
0.706848
724
0.47083572
38
0.5301
435407
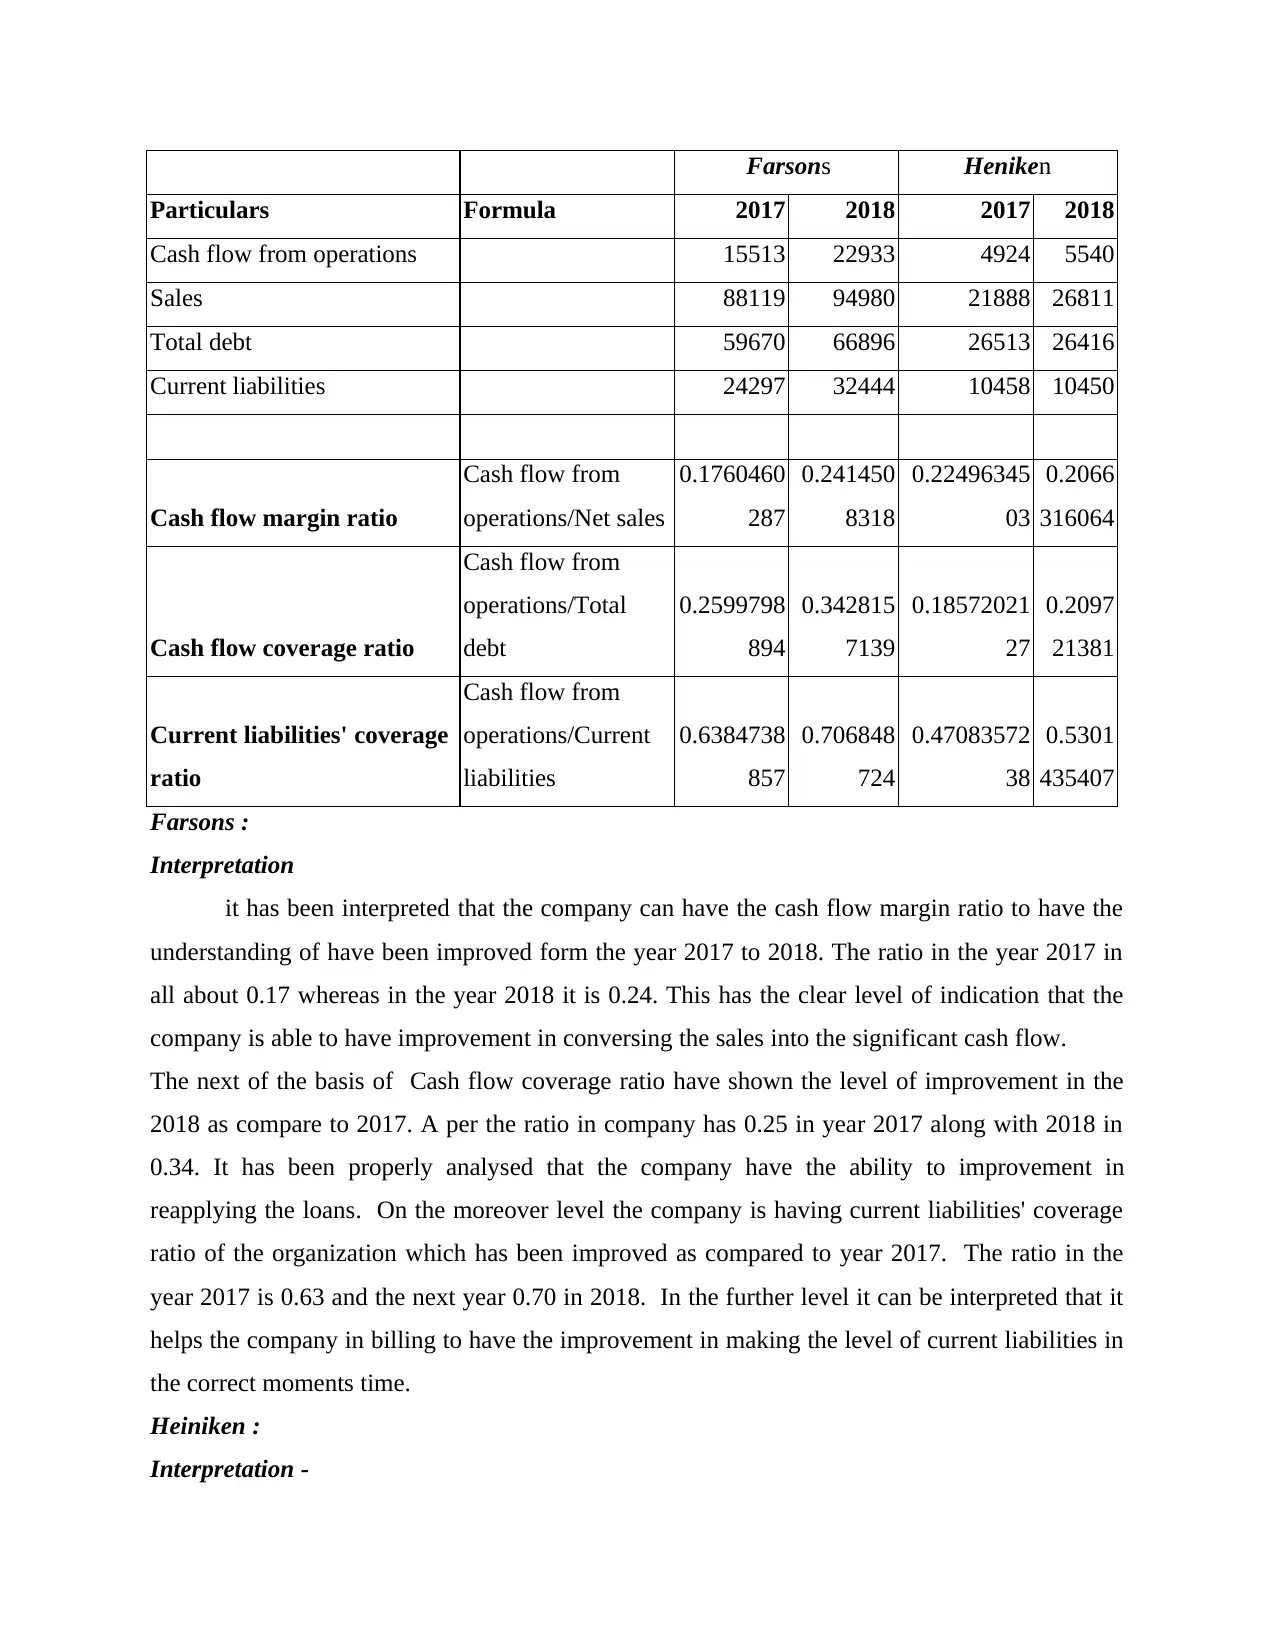
Farsons :
Interpretation
it has been interpreted that the company can have the cash flow margin ratio to have the
understanding of have been improved form the year 2017 to 2018. The ratio in the year 2017 in
all about 0.17 whereas in the year 2018 it is 0.24. This has the clear level of indication that the
company is able to have improvement in conversing the sales into the significant cash flow.
The next of the basis of Cash flow coverage ratio have shown the level of improvement in the
2018 as compare to 2017. A per the ratio in company has 0.25 in year 2017 along with 2018 in
0.34. It has been properly analysed that the company have the ability to improvement in
reapplying the loans. On the moreover level the company is having current liabilities' coverage
ratio of the organization which has been improved as compared to year 2017. The ratio in the
year 2017 is 0.63 and the next year 0.70 in 2018. In the further level it can be interpreted that it
helps the company in billing to have the improvement in making the level of current liabilities in
the correct moments time.
Heiniken :
Interpretation -
Particulars Formula 2017 2018 2017 2018
Cash flow from operations 15513 22933 4924 5540
Sales 88119 94980 21888 26811
Total debt 59670 66896 26513 26416
Current liabilities 24297 32444 10458 10450
Cash flow margin ratio
Cash flow from
operations/Net sales
0.1760460
287
0.241450
8318
0.22496345
03
0.2066
316064
Cash flow coverage ratio
Cash flow from
operations/Total
debt
0.2599798
894
0.342815
7139
0.18572021
27
0.2097
21381
Current liabilities' coverage
ratio
Cash flow from
operations/Current
liabilities
0.6384738
857
0.706848
724
0.47083572
38
0.5301
435407
Farsons :
Interpretation
it has been interpreted that the company can have the cash flow margin ratio to have the
understanding of have been improved form the year 2017 to 2018. The ratio in the year 2017 in
all about 0.17 whereas in the year 2018 it is 0.24. This has the clear level of indication that the
company is able to have improvement in conversing the sales into the significant cash flow.
The next of the basis of Cash flow coverage ratio have shown the level of improvement in the
2018 as compare to 2017. A per the ratio in company has 0.25 in year 2017 along with 2018 in
0.34. It has been properly analysed that the company have the ability to improvement in
reapplying the loans. On the moreover level the company is having current liabilities' coverage
ratio of the organization which has been improved as compared to year 2017. The ratio in the
year 2017 is 0.63 and the next year 0.70 in 2018. In the further level it can be interpreted that it
helps the company in billing to have the improvement in making the level of current liabilities in
the correct moments time.
Heiniken :
Interpretation -
⊘ This is a preview!⊘
Do you want full access?
Subscribe today to unlock all pages.
Trusted by 1+ million students worldwide
It has been analysed that the cash flow margining have the reduced the form year 2017 to
year 2018. The company have the decreased point 0.20 in year 2018 as compare to 2017. This
has had the clear indication that companies has reduced capabilities which is converting the sales
amount into cash inflow.
Moreover, there us the conclusion that the cash flow coverage ratio has been increased in
year 2017 as per yer2018. In year 2017, the ratio was 0.18 as compared to year 2017 in which the
cash flow coverage ratio was 0.20.
On the further level the current liabilities' coverage ratio of Heiniken have been found at
increasing level in the year 2018 as compared to the vales of the year 2017. In the year 2017 the
ratio was .40 as on the other hand ratio has increased up-to 0.53 in 2018. Form this it can be
concluded that the company is able to produce the sufficient level of cash flow in paying the
outstanding level of liabilities to the various parties.
CONCLUSION
From the repost it can be concluded that the various ratio vertical and horizontal analysis
has help in making the proper level of understanding in make the level of interpretation in proper
decision-making of the business. The company Farsons as be compared to be more effective as
to its competitors. The working capital has been considered as the calculation of variance
between the current assess the company and the current liabilities. The company have the
consideration of the different types of working capital which are considered as the temporary and
permanent, gross and net working capital. On the other hand the analysis of the both companies
in making the proper level of interpretation to have the proper development of the prorogation in
having the level of understanding in different business aspects.
Paraphrase This Document
Need a fresh take? Get an instant paraphrase of this document with our AI Paraphraser
REFERENCES
Ağca, Ş. and Mozumdar, A., 2017. Investment–Cash Flow Sensitivity: Fact or Fiction?. Journal
of Financial and Quantitative Analysis, 52(3), pp.1111-1141.
Aktas, N., Croci, E. and Petmezas, D., 2015. Is working capital management value-enhancing?
Evidence from firm performance and investments. Journal of Corporate Finance, 30,
pp.98-113.
Baldacchino, P.J., Vella, C. and Grima, S., 2019. The Corporate Governance Code and
Compliance by Maltese Listed Companies. International Journal of Economics &
Business Administration (IJEBA), 7(2), pp.71-90.
Billiard, E., 2016. Lost in tradition: an attempt to go beyond labels, taking Maltese food practices
as a primary example. In Eating Traditional Food (pp. 62-80). Routledge.
Camin, F., Bontempo, L., Perini, M. and Piasentier, E., 2016. Stable isotope ratio analysis for
assessing the authenticity of food of animal origin. Comprehensive Reviews in Food
Science and Food Safety, 15(5), pp.868-877.
Campbell, D., 2015. Investigating the need for an EAP: a case study (Bachelor's thesis,
University of Malta).
Hatanaka, M., Yokoyama, Y., Ogawa, N.O., Miyairi, Y., Clark, G. and Ohkouchi, N., 2017.
Paleodiet study based on isotopic ratio analysis of bone collagen from Malagasy extinct
species.
Lewellen, J. and Lewellen, K., 2016. Investment and cash flow: New evidence. Journal of
Financial and Quantitative Analysis, 51(4), pp.1135-1164.
Mathuva, D., 2015. The Influence of working capital management components on corporate
profitability.
Pais, M.A. and Gama, P.M., 2015. Working capital management and SMEs profitability:
Portuguese evidence. International Journal of Managerial Finance, 11(3), pp.341-358.
Petruzzo, P., Gazarian, A., Kanitakis, J., Parmentier, H., Guigal, V., Guillot, M., Vial, C.,
Dubernard, J.M., Morelon, E. and Badet, L., 2015. Outcomes after bilateral hand
allotransplantation: a risk/benefit ratio analysis. Annals of surgery, 261(1), pp.213-220.
Robinson, D.T. and Sensoy, B.A., 2016. Cyclicality, performance measurement, and cash flow
liquidity in private equity. Journal of Financial Economics, 122(3), pp.521-543.
Short, C.A., 2017. The Recovery of Natural Environments in Architecture: Air, Comfort and
Climate. Routledge.
Weber, M., 2018. Cash flow duration and the term structure of equity returns. Journal of
Financial Economics, 128(3), pp.486-503.
APPENDIX
Vertical analysis
Particulars 2015 2016 2017 2018
Cost of Sales -62.75% -61.65% -60.92% -60.98%
Gross Profit 37.25% 38.35% 39.08% 39.02%
Selling and Dist.
Cost -12.40% -11.82% -12.16% -10.88%
Adm. Exp. -12.13% -12.88% -12.34% -12.70%
Other operational
exp. -0.47% -0.31% 0.00% 0.00%
Operating profit 12.24% 13.34% 14.58% 15.44%
Finance income 0.02% 0.02% 0.01% 0.00%
Finance costs -1.86% -1.60% -1.67% -1.27%
PBT 10.40% 11.75% 12.92% 14.17%
Tax income 6.59% 1.01% 0.53% 1.00%
Profit for the
year from
continuing
operations 16.99% 12.76% 13.46% 15.17%
Discontinued
operations -6.88% 0.28% 0.31% -0.68%
Profit 10.11% 13.04% 13.77% 14.49%
Horizontal analysis
Particulars 2016 2017 2018
Revenue 8.62% 2.42% 7.79%
Cost of Sales 6.71% 1.21% 7.89%
Gross Profit 11.84% 4.37% 7.62%
⊘ This is a preview!⊘
Do you want full access?
Subscribe today to unlock all pages.
Trusted by 1+ million students worldwide
1 out of 20
Related Documents


Your All-in-One AI-Powered Toolkit for Academic Success.
+13062052269
info@desklib.com
Available 24*7 on WhatsApp / Email
![[object Object]](/_next/static/media/star-bottom.7253800d.svg)
Unlock your academic potential
Copyright © 2020–2026 A2Z Services. All Rights Reserved. Developed and managed by ZUCOL.