University Assignment: MGT5PSC Fast Good Supply Chain Report
VerifiedAdded on 2022/08/22
|15
|2935
|12
Report
AI Summary
This report provides a comprehensive analysis of Fast Good's supply chain, focusing on challenges and proposing solutions. It begins with an executive summary and an introduction that highlights the company's operational drawbacks in managing its distribution chain in Southeast Asia. The report then delves into a review of the case study, exploring how a supply chain map can enable effective decision-making by analyzing distributor, factory, and customer locations, demand densities, and routing options. It further includes a moving average forecast for demand prediction and calculates the economic order quantity (EOQ) to optimize inventory management, discussing the advantages and disadvantages of ordering above or below the EOQ. The report also reviews how HP visualizes its supply chain using geographic analytics, emphasizing its importance in improving operations. Finally, the report concludes with recommendations, suggesting the adoption of EOQ and moving average forecasting to streamline Fast Good's supply chain operations.
Running head: FAST GOOD REPORT 1
Topic
Name
Institution
Topic
Name
Institution
Paraphrase This Document
Need a fresh take? Get an instant paraphrase of this document with our AI Paraphraser
FAST GOOD REPORT 2
Contents
Executive Summary.............................................................................................................3
Introduction..........................................................................................................................4
Review of case study...........................................................................................................4
1. Discuss how your supply chain map enables her to make an effective and efficient
decision. 4
2. Moving average forecast............................................................................................6
3. Economic order policy...............................................................................................8
Review of How HP Visualizes its Supply Chain using Geographic Analytics (Acksteiner
& Trautmann, 2013)......................................................................................................................10
Conclusion.........................................................................................................................11
References..........................................................................................................................12
FAST GOOD REPORT 3
Executive Summary
This report documents the challenges and possible solutions that Mrs. Indra Banerjee
comes across. The report revisits supply chain strategies to expose the loopholes that Fast Goods
has in its strategical plan. Then the report maps out Fast Goods supply chain to determine the
areas with unfavorable and unmet demand densities and then develops a critical consideration of
a supply chain solution applicable to supply Fast Good.
⊘ This is a preview!⊘
Do you want full access?
Subscribe today to unlock all pages.
Trusted by 1+ million students worldwide
FAST GOOD REPORT 4
FAST GOOD REPORT
Introduction
Fast Good operates majorly in southeast Asia. The company has experienced major
drawbacks in managing its distribution chain in the region in which several retailers operate. The
company conclusively deciphered that its supply chain network cannot support the company’s
stakeholders and business hierarchy; that's why the company had numerous downfalls ad
constraints in its operations in the regional business set-up. The following three analyses
systematically engage the operations at fast Goods to answer the questions asked in the
investigations.
Review of case study
1. Discuss how your supply chain map enables her to make an effective and efficient
decision.
Relative locations of distributors, factories, and customers are brought to light. One of the
most important factors in the establishment of a distribution chain is the location. The choice of
location of distribution centers is key in determining the effort and cost required by the
distributor and the retailer to make the products available to the customer. The choice of the
distribution center relative to the factory also determines the route options that the firm will have
to use to stock and restock the distribution center (Millar, 2013).
With the supply chain map generated hereby, the consultant can easily see the locations
of distribution centers factories and customers relative to each other. By an analysis of the map,
she can see the distance of customers realty to distributors, and she can easily identify which
customers are farthest from the existing distributors (Hong, Zhang, & Ding, 2018). The locations
Paraphrase This Document
Need a fresh take? Get an instant paraphrase of this document with our AI Paraphraser
FAST GOOD REPORT 5
of the distributor, the Locations of factories and suppliers relative to the distributor. These
locations are important in deciphering which areas are stretched thin within the distribution
chain. They help identify a need or a gap in the distribution chain, and this identity is the
decision variable in the establishment of a distribution center.
The map creates a perspective on routing options and logistics. The role of a distributor
center is to ensure retailers and customers have enough stock. If the company is responsible for
delivering orders to its clients, which is assumed to be the case with fast goods, the company
must be very strategic in ensuring that delivery trucks can reach all drop points in one round trip
following the shortest and fastest route possible. Using the map, the consulting strategist can see
the current routes and can get a general idea of which routes the delivery needs to pass through
(Bakker, Riezebos, & Teunter, 2012).
The indicators of demand density. The map is indicative of the density; this is replicated
by the locations of customers. A larger concentration of customers indicates a probably
increased demand in the area. The number of units demanded, as represented in the map, is a
clear indication of the volume of suppliers required in the particular region. Through a close look
at these volumes, the strategist should be able to determine which region requires an increment in
volume of supplies and the number of units supplied and consequently, the capacity of the
distribution center (FOltz, 2012).
The supply chain map indicates the relative number of units demanded from each
distribution center. As such, it is possible to calculate the capacity utilization thereof and to
decide which distribution centers need relief or an increment in capacity. Given that the capacity
for each of the existing distributors is known, the consultant will easily notice the applicable
distribution chain expansion strategy that is most suitable for the scenario.
FAST GOOD REPORT 6
The map creates a graphical/visual representation of trends as the distance from the
distributors is increasing. The trends indicate the optimal distances that a distribution center can
serve effectively without losing efficiency. The map shows the regions that a supplier will
effectively reach and the areas that do not have sufficient coverage.
The map shows areas that can be easily reached but have not been reached. These are
areas that are close to existing distribution centers, but due to the stretching of capacity on
existing distribution centers, they are not reached. As a result, the new distribution center can be
established strategically in a way that allows the existing centers to divert attention and services
to reach new potential customers (GUOFENG, 2013). Furthermore, this will see that the clientele
that is being tapped by the competition is recaptured and maintained as Fast Good's clientele.
In summary, the supply chain mapping will enable the consulting personnel to allocate
regions of service to specific distribution centers that will allow easy and efficient movement of
products from the factory to the distributors and then to the customers. A strategy that ensures
maximum utilization of capacity and the farthest reach of distribution centers is the one that will
see the realization of a very effective and efficient supply chain (Bouchery, Ghaffari, Jemai, &
Dallery, 2012).
2. Moving average forecast
The period of concern for the moving average is the July to December period, which
means its from week 27 to week 52. Below is the total demand data for 26th to 52nd week. The
data is then consolidated to show the weekly demand for facial cream.
⊘ This is a preview!⊘
Do you want full access?
Subscribe today to unlock all pages.
Trusted by 1+ million students worldwide
FAST GOOD REPORT 7
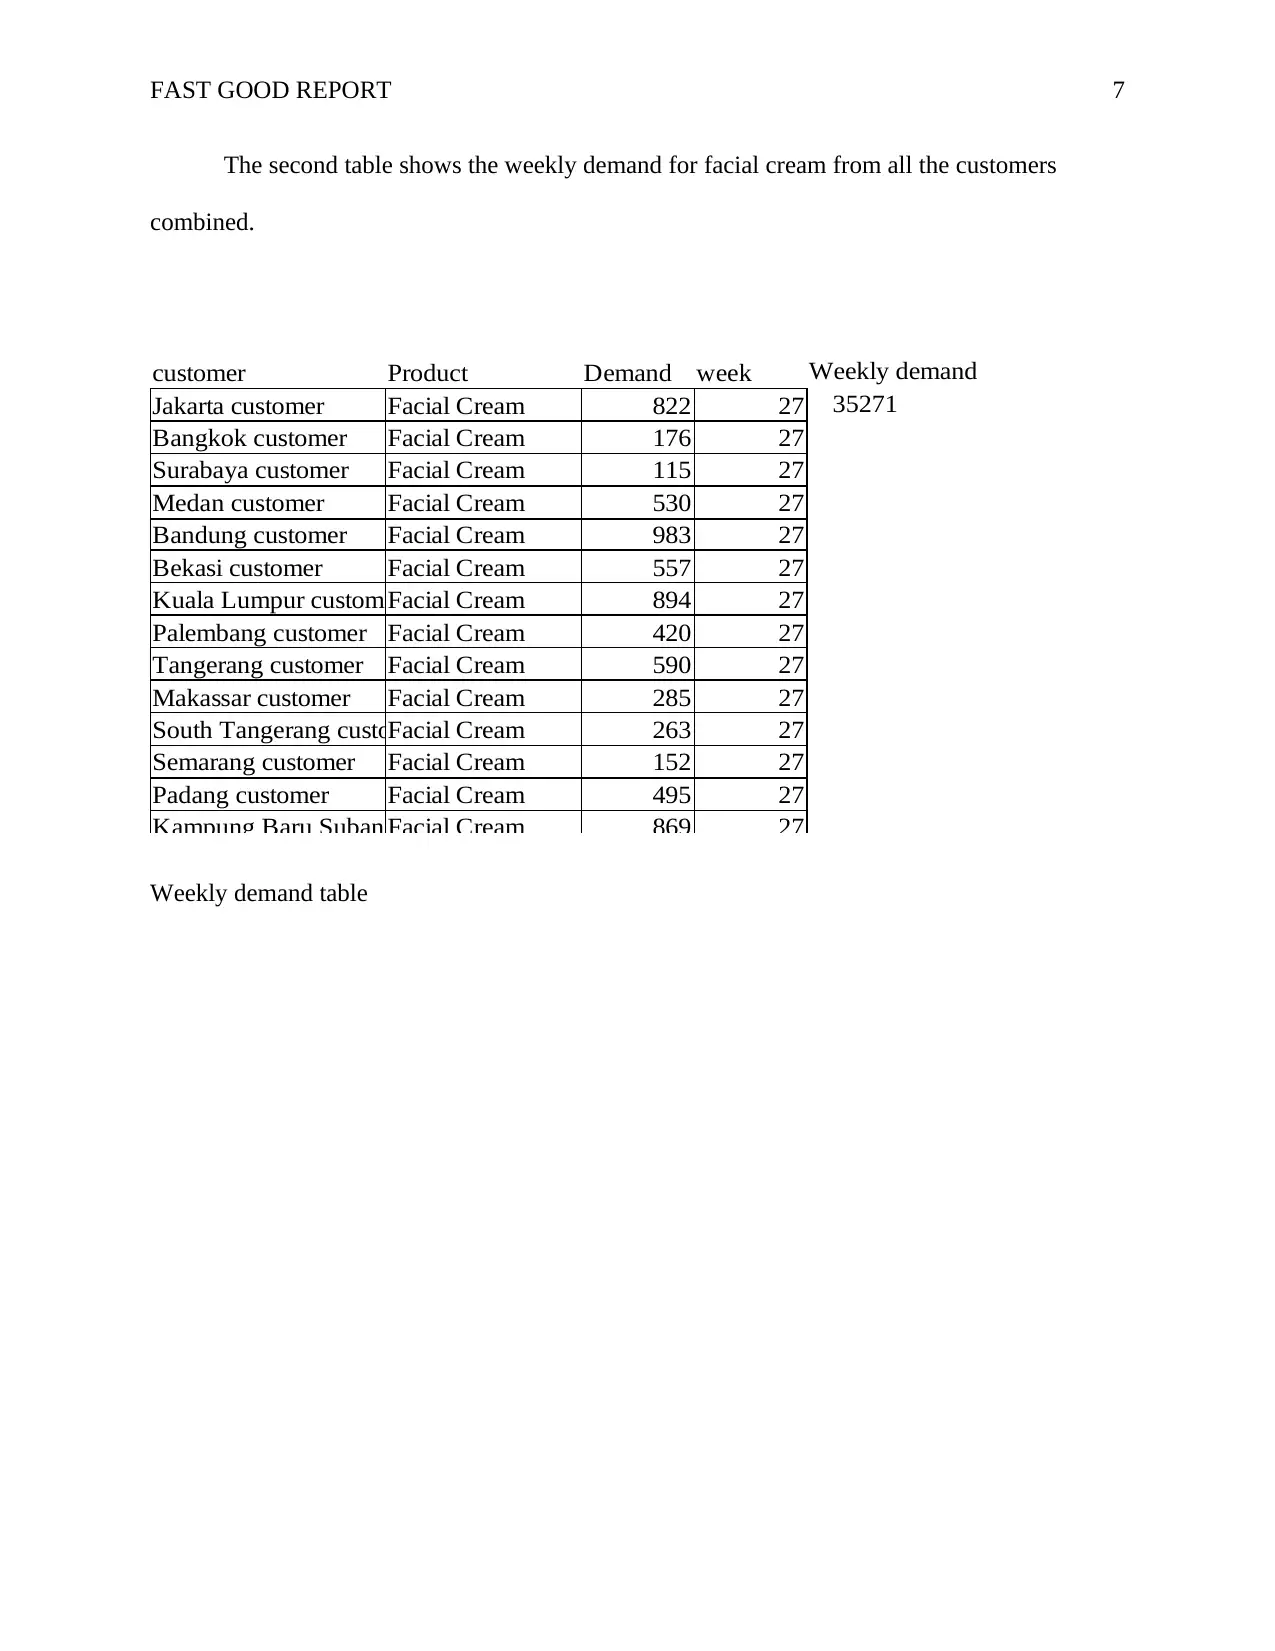
The second table shows the weekly demand for facial cream from all the customers
combined.
customer Product Demand week Weekly demand
Jakarta customer Facial Cream 822 27 35271
Bangkok customer Facial Cream 176 27
Surabaya customer Facial Cream 115 27
Medan customer Facial Cream 530 27
Bandung customer Facial Cream 983 27
Bekasi customer Facial Cream 557 27
Kuala Lumpur customeFacial Cream 894 27
Palembang customer Facial Cream 420 27
Tangerang customer Facial Cream 590 27
Makassar customer Facial Cream 285 27
South Tangerang custoFacial Cream 263 27
Semarang customer Facial Cream 152 27
Padang customer Facial Cream 495 27
Kampung Baru SubangFacial Cream 869 27
Weekly demand table
Paraphrase This Document
Need a fresh take? Get an instant paraphrase of this document with our AI Paraphraser
FAST GOOD REPORT 8
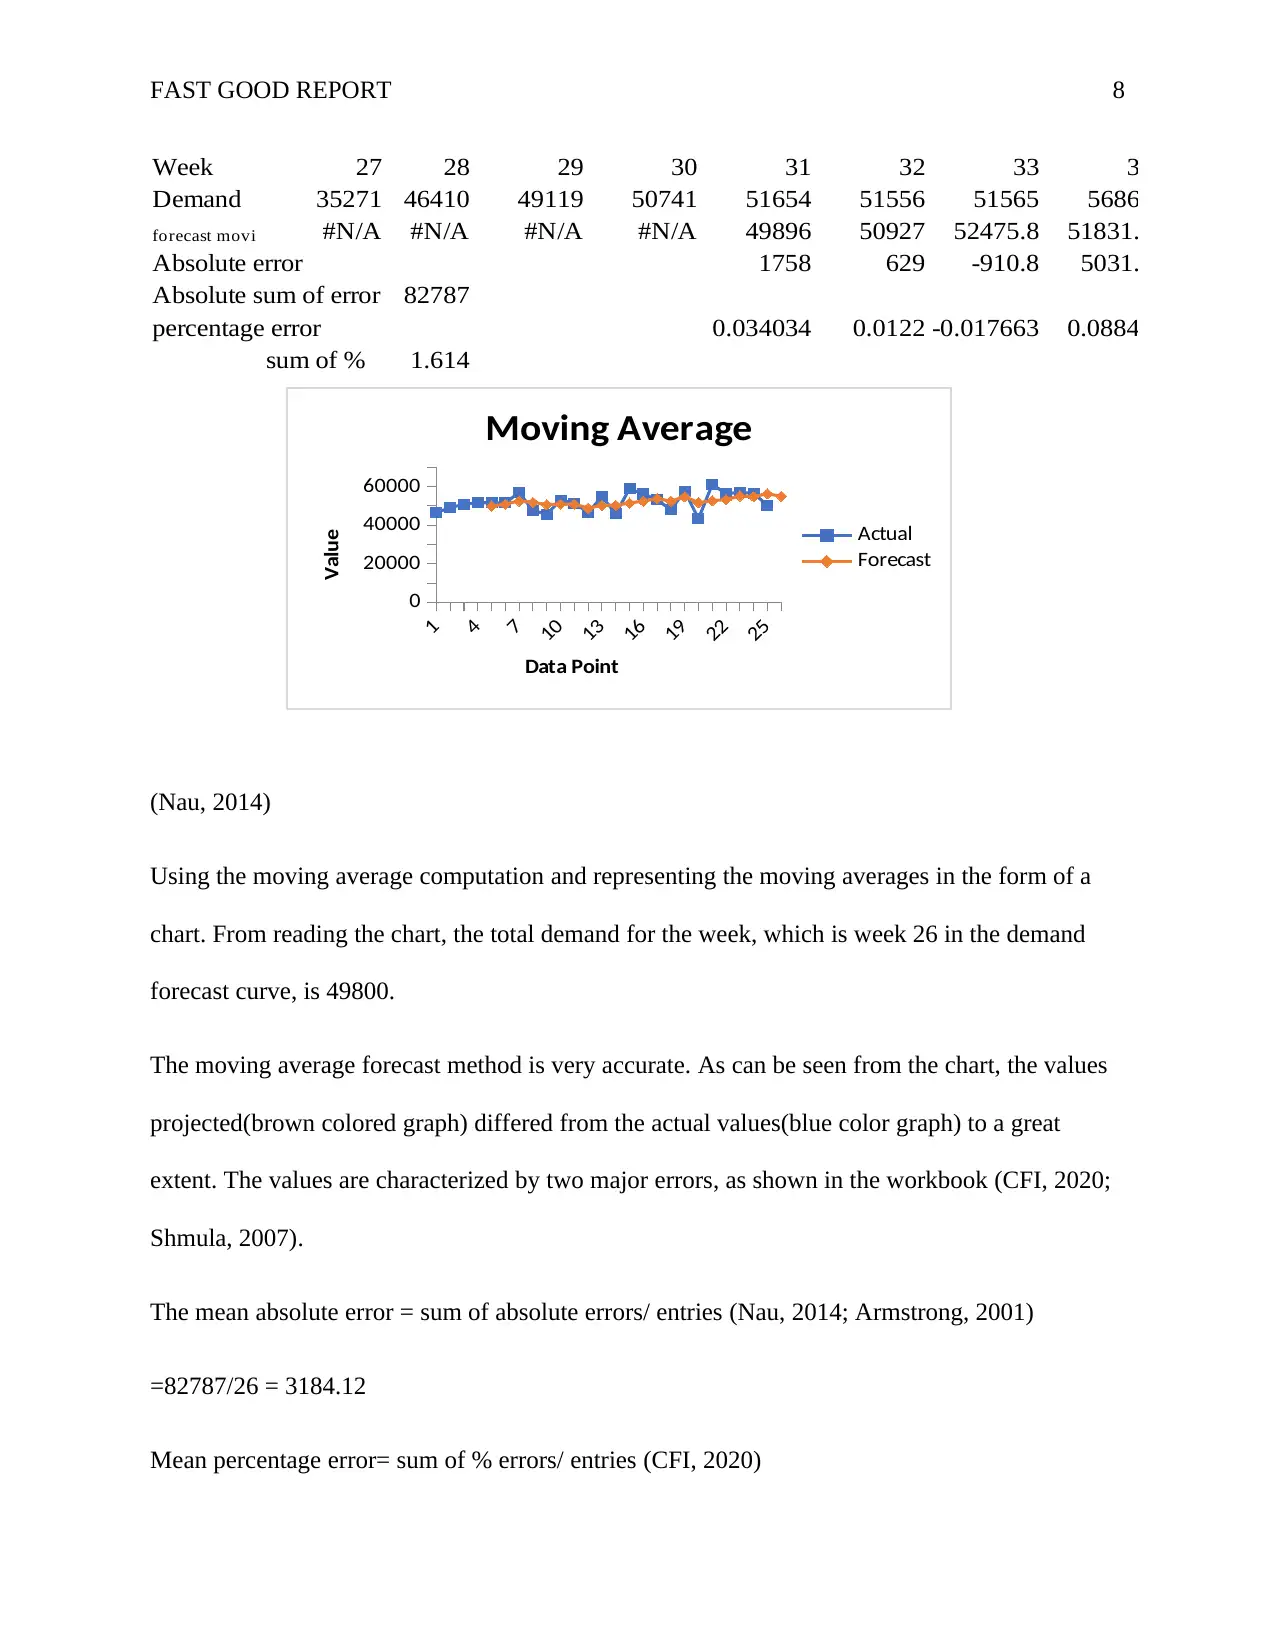
Week 27 28 29 30 31 32 33 34
Demand 35271 46410 49119 50741 51654 51556 51565 56863
forecast movi #N/A #N/A #N/A #N/A 49896 50927 52475.8 51831.2
Absolute error 1758 629 -910.8 5031.8
Absolute sum of error 82787
percentage error 0.034034 0.0122 -0.017663 0.08849
sum of % 1.614
1
4
7
10
13
16
19
22
25
0
20000
40000
60000
Moving Average
Actual
Forecast
Data Point
Value
(Nau, 2014)
Using the moving average computation and representing the moving averages in the form of a
chart. From reading the chart, the total demand for the week, which is week 26 in the demand
forecast curve, is 49800.
The moving average forecast method is very accurate. As can be seen from the chart, the values
projected(brown colored graph) differed from the actual values(blue color graph) to a great
extent. The values are characterized by two major errors, as shown in the workbook (CFI, 2020;
Shmula, 2007).
The mean absolute error = sum of absolute errors/ entries (Nau, 2014; Armstrong, 2001)
=82787/26 = 3184.12
Mean percentage error= sum of % errors/ entries (CFI, 2020)
FAST GOOD REPORT 9
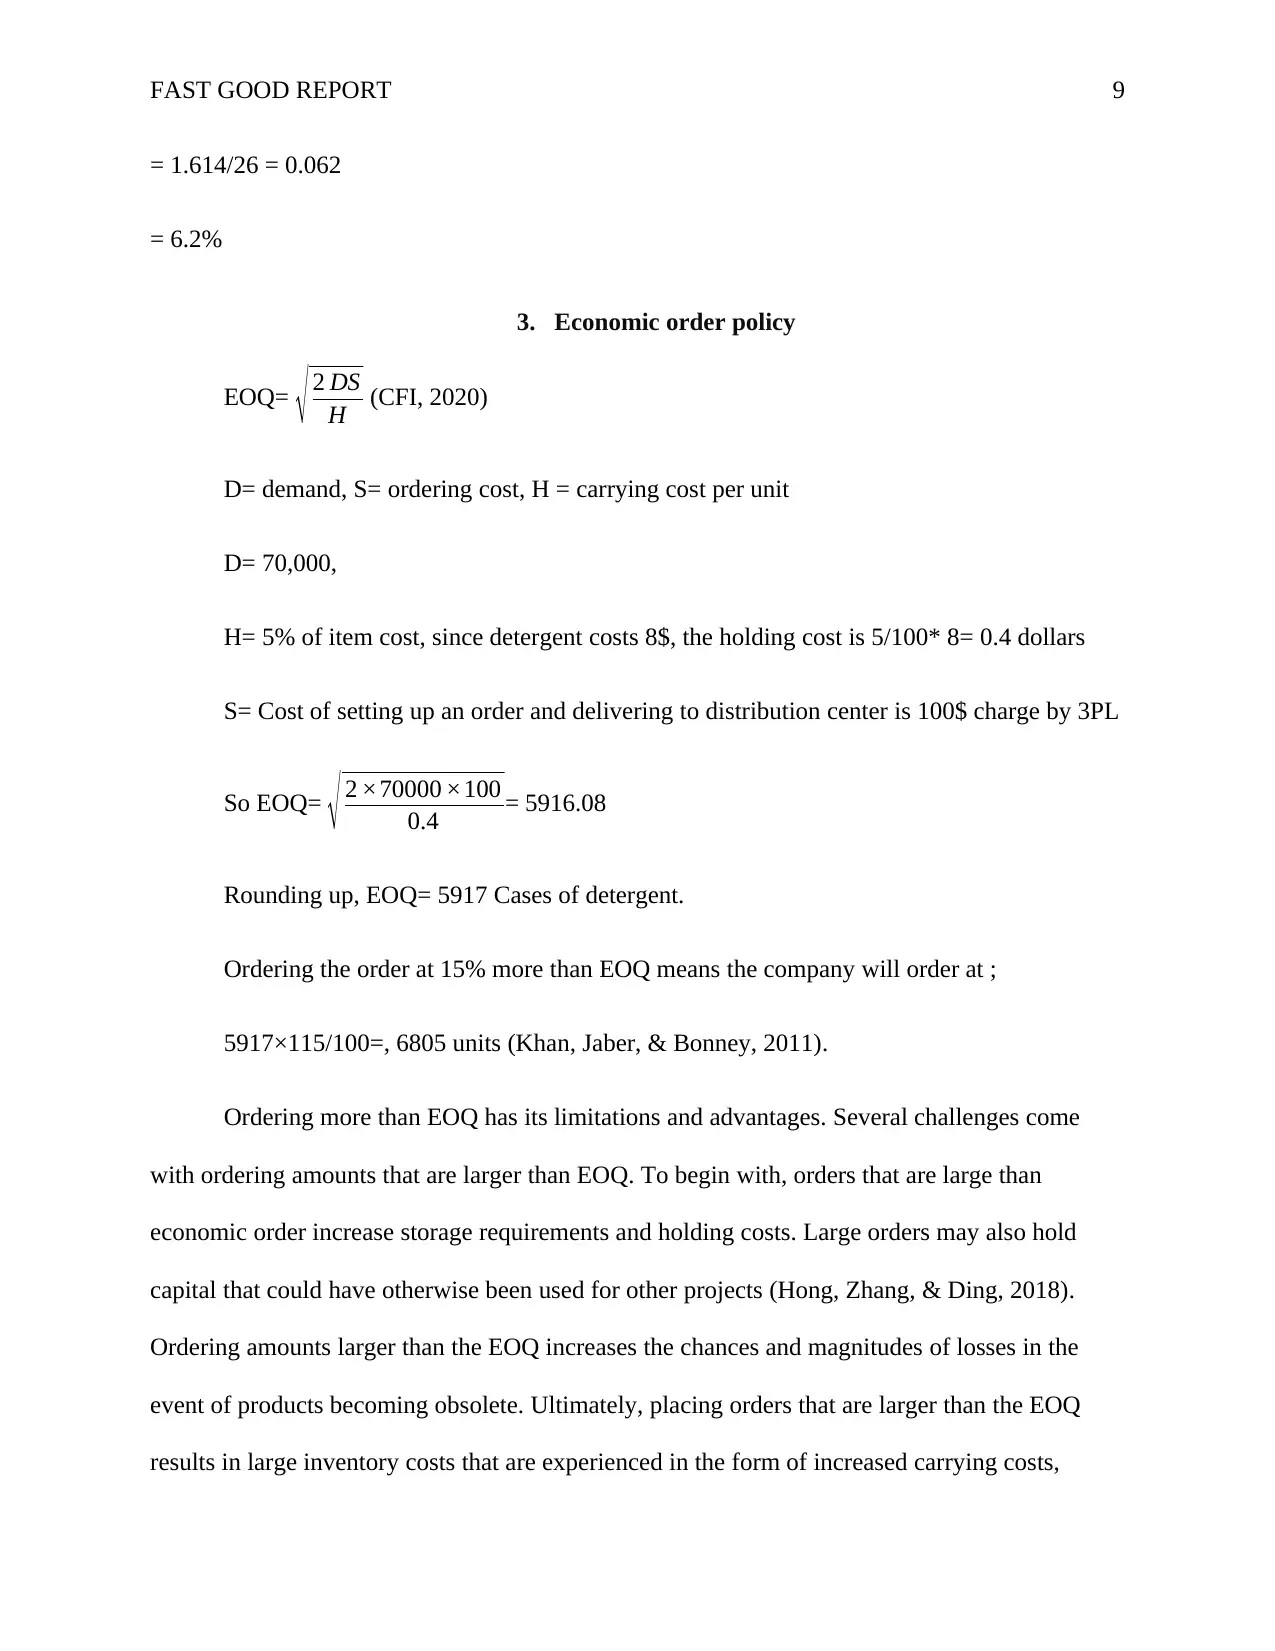
= 1.614/26 = 0.062
= 6.2%
3. Economic order policy
EOQ= √ 2 DS
H (CFI, 2020)
D= demand, S= ordering cost, H = carrying cost per unit
D= 70,000,
H= 5% of item cost, since detergent costs 8$, the holding cost is 5/100* 8= 0.4 dollars
S= Cost of setting up an order and delivering to distribution center is 100$ charge by 3PL
So EOQ= √ 2 ×70000 ×100
0.4 = 5916.08
Rounding up, EOQ= 5917 Cases of detergent.
Ordering the order at 15% more than EOQ means the company will order at ;
5917×115/100=, 6805 units (Khan, Jaber, & Bonney, 2011).
Ordering more than EOQ has its limitations and advantages. Several challenges come
with ordering amounts that are larger than EOQ. To begin with, orders that are large than
economic order increase storage requirements and holding costs. Large orders may also hold
capital that could have otherwise been used for other projects (Hong, Zhang, & Ding, 2018).
Ordering amounts larger than the EOQ increases the chances and magnitudes of losses in the
event of products becoming obsolete. Ultimately, placing orders that are larger than the EOQ
results in large inventory costs that are experienced in the form of increased carrying costs,
⊘ This is a preview!⊘
Do you want full access?
Subscribe today to unlock all pages.
Trusted by 1+ million students worldwide
FAST GOOD REPORT 10
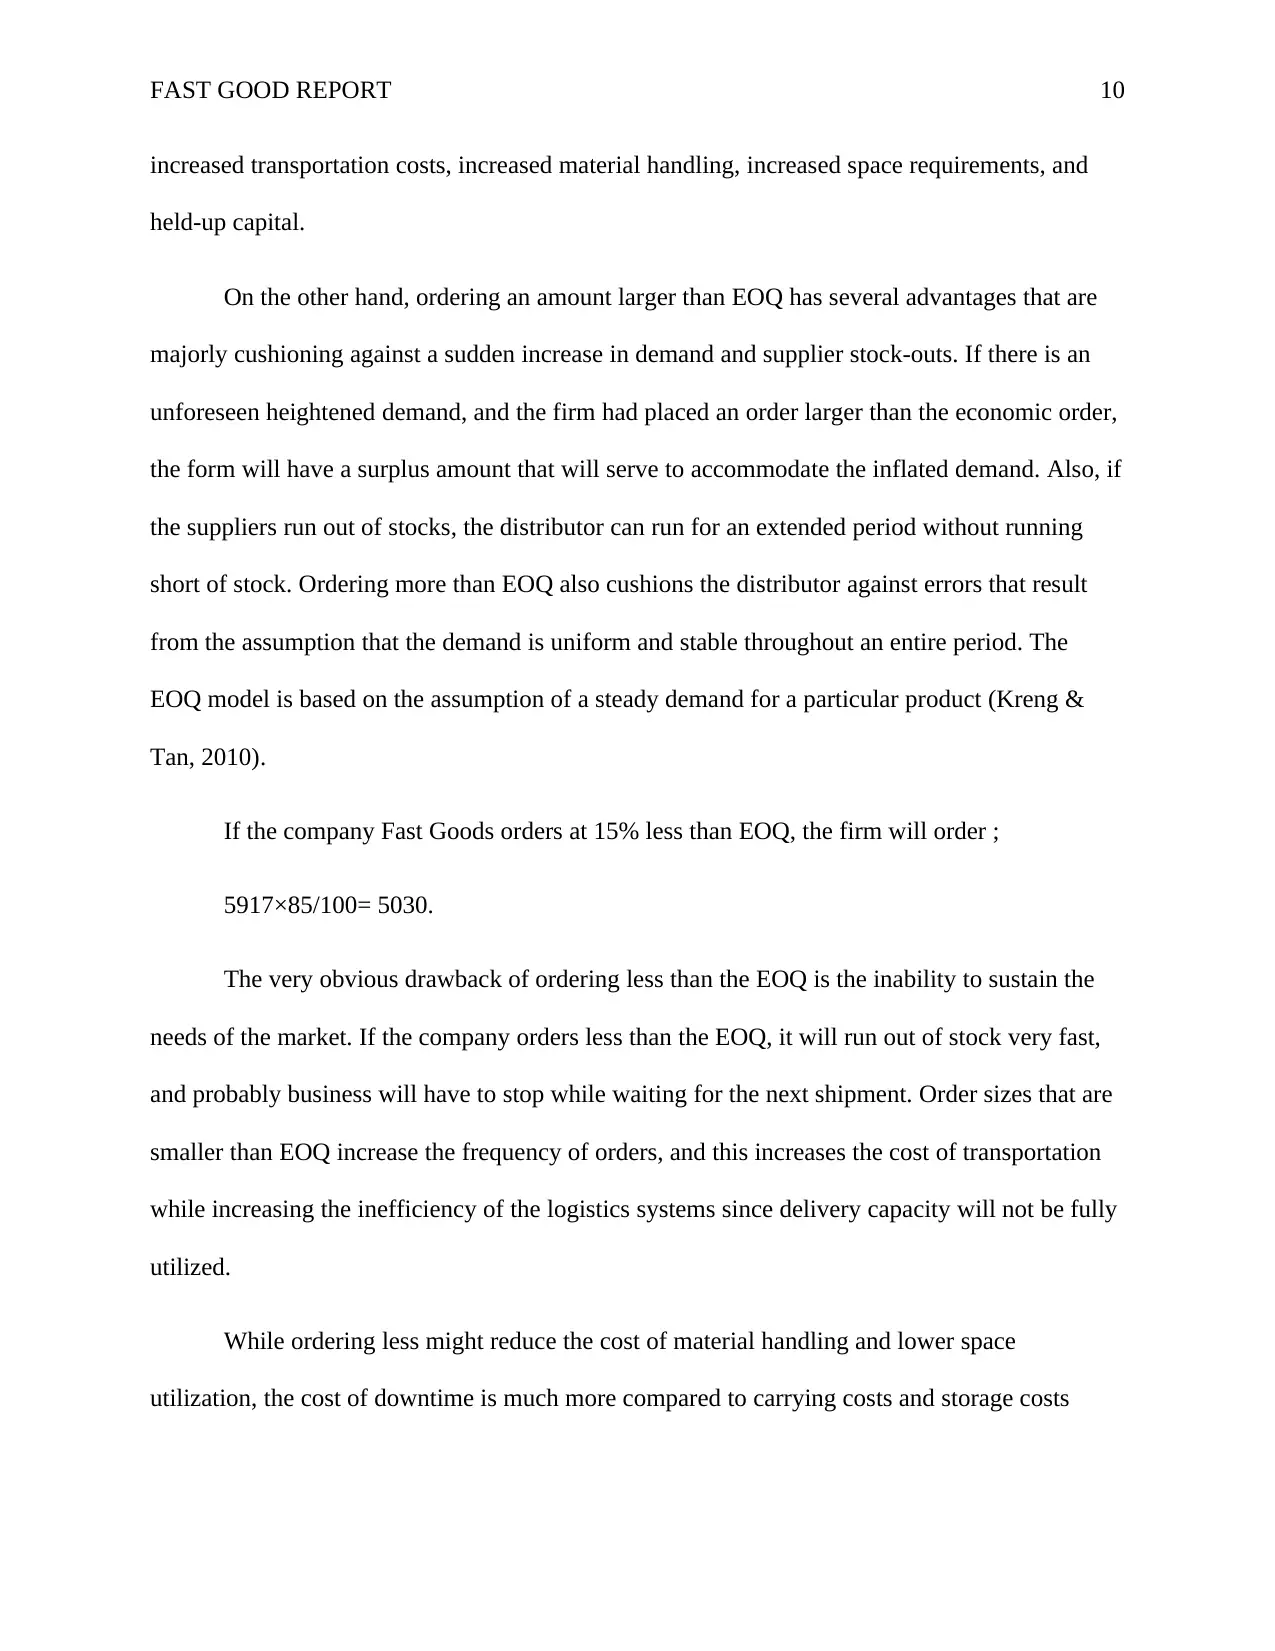
increased transportation costs, increased material handling, increased space requirements, and
held-up capital.
On the other hand, ordering an amount larger than EOQ has several advantages that are
majorly cushioning against a sudden increase in demand and supplier stock-outs. If there is an
unforeseen heightened demand, and the firm had placed an order larger than the economic order,
the form will have a surplus amount that will serve to accommodate the inflated demand. Also, if
the suppliers run out of stocks, the distributor can run for an extended period without running
short of stock. Ordering more than EOQ also cushions the distributor against errors that result
from the assumption that the demand is uniform and stable throughout an entire period. The
EOQ model is based on the assumption of a steady demand for a particular product (Kreng &
Tan, 2010).
If the company Fast Goods orders at 15% less than EOQ, the firm will order ;
5917×85/100= 5030.
The very obvious drawback of ordering less than the EOQ is the inability to sustain the
needs of the market. If the company orders less than the EOQ, it will run out of stock very fast,
and probably business will have to stop while waiting for the next shipment. Order sizes that are
smaller than EOQ increase the frequency of orders, and this increases the cost of transportation
while increasing the inefficiency of the logistics systems since delivery capacity will not be fully
utilized.
While ordering less might reduce the cost of material handling and lower space
utilization, the cost of downtime is much more compared to carrying costs and storage costs
Paraphrase This Document
Need a fresh take? Get an instant paraphrase of this document with our AI Paraphraser
FAST GOOD REPORT 11
combined, and the result of small order will be fewer profits, less volume of sales and hence less
revenue returns (Taleizadeh, 2014).
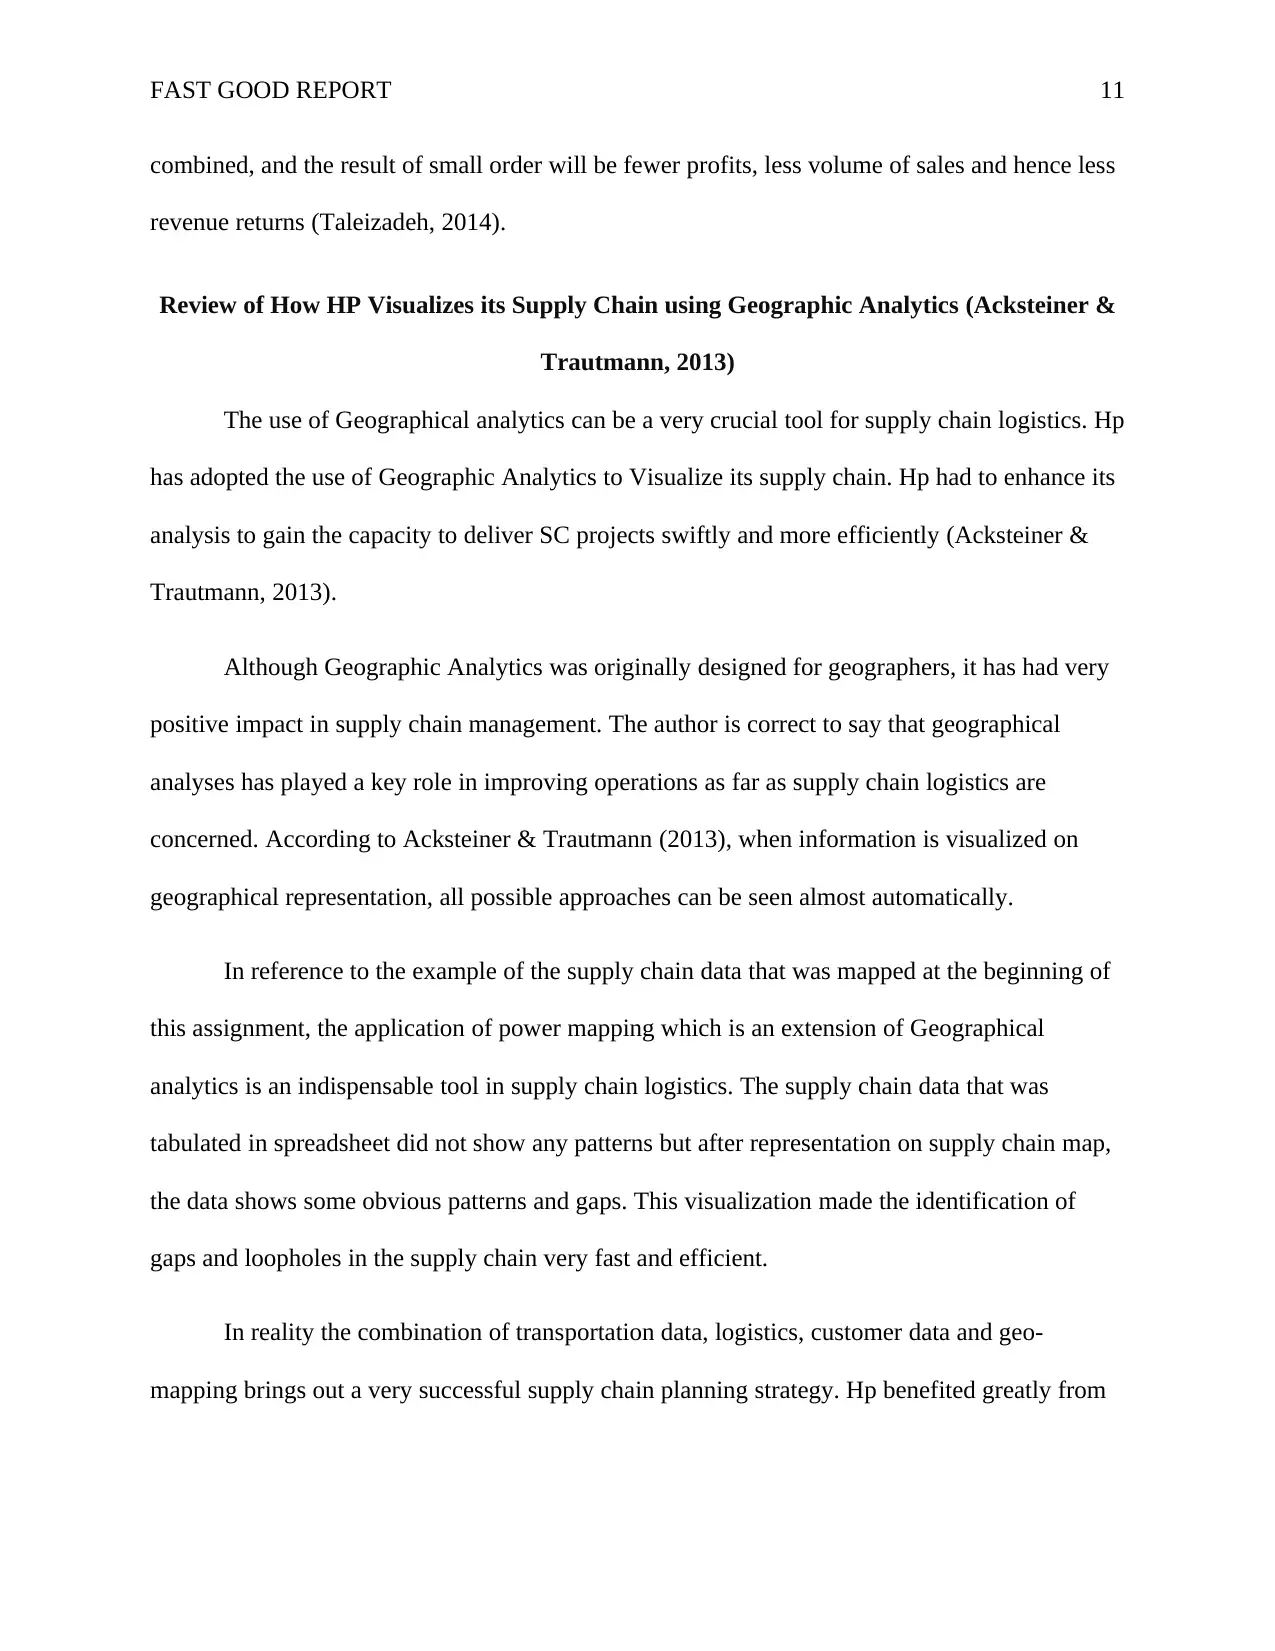
Review of How HP Visualizes its Supply Chain using Geographic Analytics (Acksteiner &
Trautmann, 2013)
The use of Geographical analytics can be a very crucial tool for supply chain logistics. Hp
has adopted the use of Geographic Analytics to Visualize its supply chain. Hp had to enhance its
analysis to gain the capacity to deliver SC projects swiftly and more efficiently (Acksteiner &
Trautmann, 2013).
Although Geographic Analytics was originally designed for geographers, it has had very
positive impact in supply chain management. The author is correct to say that geographical
analyses has played a key role in improving operations as far as supply chain logistics are
concerned. According to Acksteiner & Trautmann (2013), when information is visualized on
geographical representation, all possible approaches can be seen almost automatically.
In reference to the example of the supply chain data that was mapped at the beginning of
this assignment, the application of power mapping which is an extension of Geographical
analytics is an indispensable tool in supply chain logistics. The supply chain data that was
tabulated in spreadsheet did not show any patterns but after representation on supply chain map,
the data shows some obvious patterns and gaps. This visualization made the identification of
gaps and loopholes in the supply chain very fast and efficient.
In reality the combination of transportation data, logistics, customer data and geo-
mapping brings out a very successful supply chain planning strategy. Hp benefited greatly from
combined, and the result of small order will be fewer profits, less volume of sales and hence less
revenue returns (Taleizadeh, 2014).
Review of How HP Visualizes its Supply Chain using Geographic Analytics (Acksteiner &
Trautmann, 2013)
The use of Geographical analytics can be a very crucial tool for supply chain logistics. Hp
has adopted the use of Geographic Analytics to Visualize its supply chain. Hp had to enhance its
analysis to gain the capacity to deliver SC projects swiftly and more efficiently (Acksteiner &
Trautmann, 2013).
Although Geographic Analytics was originally designed for geographers, it has had very
positive impact in supply chain management. The author is correct to say that geographical
analyses has played a key role in improving operations as far as supply chain logistics are
concerned. According to Acksteiner & Trautmann (2013), when information is visualized on
geographical representation, all possible approaches can be seen almost automatically.
In reference to the example of the supply chain data that was mapped at the beginning of
this assignment, the application of power mapping which is an extension of Geographical
analytics is an indispensable tool in supply chain logistics. The supply chain data that was
tabulated in spreadsheet did not show any patterns but after representation on supply chain map,
the data shows some obvious patterns and gaps. This visualization made the identification of
gaps and loopholes in the supply chain very fast and efficient.
In reality the combination of transportation data, logistics, customer data and geo-
mapping brings out a very successful supply chain planning strategy. Hp benefited greatly from
FAST GOOD REPORT 12
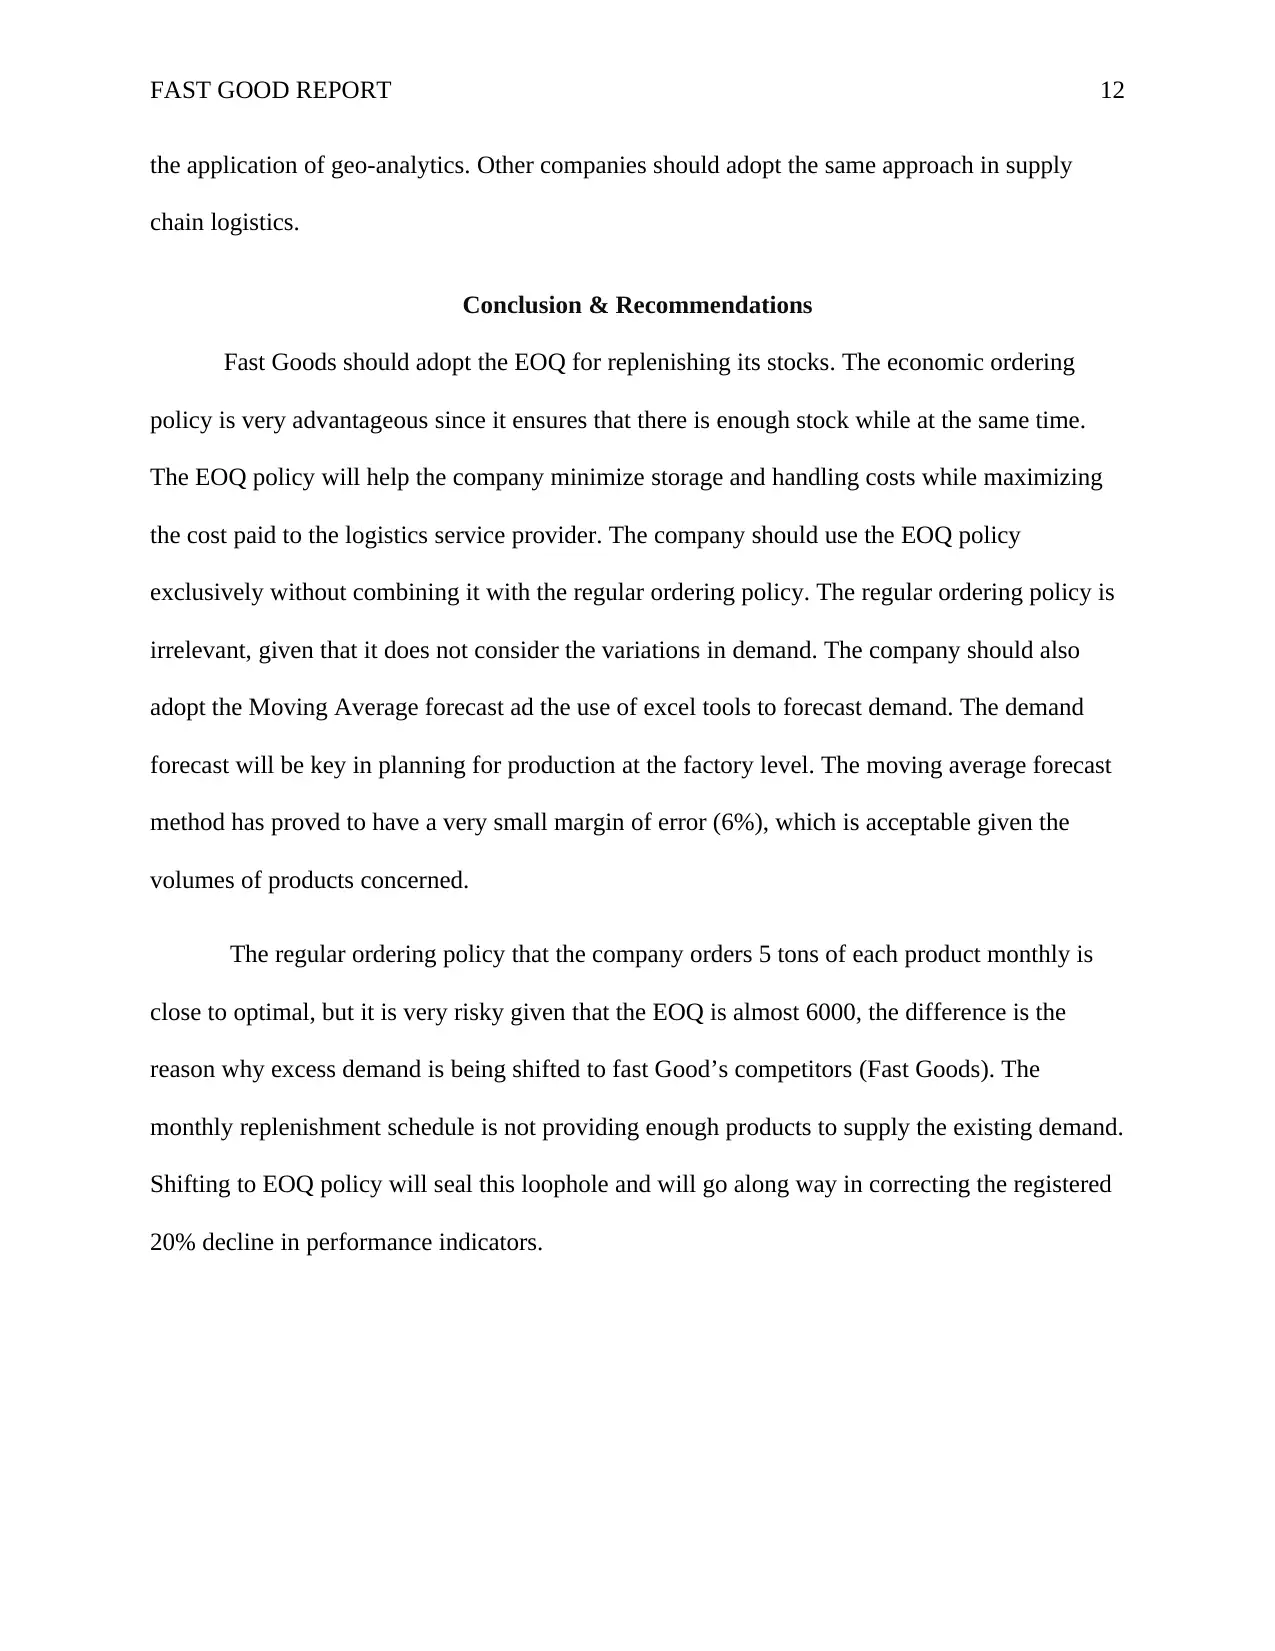
the application of geo-analytics. Other companies should adopt the same approach in supply
chain logistics.
Conclusion & Recommendations
Fast Goods should adopt the EOQ for replenishing its stocks. The economic ordering
policy is very advantageous since it ensures that there is enough stock while at the same time.
The EOQ policy will help the company minimize storage and handling costs while maximizing
the cost paid to the logistics service provider. The company should use the EOQ policy
exclusively without combining it with the regular ordering policy. The regular ordering policy is
irrelevant, given that it does not consider the variations in demand. The company should also
adopt the Moving Average forecast ad the use of excel tools to forecast demand. The demand
forecast will be key in planning for production at the factory level. The moving average forecast
method has proved to have a very small margin of error (6%), which is acceptable given the
volumes of products concerned.
The regular ordering policy that the company orders 5 tons of each product monthly is
close to optimal, but it is very risky given that the EOQ is almost 6000, the difference is the
reason why excess demand is being shifted to fast Good’s competitors (Fast Goods). The
monthly replenishment schedule is not providing enough products to supply the existing demand.
Shifting to EOQ policy will seal this loophole and will go along way in correcting the registered
20% decline in performance indicators.
⊘ This is a preview!⊘
Do you want full access?
Subscribe today to unlock all pages.
Trusted by 1+ million students worldwide
1 out of 15
Related Documents


Your All-in-One AI-Powered Toolkit for Academic Success.
+13062052269
info@desklib.com
Available 24*7 on WhatsApp / Email
![[object Object]](/_next/static/media/star-bottom.7253800d.svg)
Unlock your academic potential
Copyright © 2020–2026 A2Z Services. All Rights Reserved. Developed and managed by ZUCOL.