Financial Report: Analysis of Faux Fashion Limited Performance
VerifiedAdded on 2022/03/29
|19
|3701
|34
Report
AI Summary
This report provides a comprehensive financial analysis of Faux Fashion Limited, examining its annual accounts, including income statements, and key financial ratios. It delves into costing and pricing strategies, comparing current costing methods with alternative approaches like activity-based costing, and evaluating their pros and cons. The report further explores variance analysis, comparing budgeted and actual performance for April and May, and offers recommendations based on the findings. It also assesses capital expenditure (capex) using methods like payback period, accounting rate of return (ARR), net present value (NPV), and internal rate of return (IRR). Finally, the report covers budgeting, including budget and cash flow forecasts, providing a holistic view of Faux Fashion Limited's financial health and performance.
“Faux Fashion Limited” Words: 2500
Paraphrase This Document
Need a fresh take? Get an instant paraphrase of this document with our AI Paraphraser
Table of Contents
List of Tables.............................................................................................................................................3
1) Review of Annual Accounts.............................................................................................................4
a) Purpose of Financial Statements................................................................................................4
b) Analysis of Income Statement.....................................................................................................4
c) Overview of accounting fundamentals.......................................................................................6
2) Costing and Pricing...........................................................................................................................9
a) Cost for single men’s black Faux leather jacket.......................................................................9
b) Total production overheads and calculation of an alternative total cost................................9
c) Difference between current costing and alternative total cost method and the pros and
cons of the two alternative approaches.............................................................................................9
3) Variance Analysis...........................................................................................................................11
a) Budget for April (using experienced labour)............................................................................11
b) Budget for May (using apprentice labour)................................................................................12
c) Recommendation........................................................................................................................13
4) Capex Appraisal..............................................................................................................................14
a) Payback Period...........................................................................................................................14
b) Accounting rate of return (ARR)................................................................................................14
c) Net Present Value (NPV)...........................................................................................................15
d) Internal Rate of return (IRR)......................................................................................................15
5. Budgeting.........................................................................................................................................17
a) Budget Forecast..........................................................................................................................17
b) Cash flow forecast......................................................................................................................18
References..............................................................................................................................................20
List of Tables
Table 1: Income Statement.....................................................................................................................5
Table 2: Ratio analysis.............................................................................................................................5
Table 3: Working capital cycle................................................................................................................7
Table 4: Liquidity Ratio.............................................................................................................................7
Table 5: Cost per unit...............................................................................................................................9
Table 6: Total cost under AAA costing...................................................................................................9
Table 7: Original budget.........................................................................................................................11
Table 8: Actual budget...........................................................................................................................11
Table 9: Flex budget...............................................................................................................................11
Table 10: Variance analysis..................................................................................................................12
Table 11: Actual Budget (May).............................................................................................................13
Table 12: Variance analysis (May).......................................................................................................13
Table 13: NPV.........................................................................................................................................15
Table 14: Budget Forecast....................................................................................................................17
Table 15: Cash Flow Forecast..............................................................................................................18
⊘ This is a preview!⊘
Do you want full access?
Subscribe today to unlock all pages.
Trusted by 1+ million students worldwide
1) Review of Annual Accounts
a) Purpose of Financial Statements
Financial statements are prepared at the end of the financial year and are published for
the general public so that the investors can get the idea about the performance of a
company. There are four common financial statements which are income statement,
statement of financial position, statement of cash flows and statement of changes in
equity (Healy and Palepu, 2012).
a. Income Statement: Income statement identifies the profit and loss of a company
by subtracting revenues and expenses. It is helpful for the analysis of change in
income of the organization over the financial year (Brigham and Houston, 2012).
b. Statement of Financial position: This financial statement highlights the assets,
liabilities and equity held by a company. It is useful in identifying the liquidity risk
which can have an impact on the investing side of a company (Brigham and
Houston, 2012).
c. Statement of Cash flow: Statement of cash flow defines the inflow and outflow
of cash by dividing the function of the entities into operating activities, financing
activities and investing activities. Positive cash flows are said to have a good
impact on the stakeholders (Brigham and Houston, 2012).
d. Statement of Changes in equity: This statement identifies the changes in
equity side of the company by showing the impact of reserves, retained earnings
and any increased investments by the shareholders. It is helpful in identifying the
confidence if the investors ob a company (Brigham and Houston, 2012).
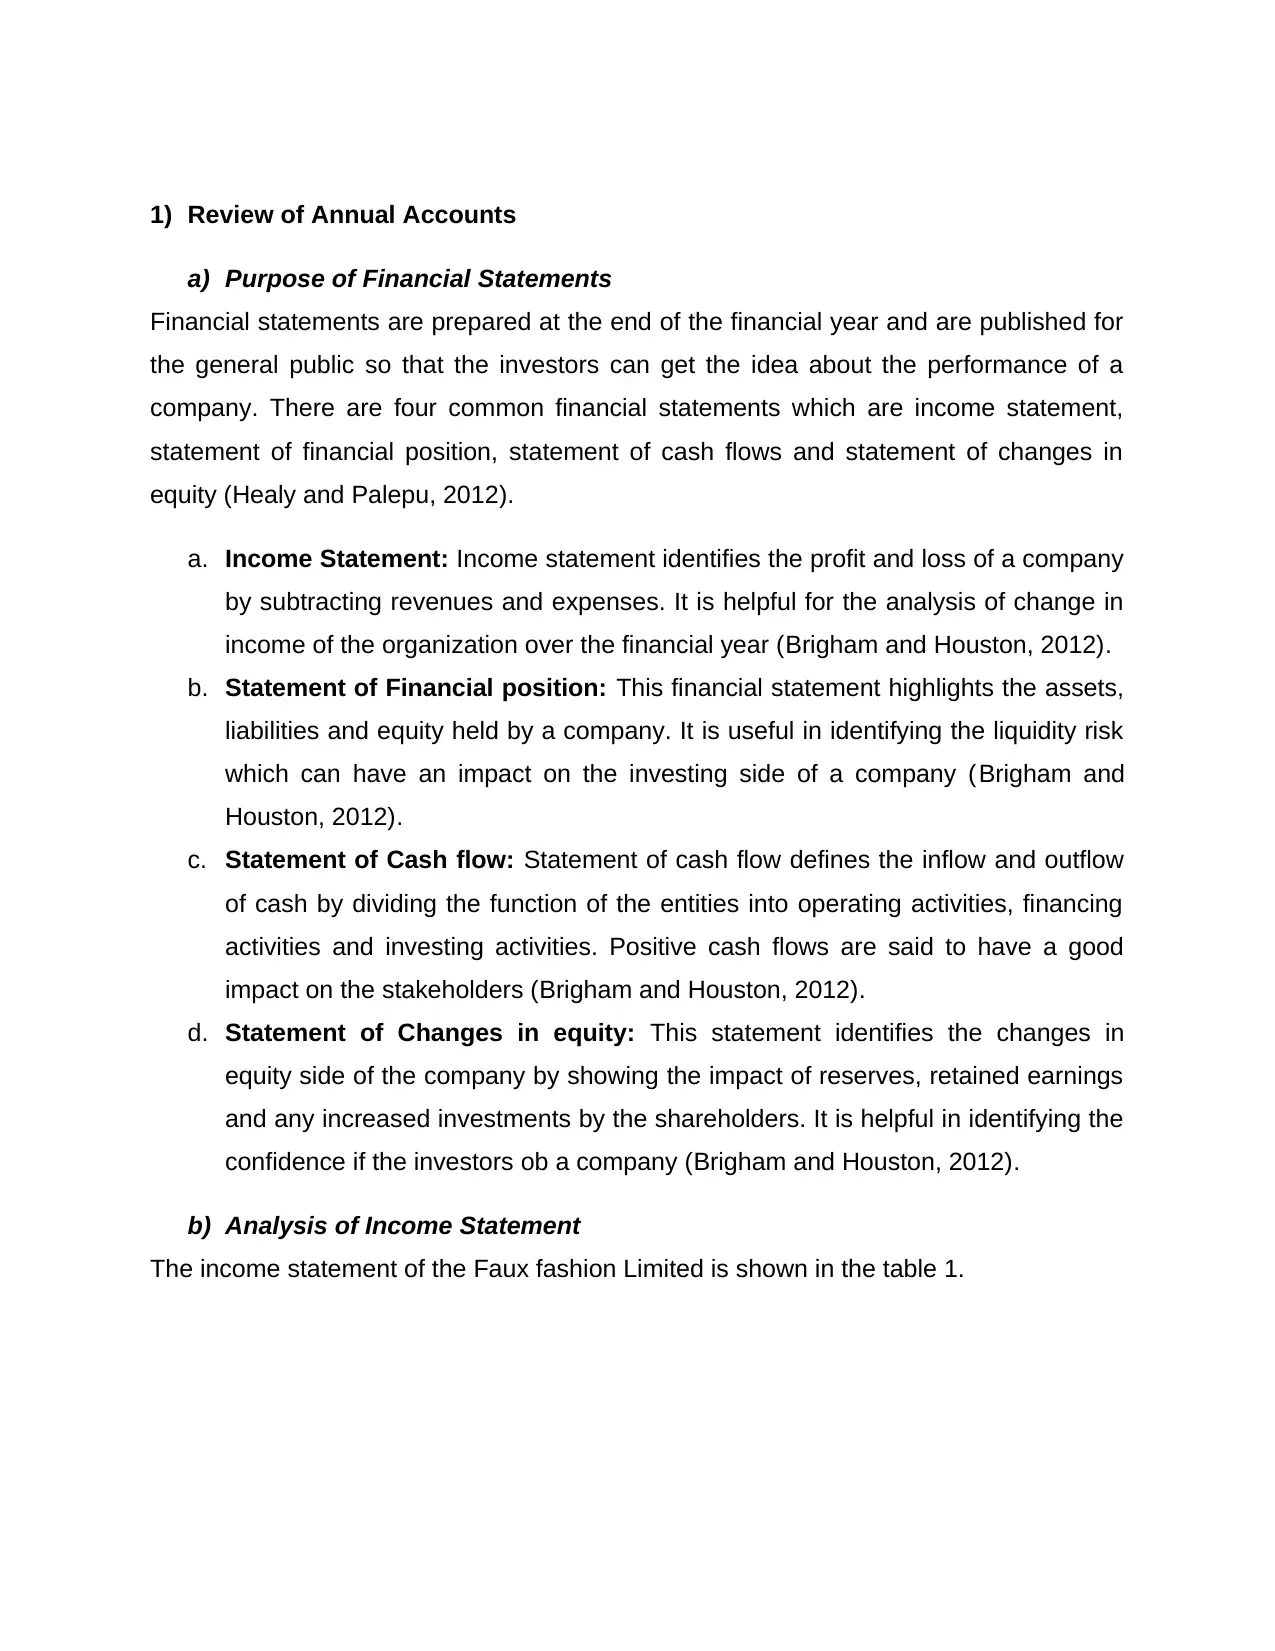
b) Analysis of Income Statement
The income statement of the Faux fashion Limited is shown in the table 1.
a) Purpose of Financial Statements
Financial statements are prepared at the end of the financial year and are published for
the general public so that the investors can get the idea about the performance of a
company. There are four common financial statements which are income statement,
statement of financial position, statement of cash flows and statement of changes in
equity (Healy and Palepu, 2012).
a. Income Statement: Income statement identifies the profit and loss of a company
by subtracting revenues and expenses. It is helpful for the analysis of change in
income of the organization over the financial year (Brigham and Houston, 2012).
b. Statement of Financial position: This financial statement highlights the assets,
liabilities and equity held by a company. It is useful in identifying the liquidity risk
which can have an impact on the investing side of a company (Brigham and
Houston, 2012).
c. Statement of Cash flow: Statement of cash flow defines the inflow and outflow
of cash by dividing the function of the entities into operating activities, financing
activities and investing activities. Positive cash flows are said to have a good
impact on the stakeholders (Brigham and Houston, 2012).
d. Statement of Changes in equity: This statement identifies the changes in
equity side of the company by showing the impact of reserves, retained earnings
and any increased investments by the shareholders. It is helpful in identifying the
confidence if the investors ob a company (Brigham and Houston, 2012).
b) Analysis of Income Statement
The income statement of the Faux fashion Limited is shown in the table 1.
Paraphrase This Document
Need a fresh take? Get an instant paraphrase of this document with our AI Paraphraser
2015 2014
Sales revenue 470,000£ 460,000£
Cost of Sales 220,900£ 220,800£
Gross profit 249,100£ 239,200£
Distribution and selling expense 110,000£ 108,000£
Administration expense 9,000£ 8,000£
Operating profit 130,100£ 123,200£
Finance Expense 500£ 450£
Profit before tax 129,600£ 122,750£
Corporation tax 23,328£ 28,233£
Profit after tax 106,272£ 94,517£
Faux Fashion Limited
Income Statement
For the year ending 31st December, 2015
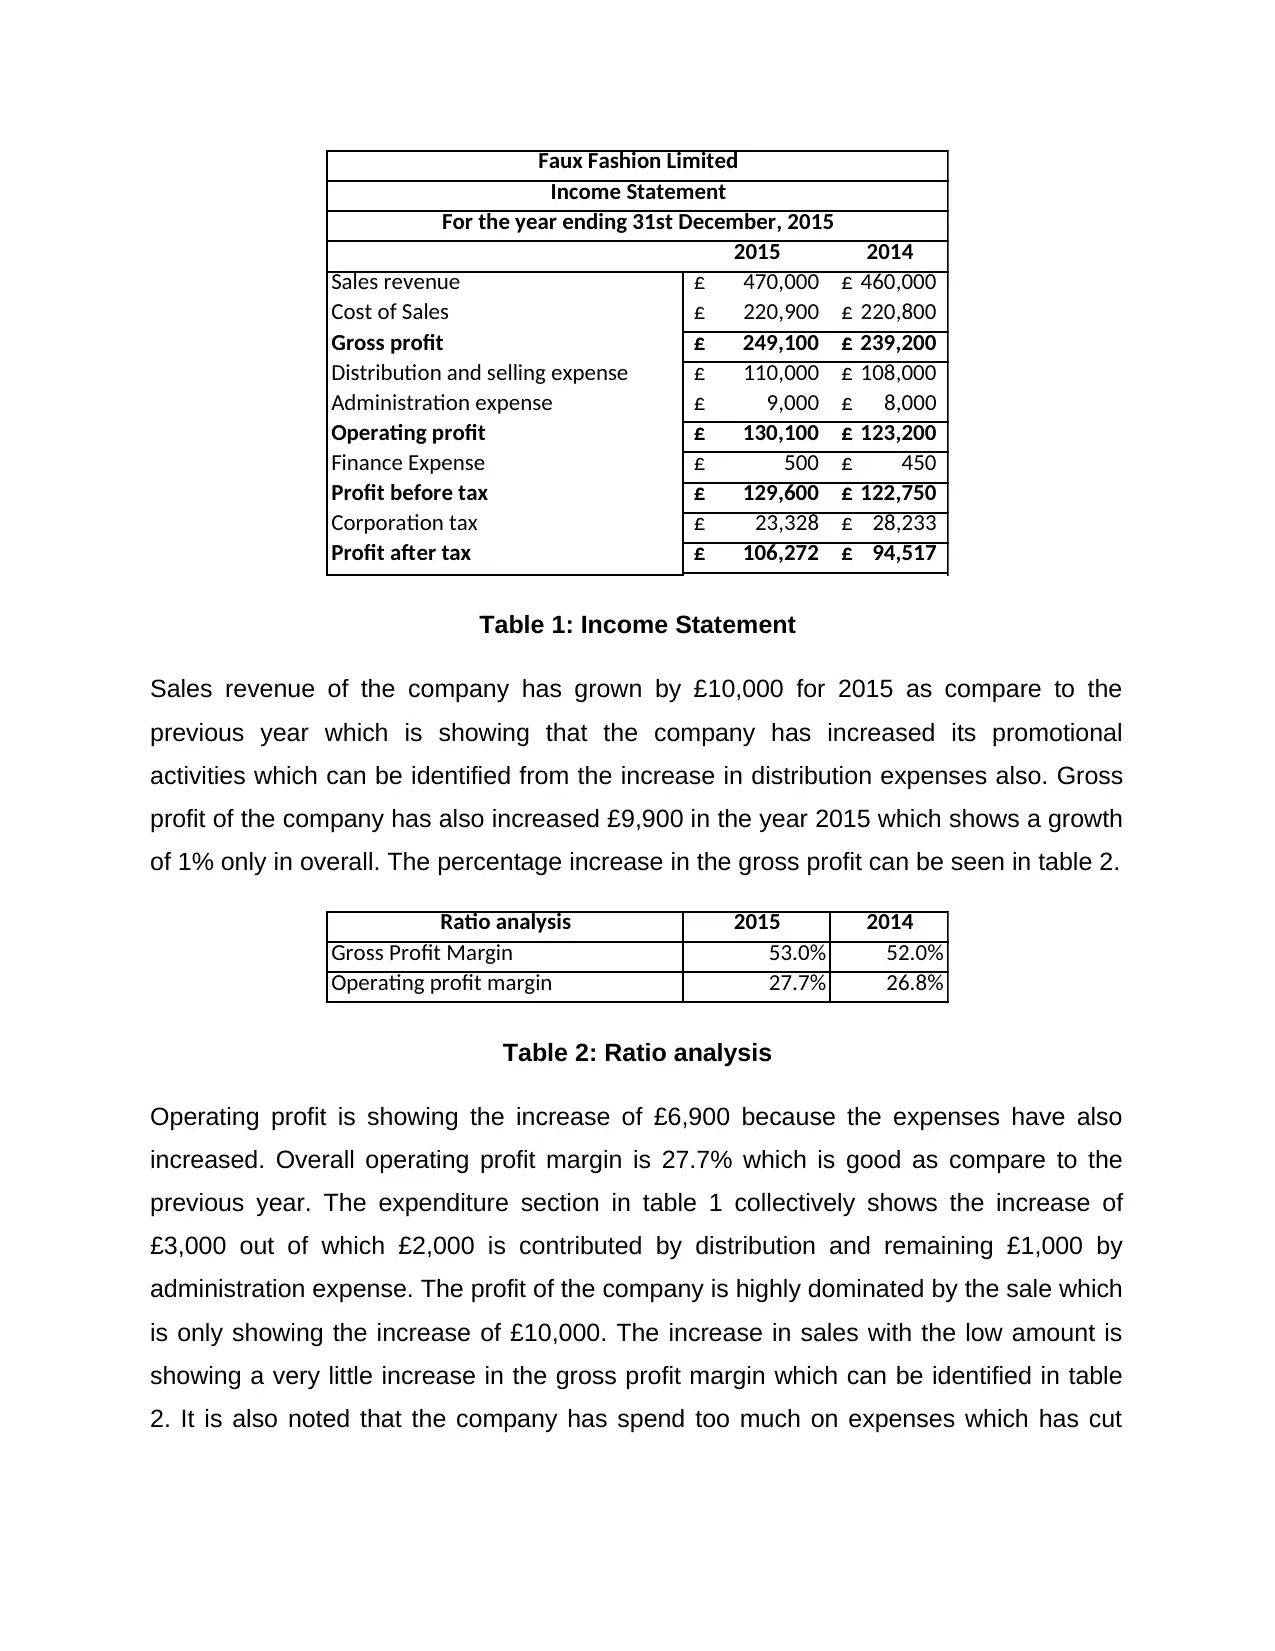
Table 1: Income Statement
Sales revenue of the company has grown by £10,000 for 2015 as compare to the
previous year which is showing that the company has increased its promotional
activities which can be identified from the increase in distribution expenses also. Gross
profit of the company has also increased £9,900 in the year 2015 which shows a growth
of 1% only in overall. The percentage increase in the gross profit can be seen in table 2.
Ratio analysis 2015 2014
Gross Profit Margin 53.0% 52.0%
Operating profit margin 27.7% 26.8%
Table 2: Ratio analysis
Operating profit is showing the increase of £6,900 because the expenses have also
increased. Overall operating profit margin is 27.7% which is good as compare to the
previous year. The expenditure section in table 1 collectively shows the increase of
£3,000 out of which £2,000 is contributed by distribution and remaining £1,000 by
administration expense. The profit of the company is highly dominated by the sale which
is only showing the increase of £10,000. The increase in sales with the low amount is
showing a very little increase in the gross profit margin which can be identified in table
2. It is also noted that the company has spend too much on expenses which has cut
Sales revenue 470,000£ 460,000£
Cost of Sales 220,900£ 220,800£
Gross profit 249,100£ 239,200£
Distribution and selling expense 110,000£ 108,000£
Administration expense 9,000£ 8,000£
Operating profit 130,100£ 123,200£
Finance Expense 500£ 450£
Profit before tax 129,600£ 122,750£
Corporation tax 23,328£ 28,233£
Profit after tax 106,272£ 94,517£
Faux Fashion Limited
Income Statement
For the year ending 31st December, 2015
Table 1: Income Statement
Sales revenue of the company has grown by £10,000 for 2015 as compare to the
previous year which is showing that the company has increased its promotional
activities which can be identified from the increase in distribution expenses also. Gross
profit of the company has also increased £9,900 in the year 2015 which shows a growth
of 1% only in overall. The percentage increase in the gross profit can be seen in table 2.
Ratio analysis 2015 2014
Gross Profit Margin 53.0% 52.0%
Operating profit margin 27.7% 26.8%
Table 2: Ratio analysis
Operating profit is showing the increase of £6,900 because the expenses have also
increased. Overall operating profit margin is 27.7% which is good as compare to the
previous year. The expenditure section in table 1 collectively shows the increase of
£3,000 out of which £2,000 is contributed by distribution and remaining £1,000 by
administration expense. The profit of the company is highly dominated by the sale which
is only showing the increase of £10,000. The increase in sales with the low amount is
showing a very little increase in the gross profit margin which can be identified in table
2. It is also noted that the company has spend too much on expenses which has cut
down the operating profit margin from 53% to only 27.7% which is only 52% of the gross
profit margin.
c) Overview of accounting fundamentals
Profit and cash are different in nature. Although they at times considered similar, but
there is a core difference between them. Profit of a firm is calculated after the deduction
of expenses from the sales amount and is reported in the income statement. It is useful
for the stakeholders attraction towards the company and fro the stability in the market
(Bodie, Kane and Marcus, 2014). However, cash is the amount which is hold by a
company for the continuation of its operational activities and is reported in the current
assets side of the financial position. Positive amount of cash is necessary because
negative amount of cash for too long can create a risk of liquidity (Weil, Schipper and
Francis, 2013).
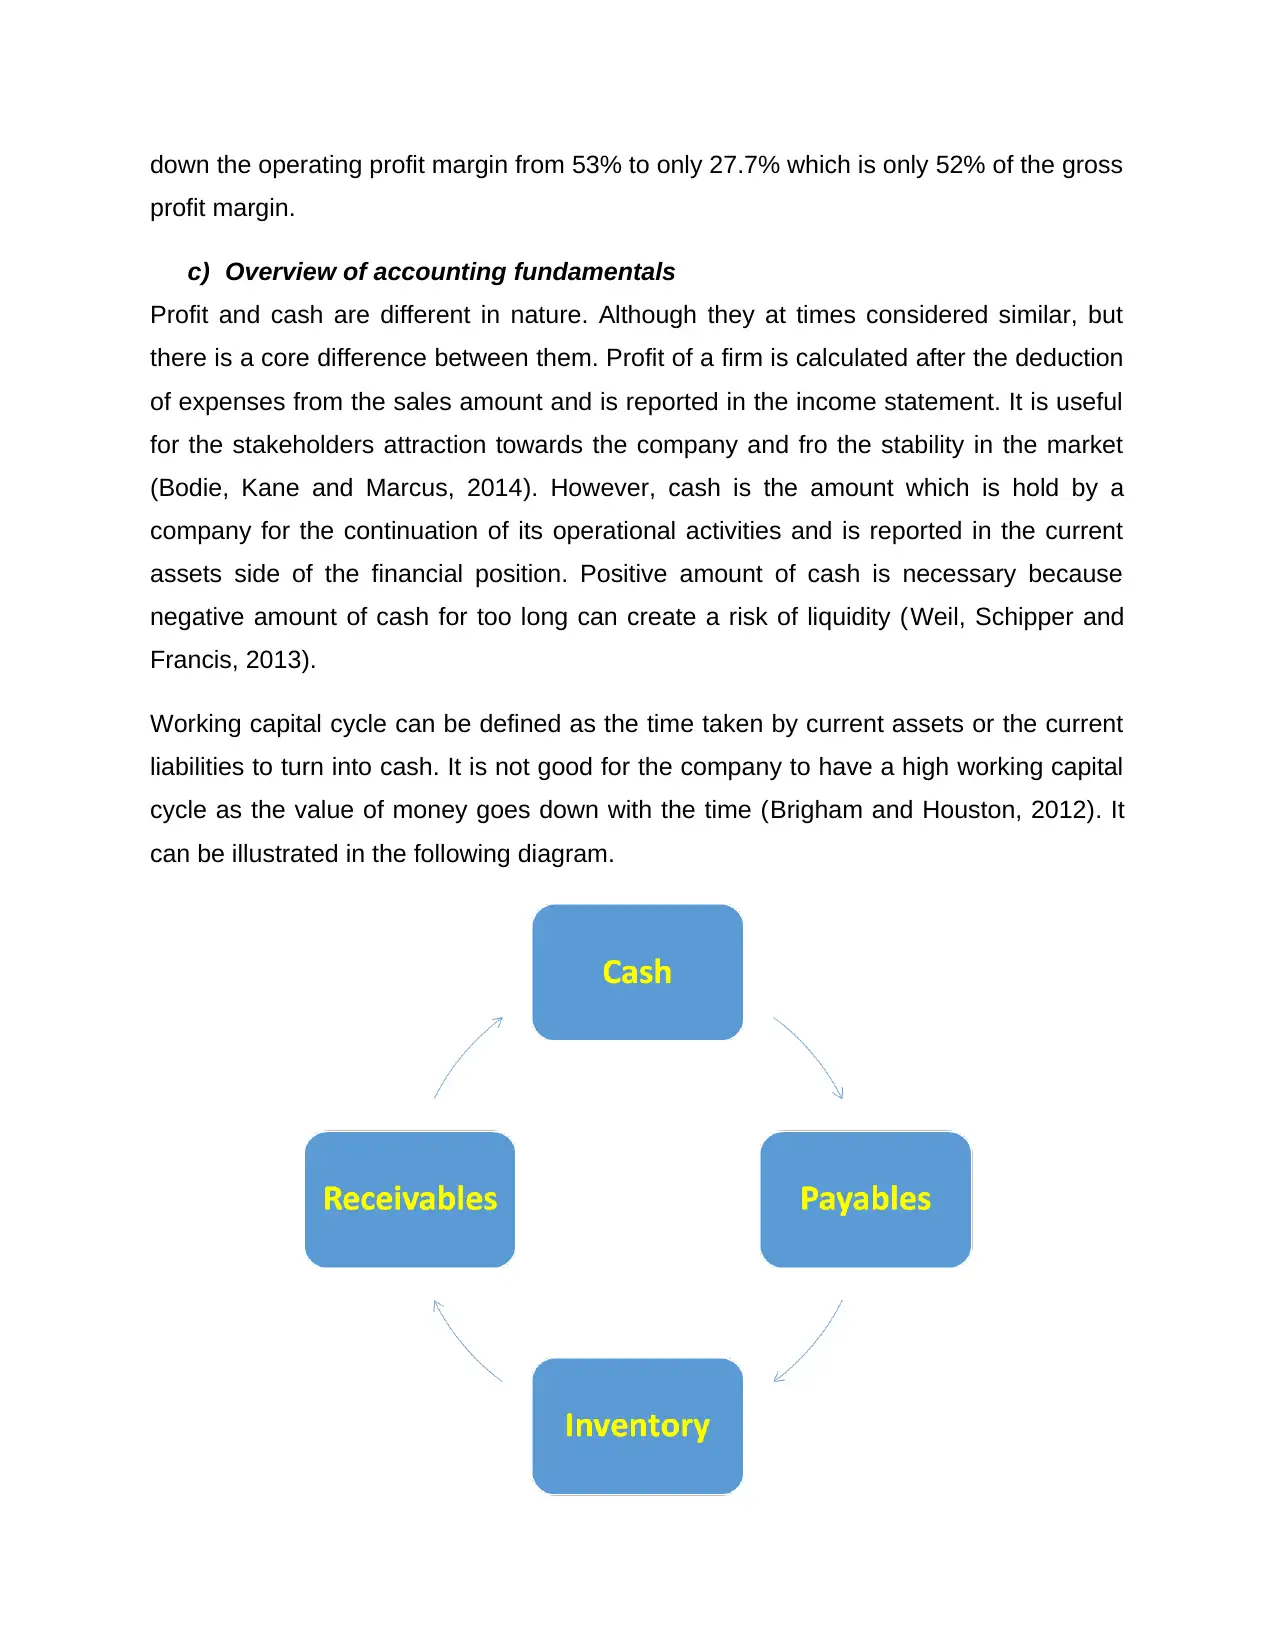
Working capital cycle can be defined as the time taken by current assets or the current
liabilities to turn into cash. It is not good for the company to have a high working capital
cycle as the value of money goes down with the time (Brigham and Houston, 2012). It
can be illustrated in the following diagram.
profit margin.
c) Overview of accounting fundamentals
Profit and cash are different in nature. Although they at times considered similar, but
there is a core difference between them. Profit of a firm is calculated after the deduction
of expenses from the sales amount and is reported in the income statement. It is useful
for the stakeholders attraction towards the company and fro the stability in the market
(Bodie, Kane and Marcus, 2014). However, cash is the amount which is hold by a
company for the continuation of its operational activities and is reported in the current
assets side of the financial position. Positive amount of cash is necessary because
negative amount of cash for too long can create a risk of liquidity (Weil, Schipper and
Francis, 2013).
Working capital cycle can be defined as the time taken by current assets or the current
liabilities to turn into cash. It is not good for the company to have a high working capital
cycle as the value of money goes down with the time (Brigham and Houston, 2012). It
can be illustrated in the following diagram.
⊘ This is a preview!⊘
Do you want full access?
Subscribe today to unlock all pages.
Trusted by 1+ million students worldwide
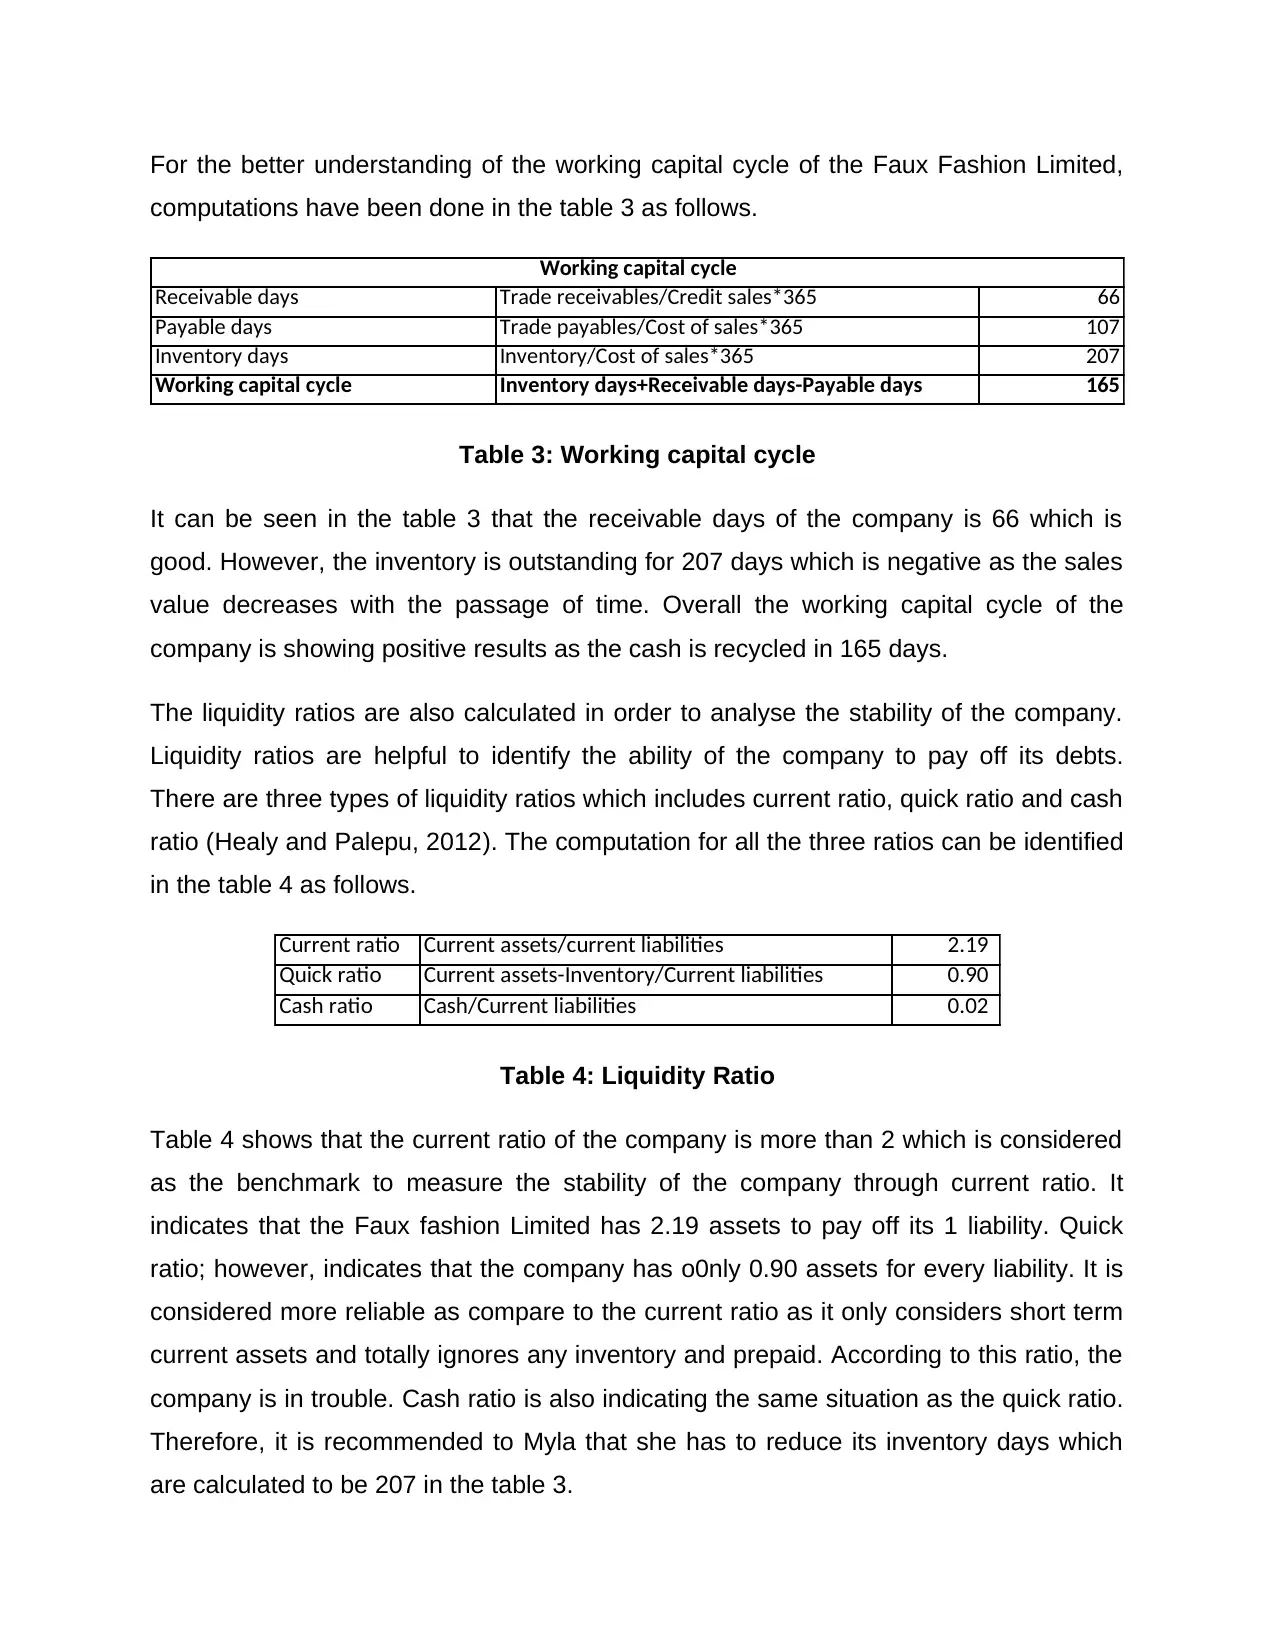
For the better understanding of the working capital cycle of the Faux Fashion Limited,
computations have been done in the table 3 as follows.
Receivable days Trade receivables/Credit sales*365 66
Payable days Trade payables/Cost of sales*365 107
Inventory days Inventory/Cost of sales*365 207
Working capital cycle Inventory days+Receivable days-Payable days 165
Working capital cycle
Table 3: Working capital cycle
It can be seen in the table 3 that the receivable days of the company is 66 which is
good. However, the inventory is outstanding for 207 days which is negative as the sales
value decreases with the passage of time. Overall the working capital cycle of the
company is showing positive results as the cash is recycled in 165 days.
The liquidity ratios are also calculated in order to analyse the stability of the company.
Liquidity ratios are helpful to identify the ability of the company to pay off its debts.
There are three types of liquidity ratios which includes current ratio, quick ratio and cash
ratio (Healy and Palepu, 2012). The computation for all the three ratios can be identified
in the table 4 as follows.
Current ratio Current assets/current liabilities 2.19
Quick ratio Current assets-Inventory/Current liabilities 0.90
Cash ratio Cash/Current liabilities 0.02
Table 4: Liquidity Ratio
Table 4 shows that the current ratio of the company is more than 2 which is considered
as the benchmark to measure the stability of the company through current ratio. It
indicates that the Faux fashion Limited has 2.19 assets to pay off its 1 liability. Quick
ratio; however, indicates that the company has o0nly 0.90 assets for every liability. It is
considered more reliable as compare to the current ratio as it only considers short term
current assets and totally ignores any inventory and prepaid. According to this ratio, the
company is in trouble. Cash ratio is also indicating the same situation as the quick ratio.
Therefore, it is recommended to Myla that she has to reduce its inventory days which
are calculated to be 207 in the table 3.
Paraphrase This Document
Need a fresh take? Get an instant paraphrase of this document with our AI Paraphraser
2) Costing and Pricing
a) Cost for single men’s black Faux leather jacket
Material cost 2 meter@£10 20£
1 zip @ £2 2£
Direct labour 1/2 hour@£8 per hour 4£
26£
Cost per unit
Total cost per unit
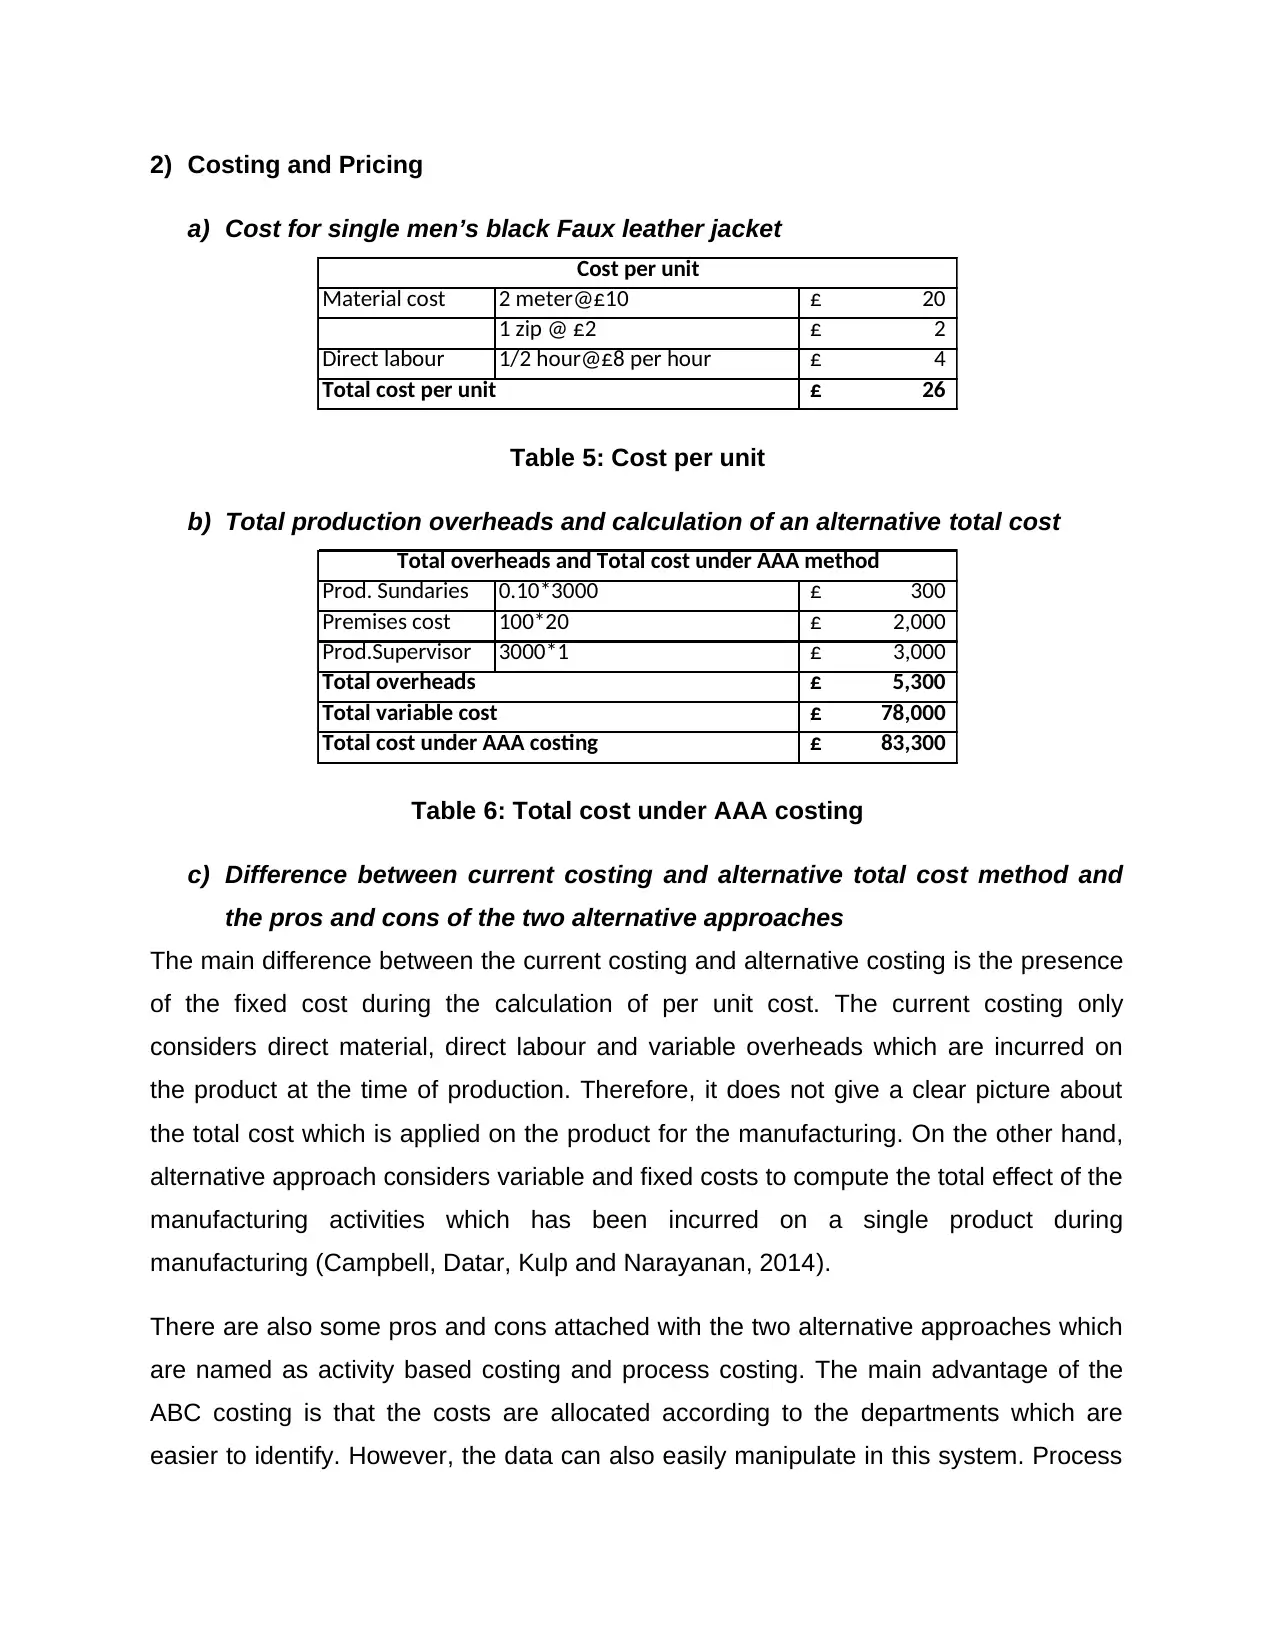
Table 5: Cost per unit
b) Total production overheads and calculation of an alternative total cost
Prod. Sundaries 0.10*3000 300£
Premises cost 100*20 2,000£
Prod.Supervisor 3000*1 3,000£
5,300£
78,000£
83,300£Total cost under AAA costing
Total overheads and Total cost under AAA method
Total overheads
Total variable cost
Table 6: Total cost under AAA costing
c) Difference between current costing and alternative total cost method and
the pros and cons of the two alternative approaches
The main difference between the current costing and alternative costing is the presence
of the fixed cost during the calculation of per unit cost. The current costing only
considers direct material, direct labour and variable overheads which are incurred on
the product at the time of production. Therefore, it does not give a clear picture about
the total cost which is applied on the product for the manufacturing. On the other hand,
alternative approach considers variable and fixed costs to compute the total effect of the
manufacturing activities which has been incurred on a single product during
manufacturing (Campbell, Datar, Kulp and Narayanan, 2014).
There are also some pros and cons attached with the two alternative approaches which
are named as activity based costing and process costing. The main advantage of the
ABC costing is that the costs are allocated according to the departments which are
easier to identify. However, the data can also easily manipulate in this system. Process
a) Cost for single men’s black Faux leather jacket
Material cost 2 meter@£10 20£
1 zip @ £2 2£
Direct labour 1/2 hour@£8 per hour 4£
26£
Cost per unit
Total cost per unit
Table 5: Cost per unit
b) Total production overheads and calculation of an alternative total cost
Prod. Sundaries 0.10*3000 300£
Premises cost 100*20 2,000£
Prod.Supervisor 3000*1 3,000£
5,300£
78,000£
83,300£Total cost under AAA costing
Total overheads and Total cost under AAA method
Total overheads
Total variable cost
Table 6: Total cost under AAA costing
c) Difference between current costing and alternative total cost method and
the pros and cons of the two alternative approaches
The main difference between the current costing and alternative costing is the presence
of the fixed cost during the calculation of per unit cost. The current costing only
considers direct material, direct labour and variable overheads which are incurred on
the product at the time of production. Therefore, it does not give a clear picture about
the total cost which is applied on the product for the manufacturing. On the other hand,
alternative approach considers variable and fixed costs to compute the total effect of the
manufacturing activities which has been incurred on a single product during
manufacturing (Campbell, Datar, Kulp and Narayanan, 2014).
There are also some pros and cons attached with the two alternative approaches which
are named as activity based costing and process costing. The main advantage of the
ABC costing is that the costs are allocated according to the departments which are
easier to identify. However, the data can also easily manipulate in this system. Process

costing is helpful as the amount is allocated to the units according to the number of
processes from which the product passes. It is easy to use. However, the allocation is
done on the basis of equivalent units which can decrease the reliability of results (Bodie
et al, 2014).
processes from which the product passes. It is easy to use. However, the allocation is
done on the basis of equivalent units which can decrease the reliability of results (Bodie
et al, 2014).
⊘ This is a preview!⊘
Do you want full access?
Subscribe today to unlock all pages.
Trusted by 1+ million students worldwide
3) Variance Analysis
a) Budget for April (using experienced labour)
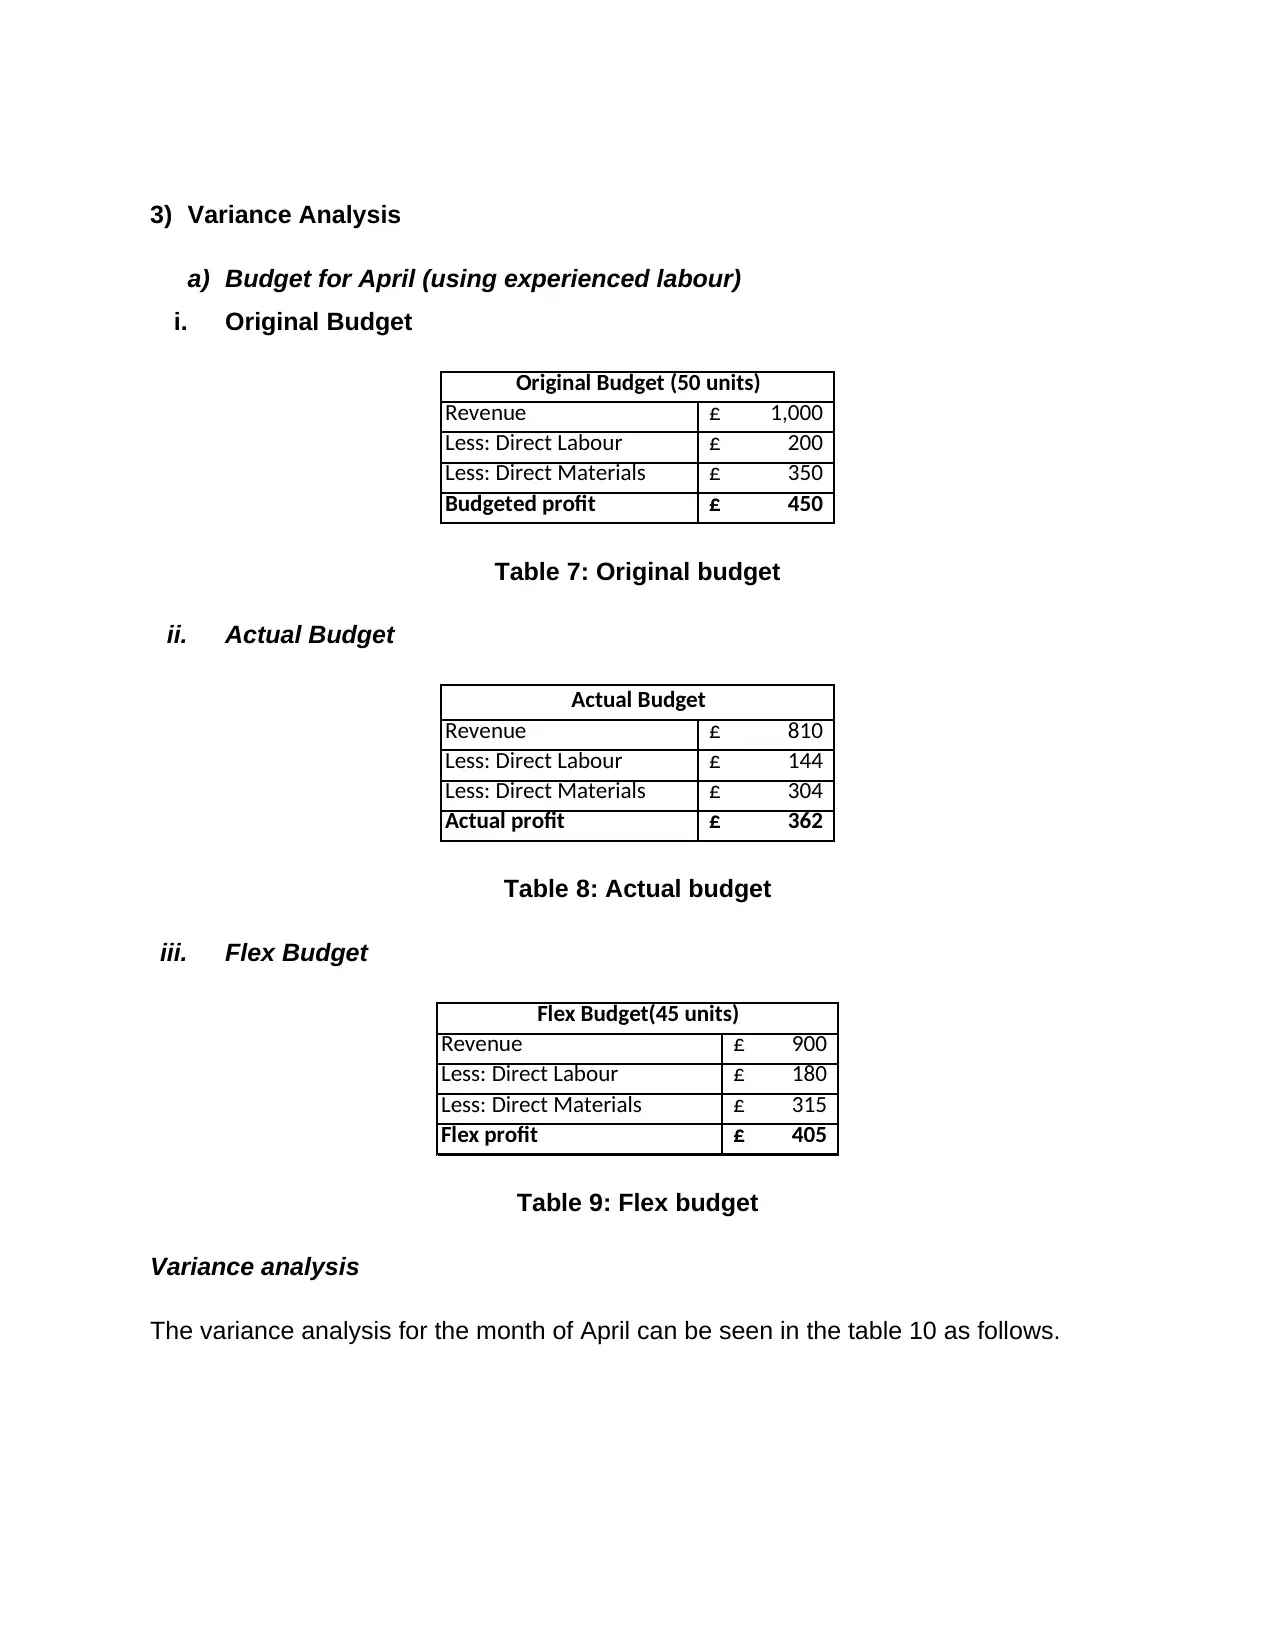
i. Original Budget
Revenue 1,000£
Less: Direct Labour 200£
Less: Direct Materials 350£
Budgeted profit 450£
Original Budget (50 units)
Table 7: Original budget
ii. Actual Budget
Revenue 810£
Less: Direct Labour 144£
Less: Direct Materials 304£
Actual profit 362£
Actual Budget
Table 8: Actual budget
iii. Flex Budget
Revenue 900£
Less: Direct Labour 180£
Less: Direct Materials 315£
Flex profit 405£
Flex Budget(45 units)
Table 9: Flex budget
Variance analysis
The variance analysis for the month of April can be seen in the table 10 as follows.
a) Budget for April (using experienced labour)
i. Original Budget
Revenue 1,000£
Less: Direct Labour 200£
Less: Direct Materials 350£
Budgeted profit 450£
Original Budget (50 units)
Table 7: Original budget
ii. Actual Budget
Revenue 810£
Less: Direct Labour 144£
Less: Direct Materials 304£
Actual profit 362£
Actual Budget
Table 8: Actual budget
iii. Flex Budget
Revenue 900£
Less: Direct Labour 180£
Less: Direct Materials 315£
Flex profit 405£
Flex Budget(45 units)
Table 9: Flex budget
Variance analysis
The variance analysis for the month of April can be seen in the table 10 as follows.
Paraphrase This Document
Need a fresh take? Get an instant paraphrase of this document with our AI Paraphraser
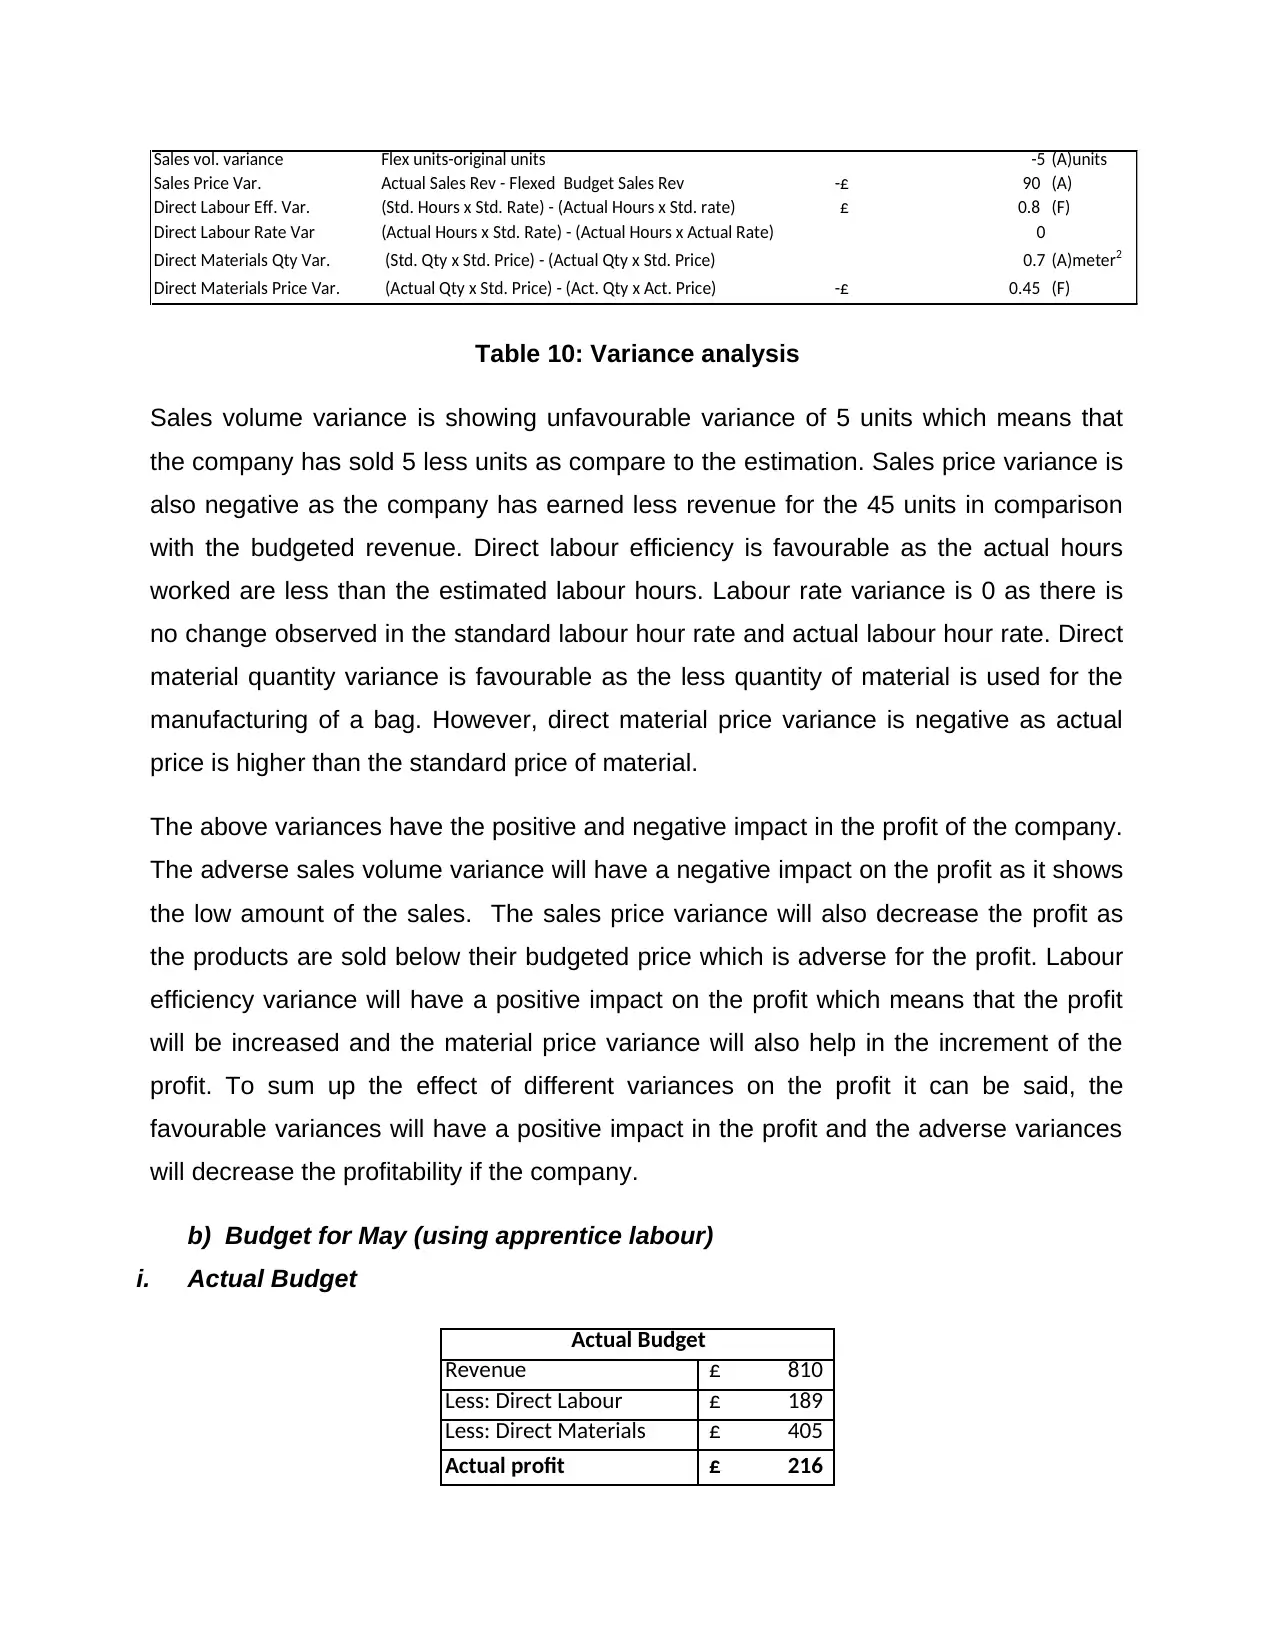
Sales vol. variance Flex units-original units -5 (A)units
Sales Price Var. Actual Sales Rev - Flexed Budget Sales Rev 90-£ (A)
Direct Labour Eff. Var. (Std. Hours x Std. Rate) - (Actual Hours x Std. rate) 0.8£ (F)
Direct Labour Rate Var (Actual Hours x Std. Rate) - (Actual Hours x Actual Rate) 0
Direct Materials Qty Var. (Std. Qty x Std. Price) - (Actual Qty x Std. Price) 0.7 (A)meter 2
Direct Materials Price Var. (Actual Qty x Std. Price) - (Act. Qty x Act. Price) 0.45-£ (F)
Table 10: Variance analysis
Sales volume variance is showing unfavourable variance of 5 units which means that
the company has sold 5 less units as compare to the estimation. Sales price variance is
also negative as the company has earned less revenue for the 45 units in comparison
with the budgeted revenue. Direct labour efficiency is favourable as the actual hours
worked are less than the estimated labour hours. Labour rate variance is 0 as there is
no change observed in the standard labour hour rate and actual labour hour rate. Direct
material quantity variance is favourable as the less quantity of material is used for the
manufacturing of a bag. However, direct material price variance is negative as actual
price is higher than the standard price of material.
The above variances have the positive and negative impact in the profit of the company.
The adverse sales volume variance will have a negative impact on the profit as it shows
the low amount of the sales. The sales price variance will also decrease the profit as
the products are sold below their budgeted price which is adverse for the profit. Labour
efficiency variance will have a positive impact on the profit which means that the profit
will be increased and the material price variance will also help in the increment of the
profit. To sum up the effect of different variances on the profit it can be said, the
favourable variances will have a positive impact in the profit and the adverse variances
will decrease the profitability if the company.
b) Budget for May (using apprentice labour)
i. Actual Budget
Revenue 810£
Less: Direct Labour 189£
Less: Direct Materials 405£
Actual profit 216£
Actual Budget
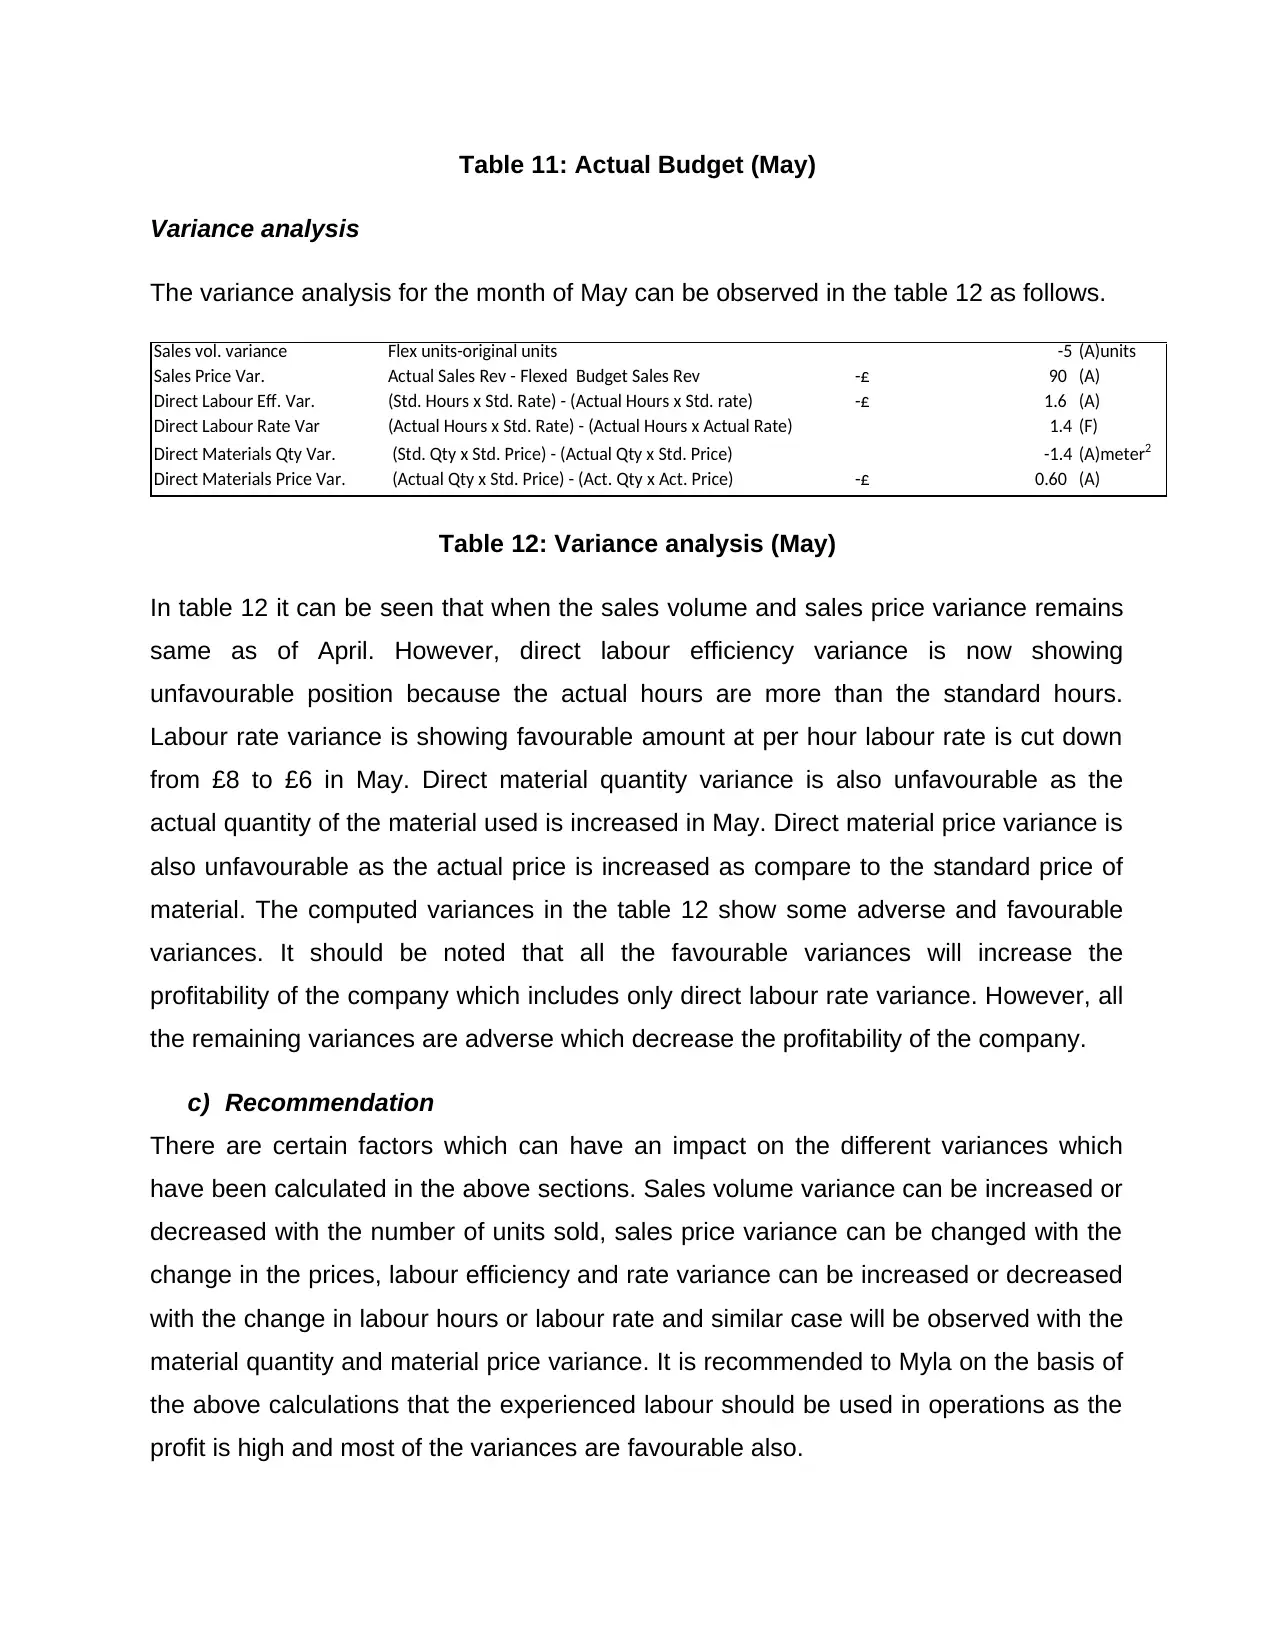
Table 11: Actual Budget (May)
Variance analysis
The variance analysis for the month of May can be observed in the table 12 as follows.
Sales vol. variance Flex units-original units -5 (A)units
Sales Price Var. Actual Sales Rev - Flexed Budget Sales Rev 90-£ (A)
Direct Labour Eff. Var. (Std. Hours x Std. Rate) - (Actual Hours x Std. rate) 1.6-£ (A)
Direct Labour Rate Var (Actual Hours x Std. Rate) - (Actual Hours x Actual Rate) 1.4 (F)
Direct Materials Qty Var. (Std. Qty x Std. Price) - (Actual Qty x Std. Price) -1.4 (A)meter 2
Direct Materials Price Var. (Actual Qty x Std. Price) - (Act. Qty x Act. Price) 0.60-£ (A)
Table 12: Variance analysis (May)
In table 12 it can be seen that when the sales volume and sales price variance remains
same as of April. However, direct labour efficiency variance is now showing
unfavourable position because the actual hours are more than the standard hours.
Labour rate variance is showing favourable amount at per hour labour rate is cut down
from £8 to £6 in May. Direct material quantity variance is also unfavourable as the
actual quantity of the material used is increased in May. Direct material price variance is
also unfavourable as the actual price is increased as compare to the standard price of
material. The computed variances in the table 12 show some adverse and favourable
variances. It should be noted that all the favourable variances will increase the
profitability of the company which includes only direct labour rate variance. However, all
the remaining variances are adverse which decrease the profitability of the company.
c) Recommendation
There are certain factors which can have an impact on the different variances which
have been calculated in the above sections. Sales volume variance can be increased or
decreased with the number of units sold, sales price variance can be changed with the
change in the prices, labour efficiency and rate variance can be increased or decreased
with the change in labour hours or labour rate and similar case will be observed with the
material quantity and material price variance. It is recommended to Myla on the basis of
the above calculations that the experienced labour should be used in operations as the
profit is high and most of the variances are favourable also.
⊘ This is a preview!⊘
Do you want full access?
Subscribe today to unlock all pages.
Trusted by 1+ million students worldwide
1 out of 19
Related Documents


Your All-in-One AI-Powered Toolkit for Academic Success.
+13062052269
info@desklib.com
Available 24*7 on WhatsApp / Email
![[object Object]](/_next/static/media/star-bottom.7253800d.svg)
Unlock your academic potential
Copyright © 2020–2026 A2Z Services. All Rights Reserved. Developed and managed by ZUCOL.