7SSMM100: Research Methods Assignment on FDI and Exports

Verified

Added on  2023/03/21

|14
|2496
|31
Report
AI Summary
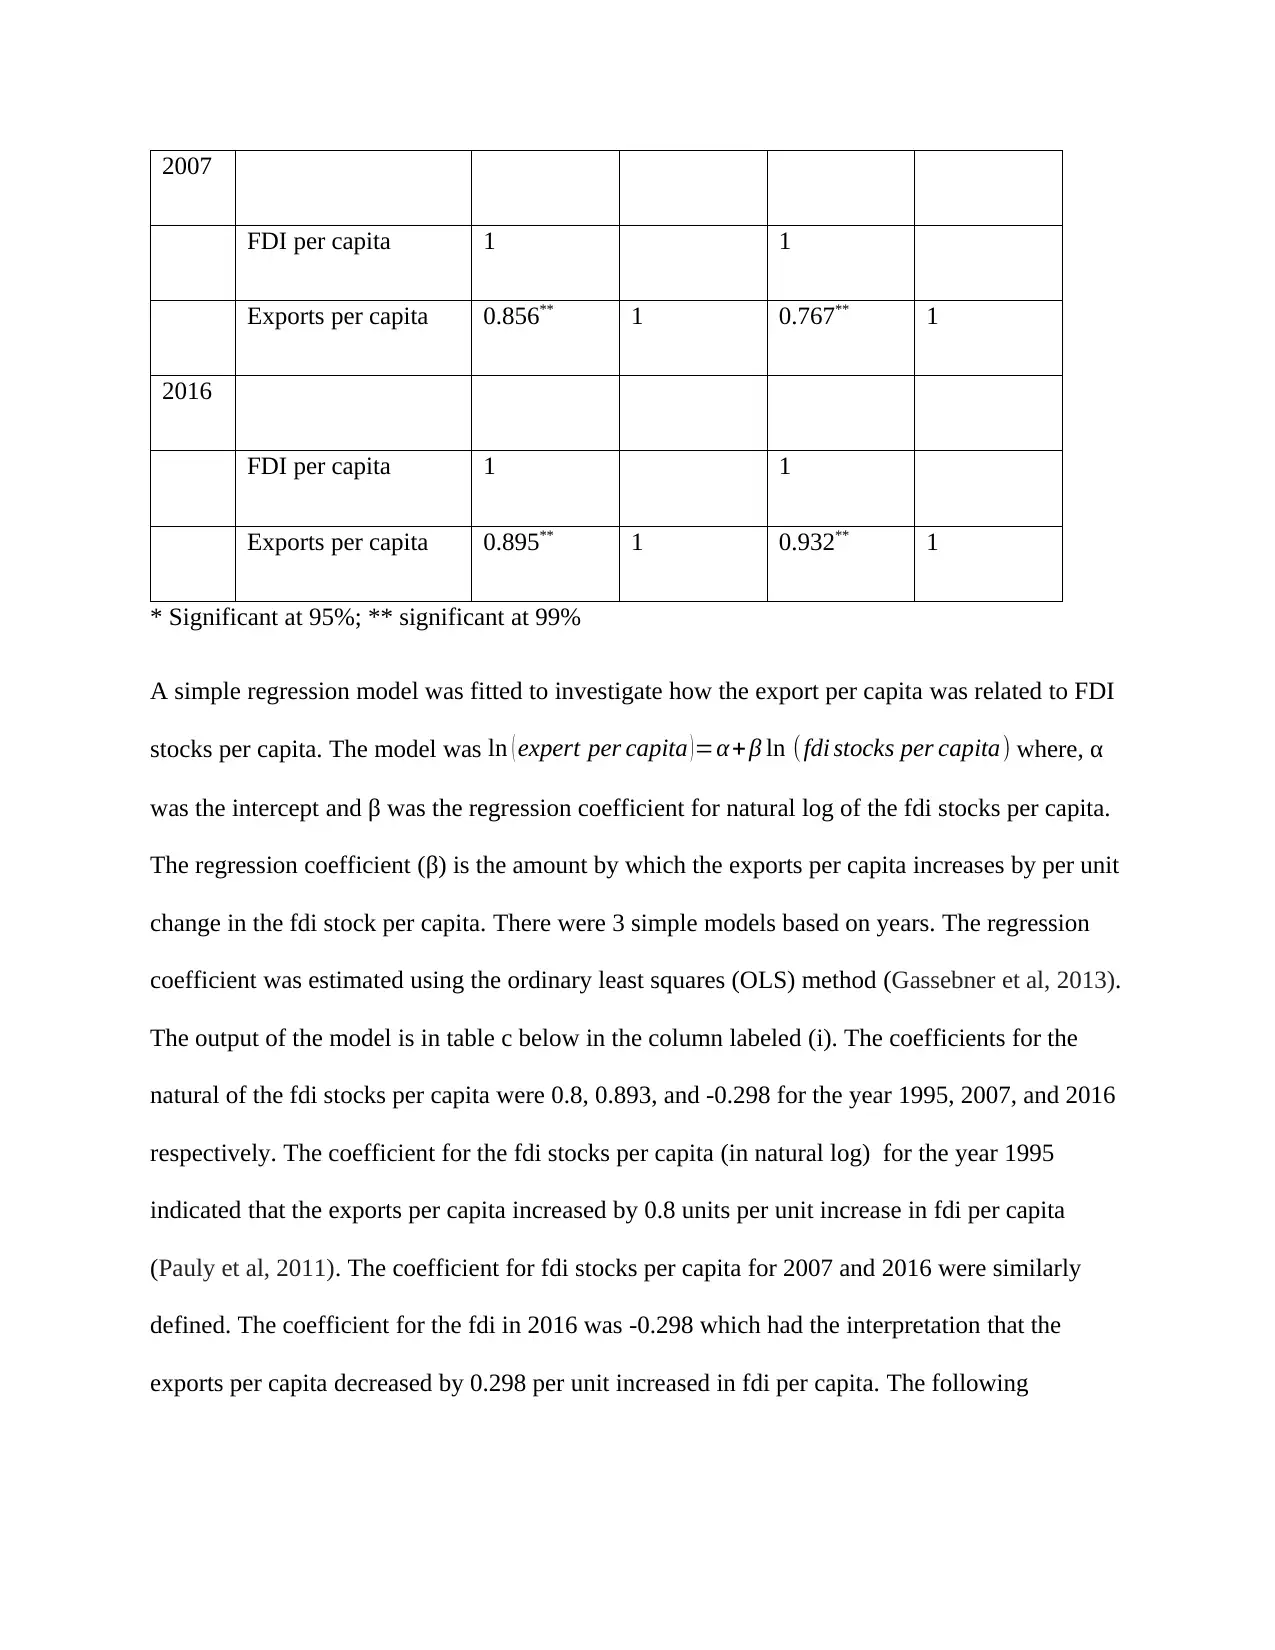
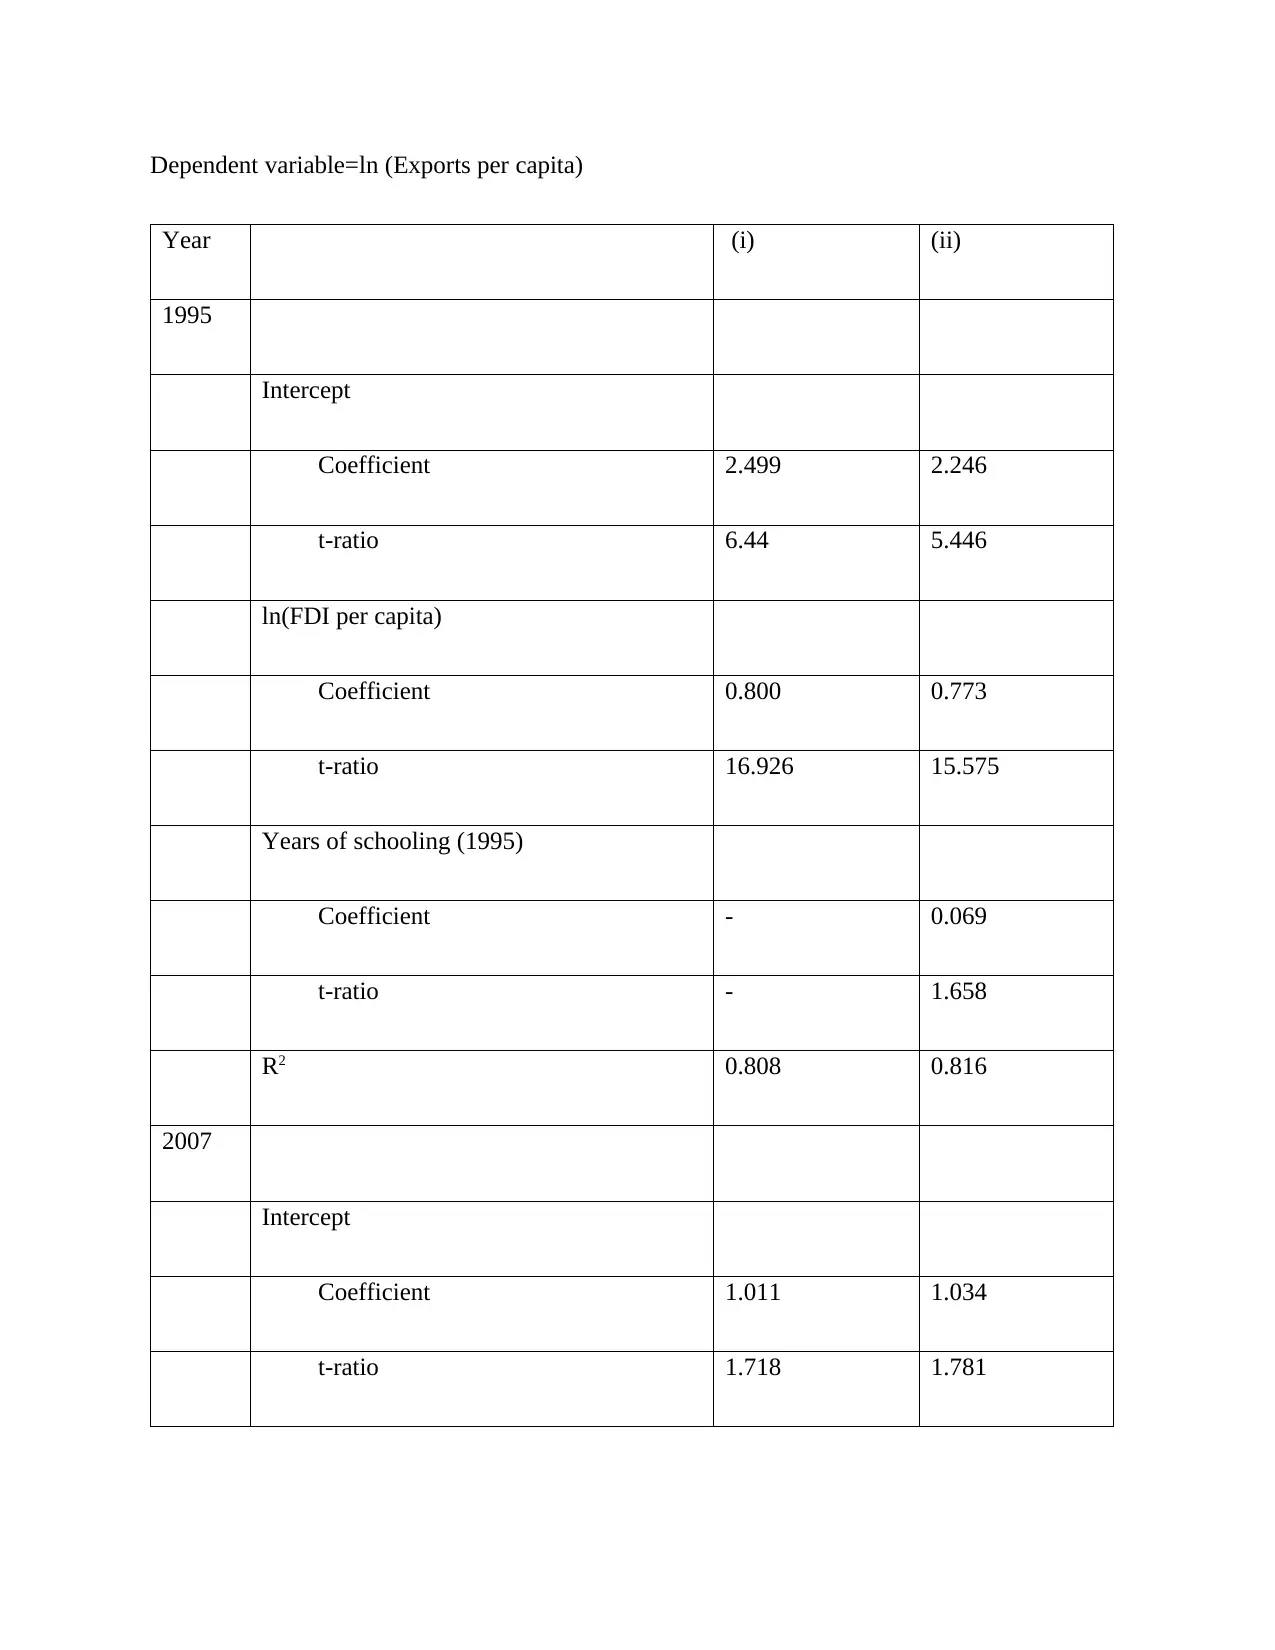
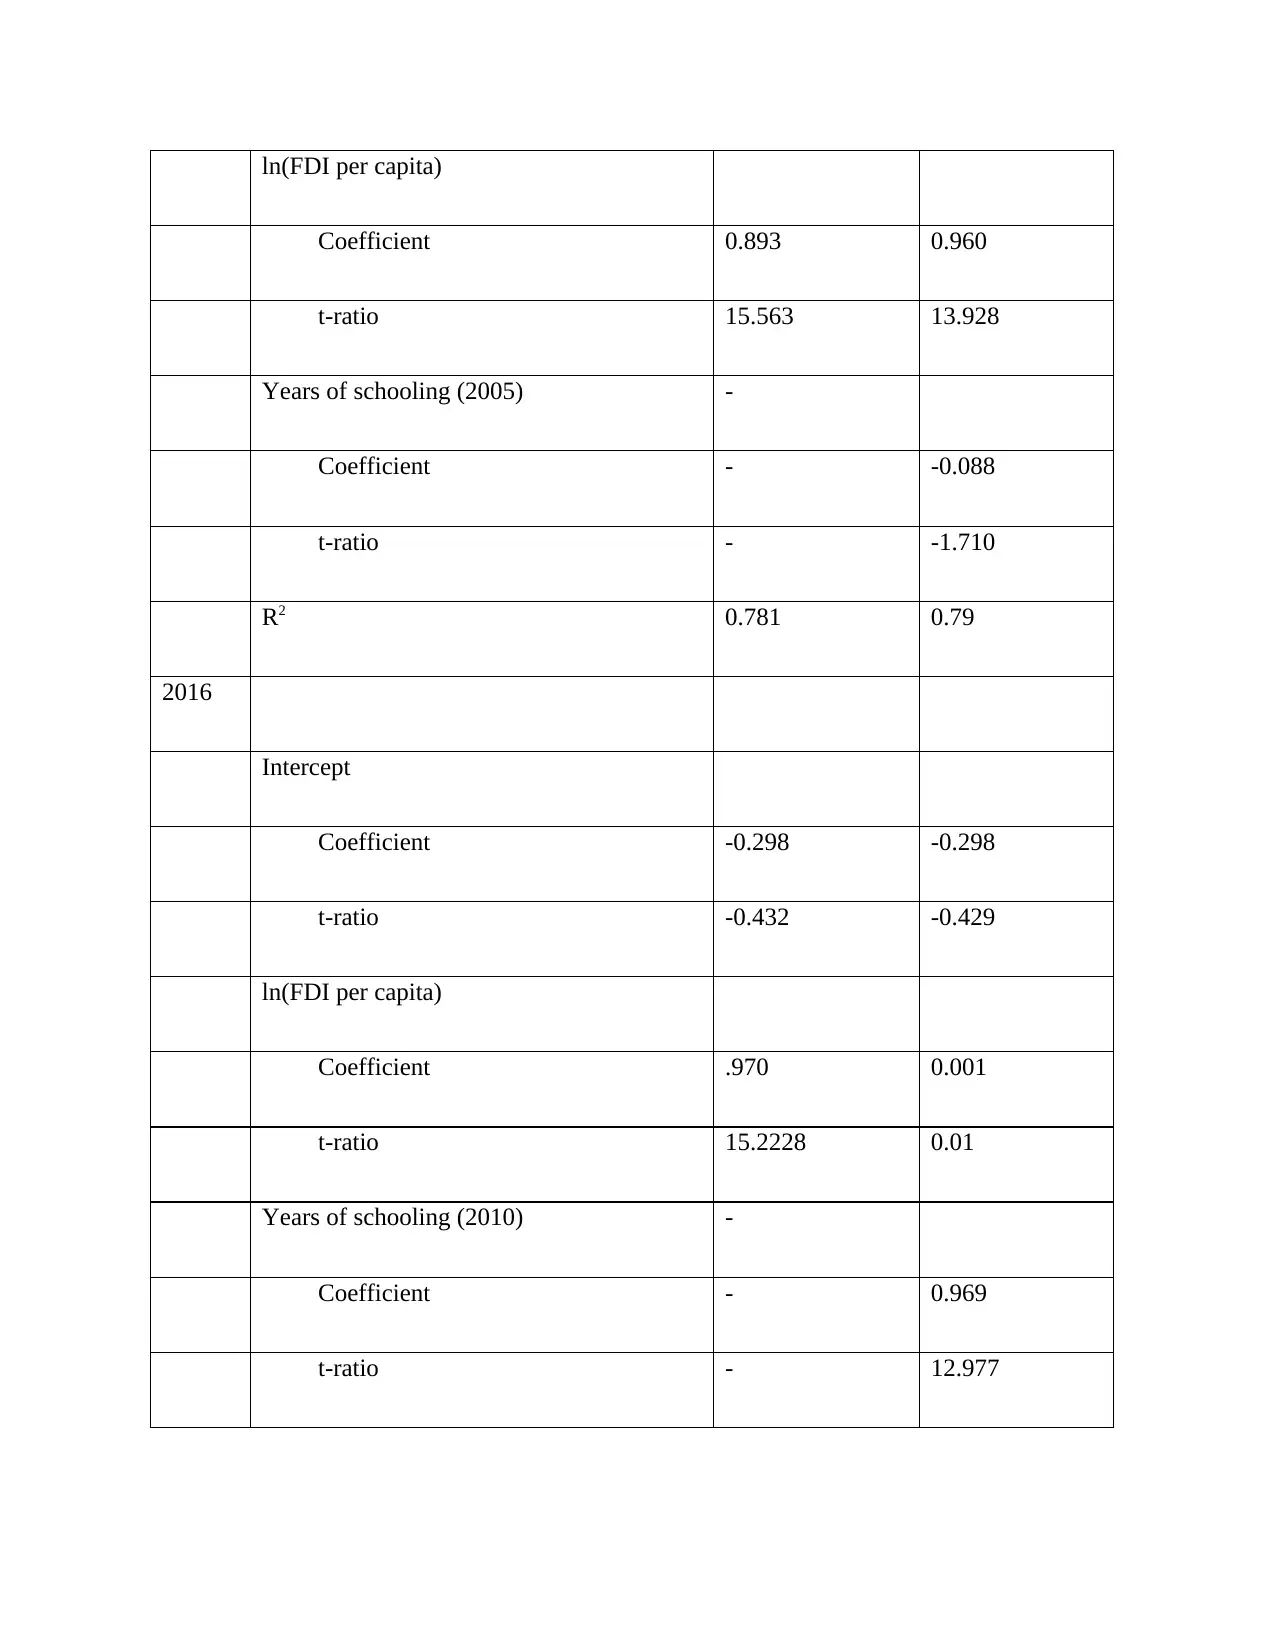
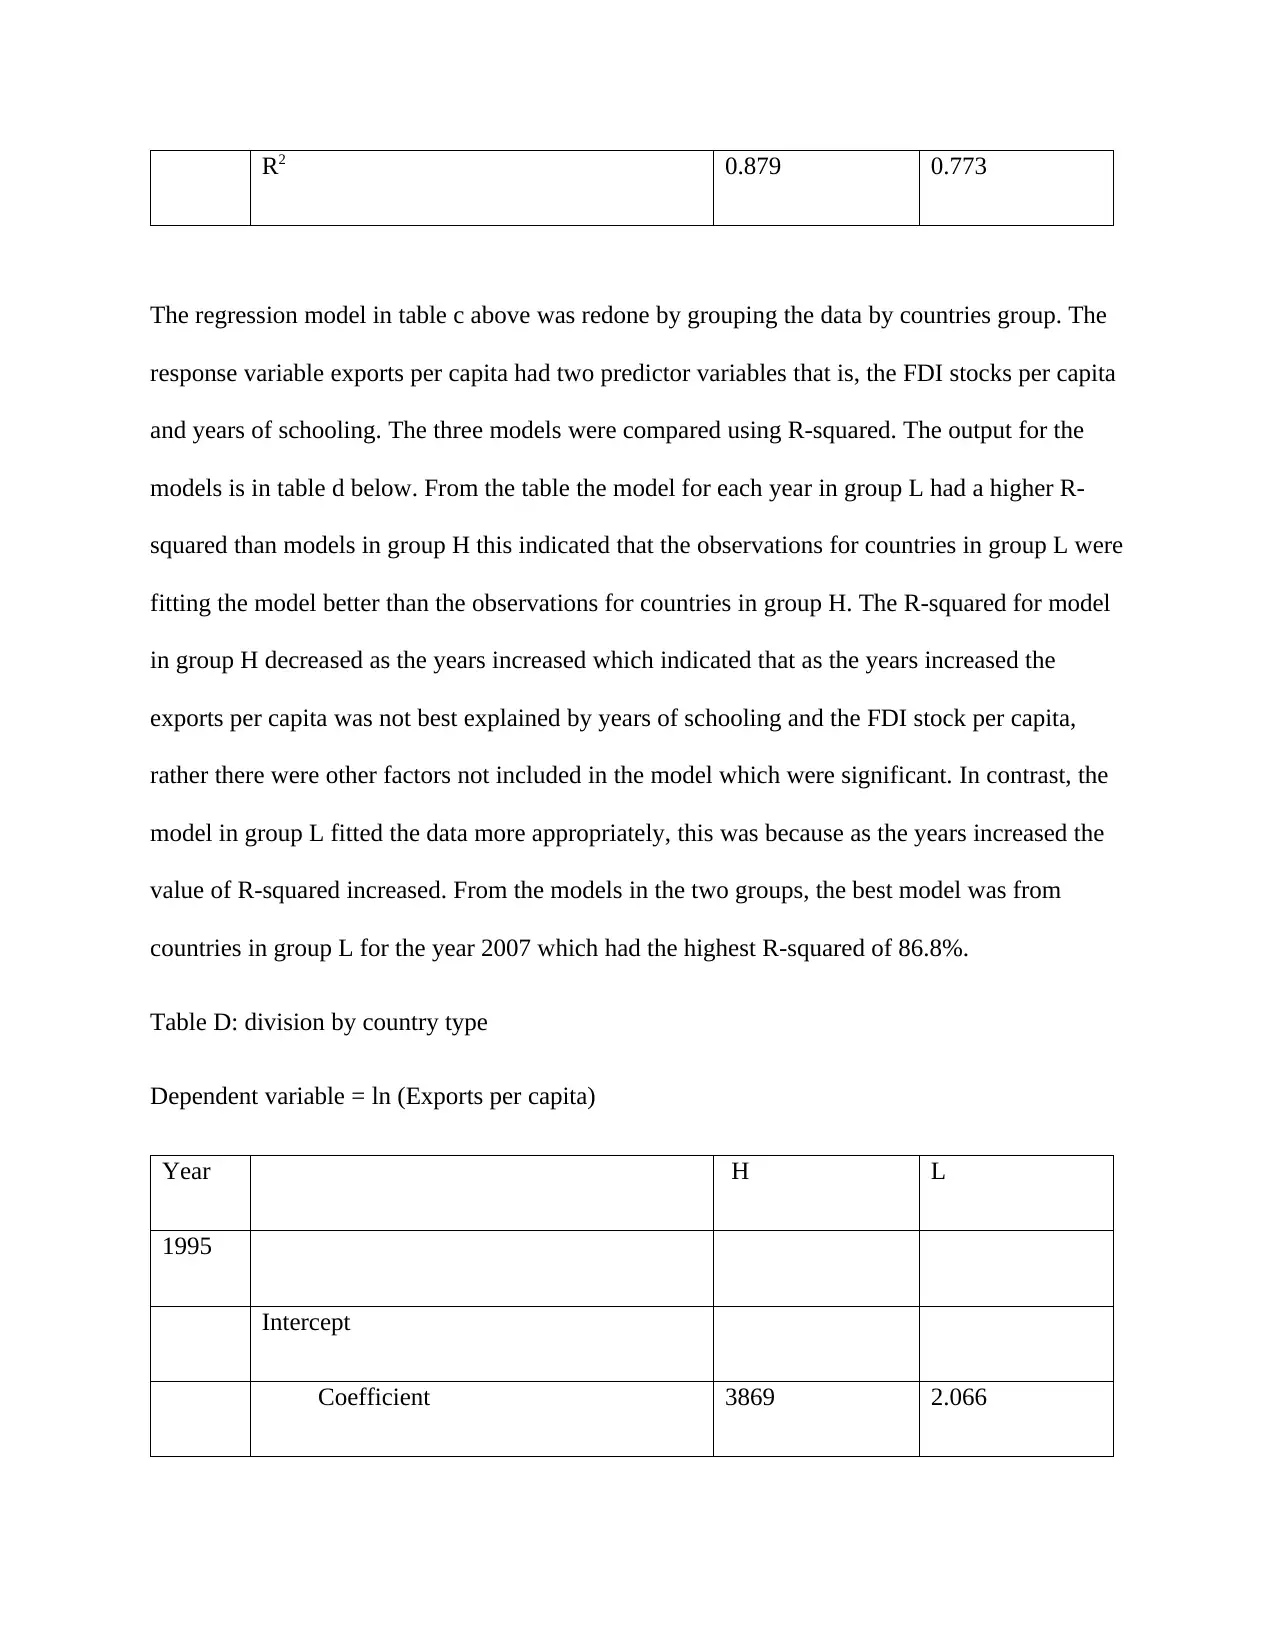
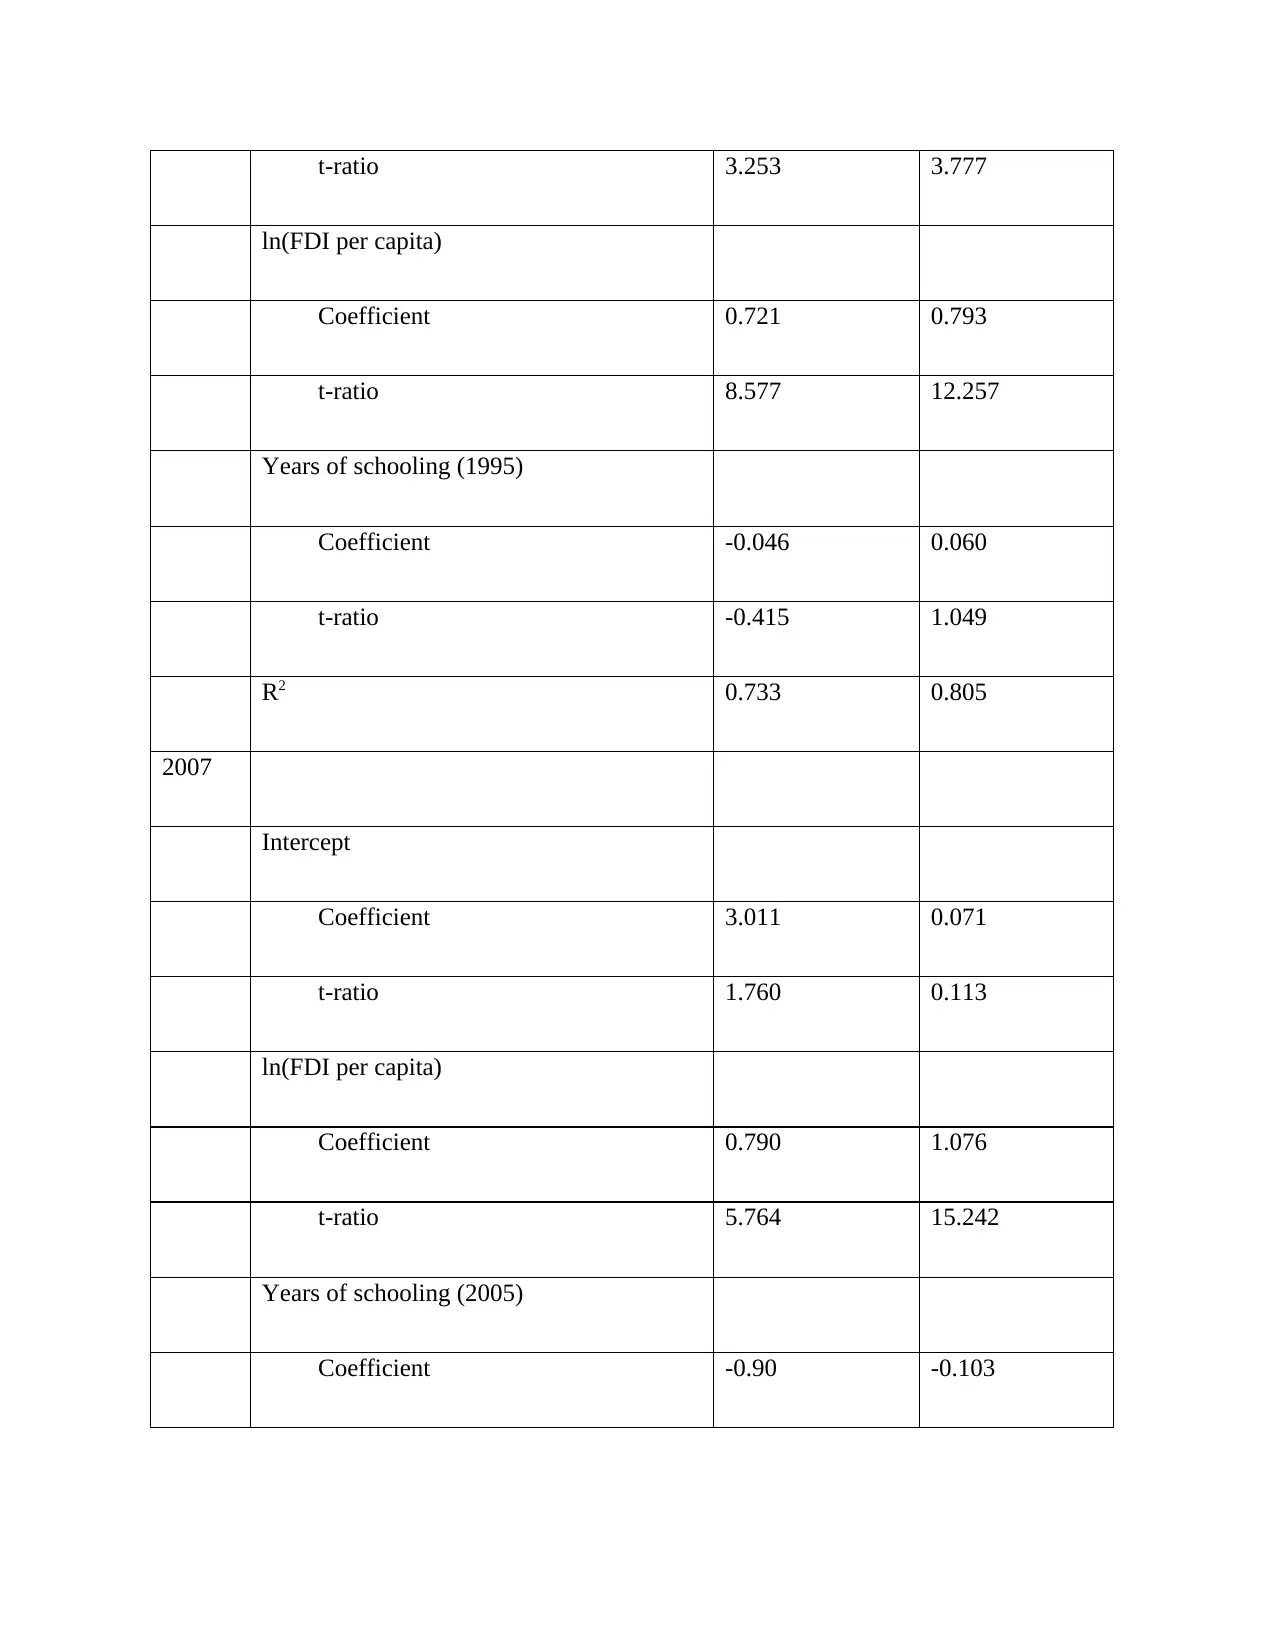
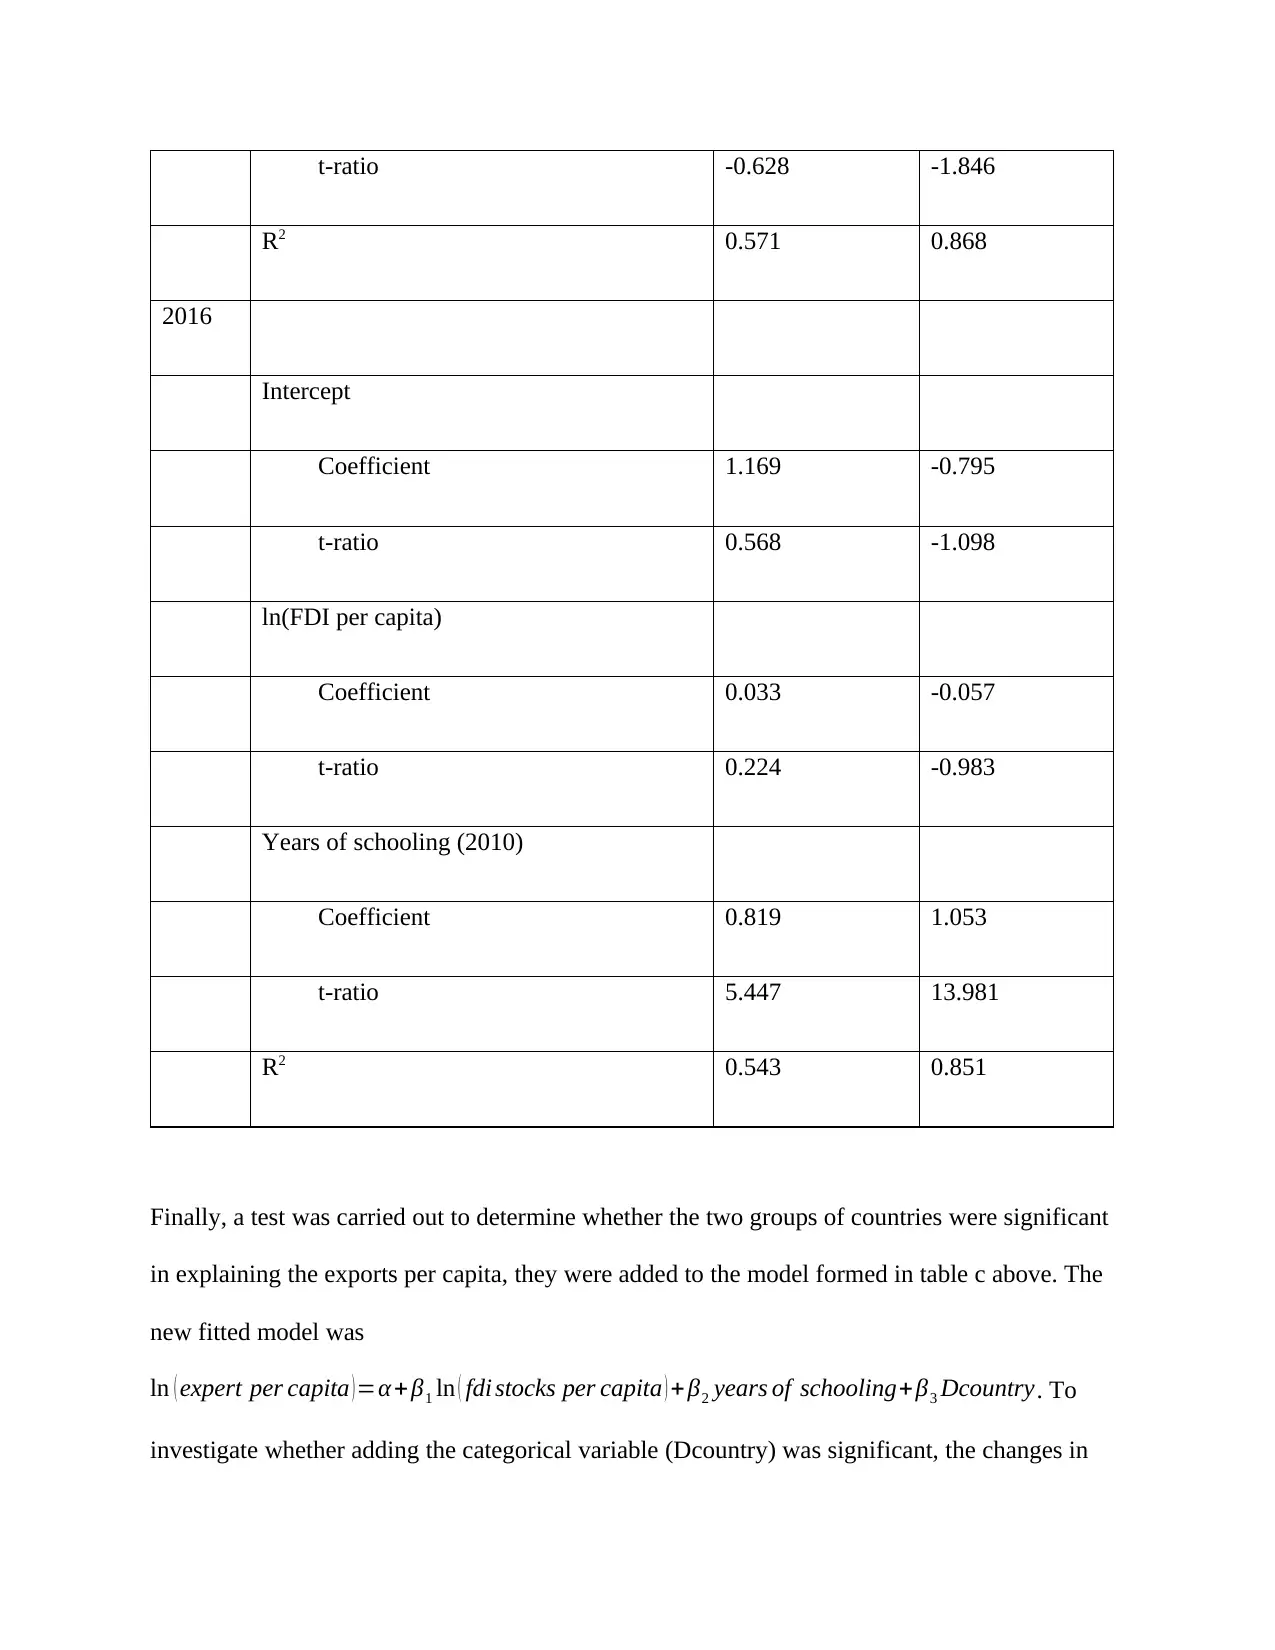
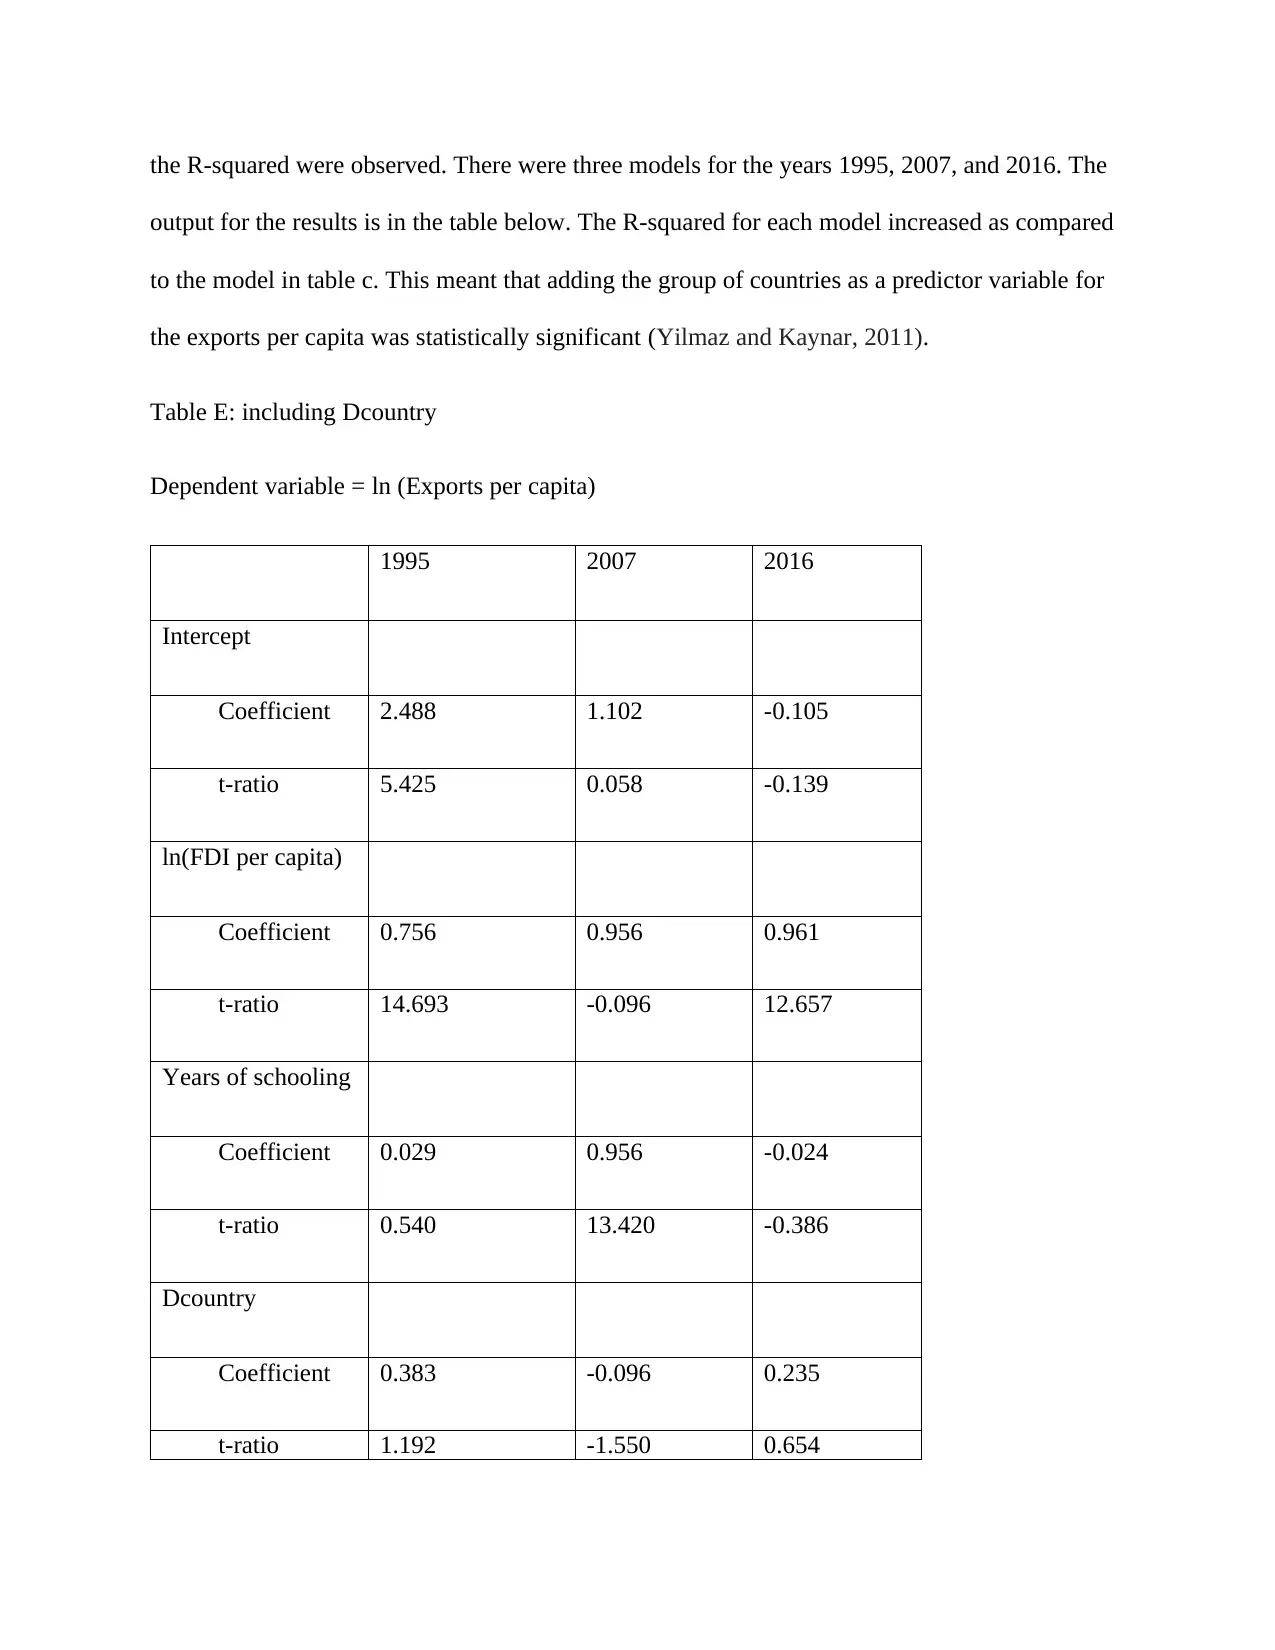
This report presents an analysis of the relationship between Foreign Direct Investment (FDI) and exports per capita. The analysis is based on statistical tests, including t-tests and correlation analysis, to determine if there are significant differences between countries in group H and group L regarding FDI stocks and exports per capita across three different years (1995, 2007, and 2016). The report also examines the correlation between FDI and exports per capita, both for the whole sample and divided into the country groups, revealing a strong positive linear relationship. Furthermore, the study employs regression models to assess the impact of FDI stocks per capita and years of schooling on exports per capita, both individually and combined. The findings indicate a significant relationship between FDI and exports, with varying degrees of influence across the years and country groups. The report concludes by evaluating the significance of country groups as a predictor variable in the regression models, demonstrating their impact on explaining exports per capita.
Document Page
Factors That Determine Exports Per Capita
A statistical test was carried out to determine whether average FDI stocks per capita differed
between countries in group H and group L based on the following hypothesis.
H0: the average FDI stocks per capita is the same for countries in group H and group L
Versus
H1: the mean of FDI stocks per capita differs between countries in group H and group L
The test was carried out at 5% level of significance. The test was performed separately for the
different years and the table below represents the output. From the table the p-values for the FDI
stock for the years 1995, 2007, and 2016 were less than 5% level of significance, thus, the null
hypothesis (H0) was rejected (Buckley et al, 2014). The conclusion of the test was that the
average FDI stock per capita differed between the countries in group H and group L.
To determine whether the average export per capita differed between countries in group H and
group L, the following hypothesis
H0: the average export per capita is the same for countries in group H and group L
Versus
H1: the average export per capita differs between countries in group H and group L
An independent t-test was carried out at 5% level of significance to test the above hypothesis.
The output of the test is in table A below. From the table, the mean exports for the year 1995 and
2007 had p-values which were less than 0.05 level of significance thus the null hypothesis was
rejected. Therefore, the mean export per capita was different in the countries of group h and
countries in group l for the year 1995 and the year 2007. However, from the table below the test
tabler-icon-diamond-filled.svg

Paraphrase This Document

Need a fresh take? Get an instant paraphrase of this document with our AI Paraphraser
Document Page
for the year 2016 had a p-value of 0.06 which is greater than 0.05 level of significance thus, the
null hypothesis was accepted (Gassebner et al, 2013). The conclusion of the test was that the
average exports for countries in group h and group l were different in 1995 and 2007 while in
2016 exports per capita was the same.
Table A: Hypothesis testing results
Year Mean H Mean L Mean
Difference
T-ratio Sig.
1995
FDI per capita 63150.83 6827.65 56323.183 1.928 0.058
Exports per
capita
80375.27 11667.3 68707.942 3.168 0.02
2007
FDI per capita 330744.43 38842.63 291901.903 2.705 0.09
Exports per
capita
190708.43 59961.33 130747.108 2.464 0.016
2016
FDI per capita 455966.33 92498.98 361467.358 2.705 0.06
Exports per
capita
198703.37 86208.23 112495.142 1.482 0.143
Document Page
A test for correlation was carried out to determine what kind of relationship existed between the
FDI stocks per capita and the exports per capita. The test involved FDI stocks and export per
capita for the period of 3 years. The results for the correlation are in table b below. From the
table, the correlation between FDI stocks per capita and exports per capita in 1995, 2007, and
2016 was 0.804, 0.724, and 0.704 respectively. All the correlation coefficients were close to one
and this indicated evidence of a strong positive linear relationship (Morelli et al, 2015). The
correlation coefficient for the two variable in 1995 was the highest. From the table, it's also clear
that the value of the correlation coefficient decreased as the years progressed. As a result, the
correlation coefficient between the two variables was highest in 1995 and was lowest in 2016.
From the table, the correlation between FDI stock per capita and exports per capita was
statistically significant in all the three years 99% level of significance.
Table B: Correlation table (whole sample)
Year FDI per
capita
Exports per
capita
1995
FDI per capita 1
Exports per capita 0.804** 1
2007
FDI per capita 1
Exports per capita 0.724** 1
Document Page
2016
FDI per capita 1
Exports per capita 0.704** 1
* Significant at 95%; ** significant at 99%
To investigate further the correlation between the FDI per capita and exports per capita, the test
for correlation was divided into the countries group. The output for the test is in the table below.
From the table, the correlation for both group h and group l was close to one which indicated
evidence of strong positive correlation. All the correlation were also statistically significant at a
99% confidence level (Yilmaz and Kaynar, 2011). Additionally, the results in the table below
indicated that the correlation between FDI stocks per capita and exports per capita was higher for
countries in group L than the correlation for countries in group H. The correlation between the
two variables increased for countries in group H as the years progressed while the correlation
between exports per capita and stock per capita decreased with the progress in years.
Table B (correlation by the country group)
Group H Group L
FDI per
capita
Exports per
capita
FDI per
capita
Exports per
capita
1995
FDI per capita 1 1
Exports per capita 0.796** 1 0.945** 1
tabler-icon-diamond-filled.svg

Paraphrase This Document

Need a fresh take? Get an instant paraphrase of this document with our AI Paraphraser
Document Page
2007
FDI per capita 1 1
Exports per capita 0.856** 1 0.767** 1
2016
FDI per capita 1 1
Exports per capita 0.895** 1 0.932** 1
* Significant at 95%; ** significant at 99%
A simple regression model was fitted to investigate how the export per capita was related to FDI
stocks per capita. The model was ln ( expert per capita ) =α + β ln (fdi stocks per capita) where, α
was the intercept and β was the regression coefficient for natural log of the fdi stocks per capita.
The regression coefficient (β) is the amount by which the exports per capita increases by per unit
change in the fdi stock per capita. There were 3 simple models based on years. The regression
coefficient was estimated using the ordinary least squares (OLS) method (Gassebner et al, 2013).
The output of the model is in table c below in the column labeled (i). The coefficients for the
natural of the fdi stocks per capita were 0.8, 0.893, and -0.298 for the year 1995, 2007, and 2016
respectively. The coefficient for the fdi stocks per capita (in natural log) for the year 1995
indicated that the exports per capita increased by 0.8 units per unit increase in fdi per capita
(Pauly et al, 2011). The coefficient for fdi stocks per capita for 2007 and 2016 were similarly
defined. The coefficient for the fdi in 2016 was -0.298 which had the interpretation that the
exports per capita decreased by 0.298 per unit increased in fdi per capita. The following
Document Page
hypothesis was used to test whether there fdi stocks per capita was significant in explaining the
exports per capita.
H0: there is no association between the exports per capita and the FDI stocks per capita
Versus
H1: there is an association between the exports per capita and the FDI stocks per capita.
The test had p-value which was less than 0.05 level of significance for all the years and thus the
null hypothesis was rejected. This lead to the conclusion that there was a relationship between
the response variable and the predictor variable. The regression model for the year 2016 had the
highest R-squared 0f 89.8% indicating that this was the best model (Pauly et al, 2011). This
indicated that 89.8 variability of the model was explained by the FDI sticks per capita.
A multiple linear regression model was fitted to investigate how the exports per capita were
associated with the FDI stocks per capita and years of schooling. The model was of the form
ln ( expert per capita ) =α + β1 ln ( fdi stocks per capita ) + β2 years of schooling where α was the
intercept and β1 and β2 were the coefficients of the predictor variables. The output of the model is
in table c below in column labeled (ii) for the years 1995, 2007, and 2016. From output the
model for the year 1995 had the highest R-squared of 81.6%. this indicated that its greater
variability had been explained by the predictor variables in the model. considering also the R-
square for the other models, their values decreased as the years increased. This meant that in
future fitting the exports per capita using fdi stocks per capita and years of schooling could fit the
model poorly which as an indication that, as the years progressed there are other variables that
affect the exports per capita rather than the two predictor variables.
Table C: Total sample
Document Page
Dependent variable=ln (Exports per capita)
Year (i) (ii)
1995
Intercept
Coefficient 2.499 2.246
t-ratio 6.44 5.446
ln(FDI per capita)
Coefficient 0.800 0.773
t-ratio 16.926 15.575
Years of schooling (1995)
Coefficient - 0.069
t-ratio - 1.658
R2 0.808 0.816
2007
Intercept
Coefficient 1.011 1.034
t-ratio 1.718 1.781
tabler-icon-diamond-filled.svg

Paraphrase This Document

Need a fresh take? Get an instant paraphrase of this document with our AI Paraphraser
Document Page
ln(FDI per capita)
Coefficient 0.893 0.960
t-ratio 15.563 13.928
Years of schooling (2005) -
Coefficient - -0.088
t-ratio - -1.710
R2 0.781 0.79
2016
Intercept
Coefficient -0.298 -0.298
t-ratio -0.432 -0.429
ln(FDI per capita)
Coefficient .970 0.001
t-ratio 15.2228 0.01
Years of schooling (2010) -
Coefficient - 0.969
t-ratio - 12.977
Document Page
R2 0.879 0.773
The regression model in table c above was redone by grouping the data by countries group. The
response variable exports per capita had two predictor variables that is, the FDI stocks per capita
and years of schooling. The three models were compared using R-squared. The output for the
models is in table d below. From the table the model for each year in group L had a higher R-
squared than models in group H this indicated that the observations for countries in group L were
fitting the model better than the observations for countries in group H. The R-squared for model
in group H decreased as the years increased which indicated that as the years increased the
exports per capita was not best explained by years of schooling and the FDI stock per capita,
rather there were other factors not included in the model which were significant. In contrast, the
model in group L fitted the data more appropriately, this was because as the years increased the
value of R-squared increased. From the models in the two groups, the best model was from
countries in group L for the year 2007 which had the highest R-squared of 86.8%.
Table D: division by country type
Dependent variable = ln (Exports per capita)
Year H L
1995
Intercept
Coefficient 3869 2.066
Document Page
t-ratio 3.253 3.777
ln(FDI per capita)
Coefficient 0.721 0.793
t-ratio 8.577 12.257
Years of schooling (1995)
Coefficient -0.046 0.060
t-ratio -0.415 1.049
R2 0.733 0.805
2007
Intercept
Coefficient 3.011 0.071
t-ratio 1.760 0.113
ln(FDI per capita)
Coefficient 0.790 1.076
t-ratio 5.764 15.242
Years of schooling (2005)
Coefficient -0.90 -0.103
tabler-icon-diamond-filled.svg

Paraphrase This Document

Need a fresh take? Get an instant paraphrase of this document with our AI Paraphraser
Document Page
t-ratio -0.628 -1.846
R2 0.571 0.868
2016
Intercept
Coefficient 1.169 -0.795
t-ratio 0.568 -1.098
ln(FDI per capita)
Coefficient 0.033 -0.057
t-ratio 0.224 -0.983
Years of schooling (2010)
Coefficient 0.819 1.053
t-ratio 5.447 13.981
R2 0.543 0.851
Finally, a test was carried out to determine whether the two groups of countries were significant
in explaining the exports per capita, they were added to the model formed in table c above. The
new fitted model was
ln ( expert per capita )=α + β1 ln ( fdi stocks per capita ) + β2 years of schooling+ β3 Dcountry. To
investigate whether adding the categorical variable (Dcountry) was significant, the changes in
Document Page
the R-squared were observed. There were three models for the years 1995, 2007, and 2016. The
output for the results is in the table below. The R-squared for each model increased as compared
to the model in table c. This meant that adding the group of countries as a predictor variable for
the exports per capita was statistically significant (Yilmaz and Kaynar, 2011).
Table E: including Dcountry
Dependent variable = ln (Exports per capita)
1995 2007 2016
Intercept
Coefficient 2.488 1.102 -0.105
t-ratio 5.425 0.058 -0.139
ln(FDI per capita)
Coefficient 0.756 0.956 0.961
t-ratio 14.693 -0.096 12.657
Years of schooling
Coefficient 0.029 0.956 -0.024
t-ratio 0.540 13.420 -0.386
Dcountry
Coefficient 0.383 -0.096 0.235
t-ratio 1.192 -1.550 0.654
chevron_up_icon
1 out of 14
circle_padding
hide_on_mobile
zoom_out_icon
[object Object]