Report: Comparative Analysis of FDI and GDP Growth in the UK and World
VerifiedAdded on 2020/06/03
|7
|733
|48
Report
AI Summary
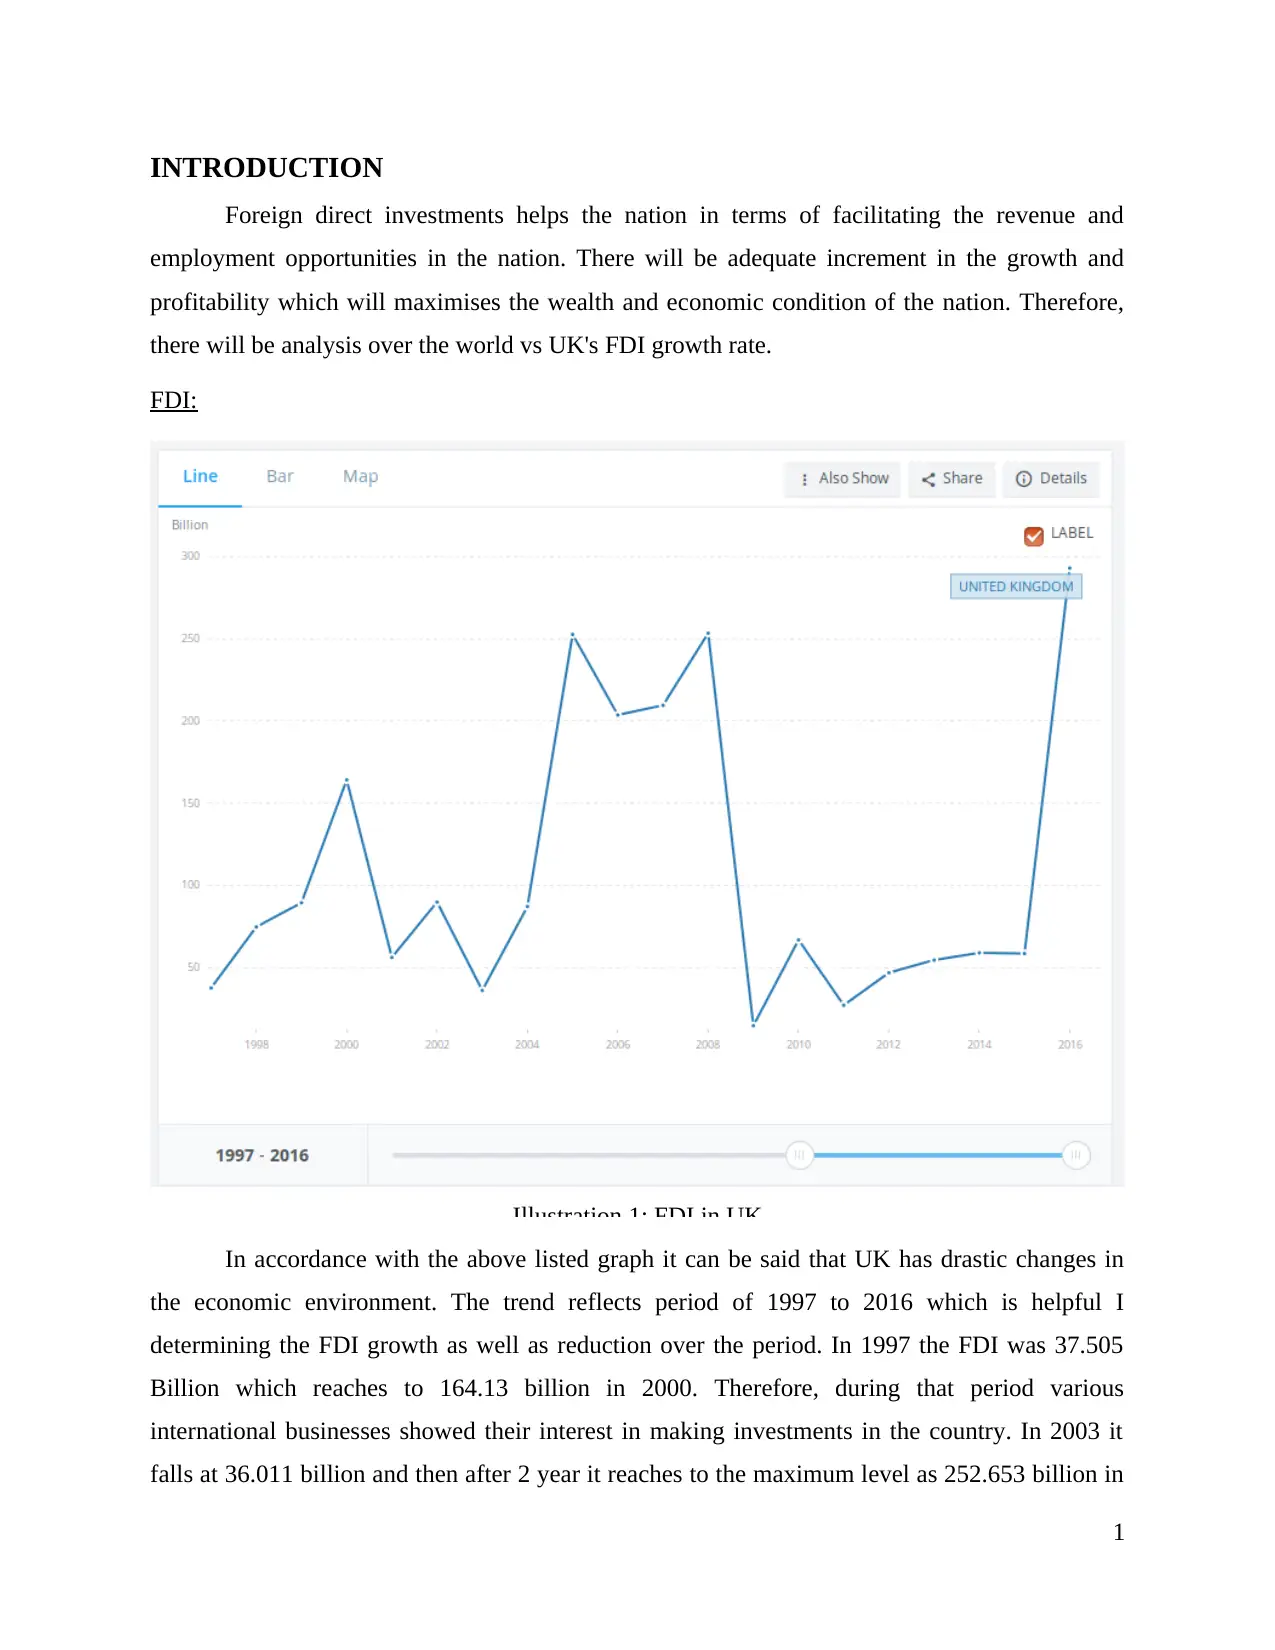
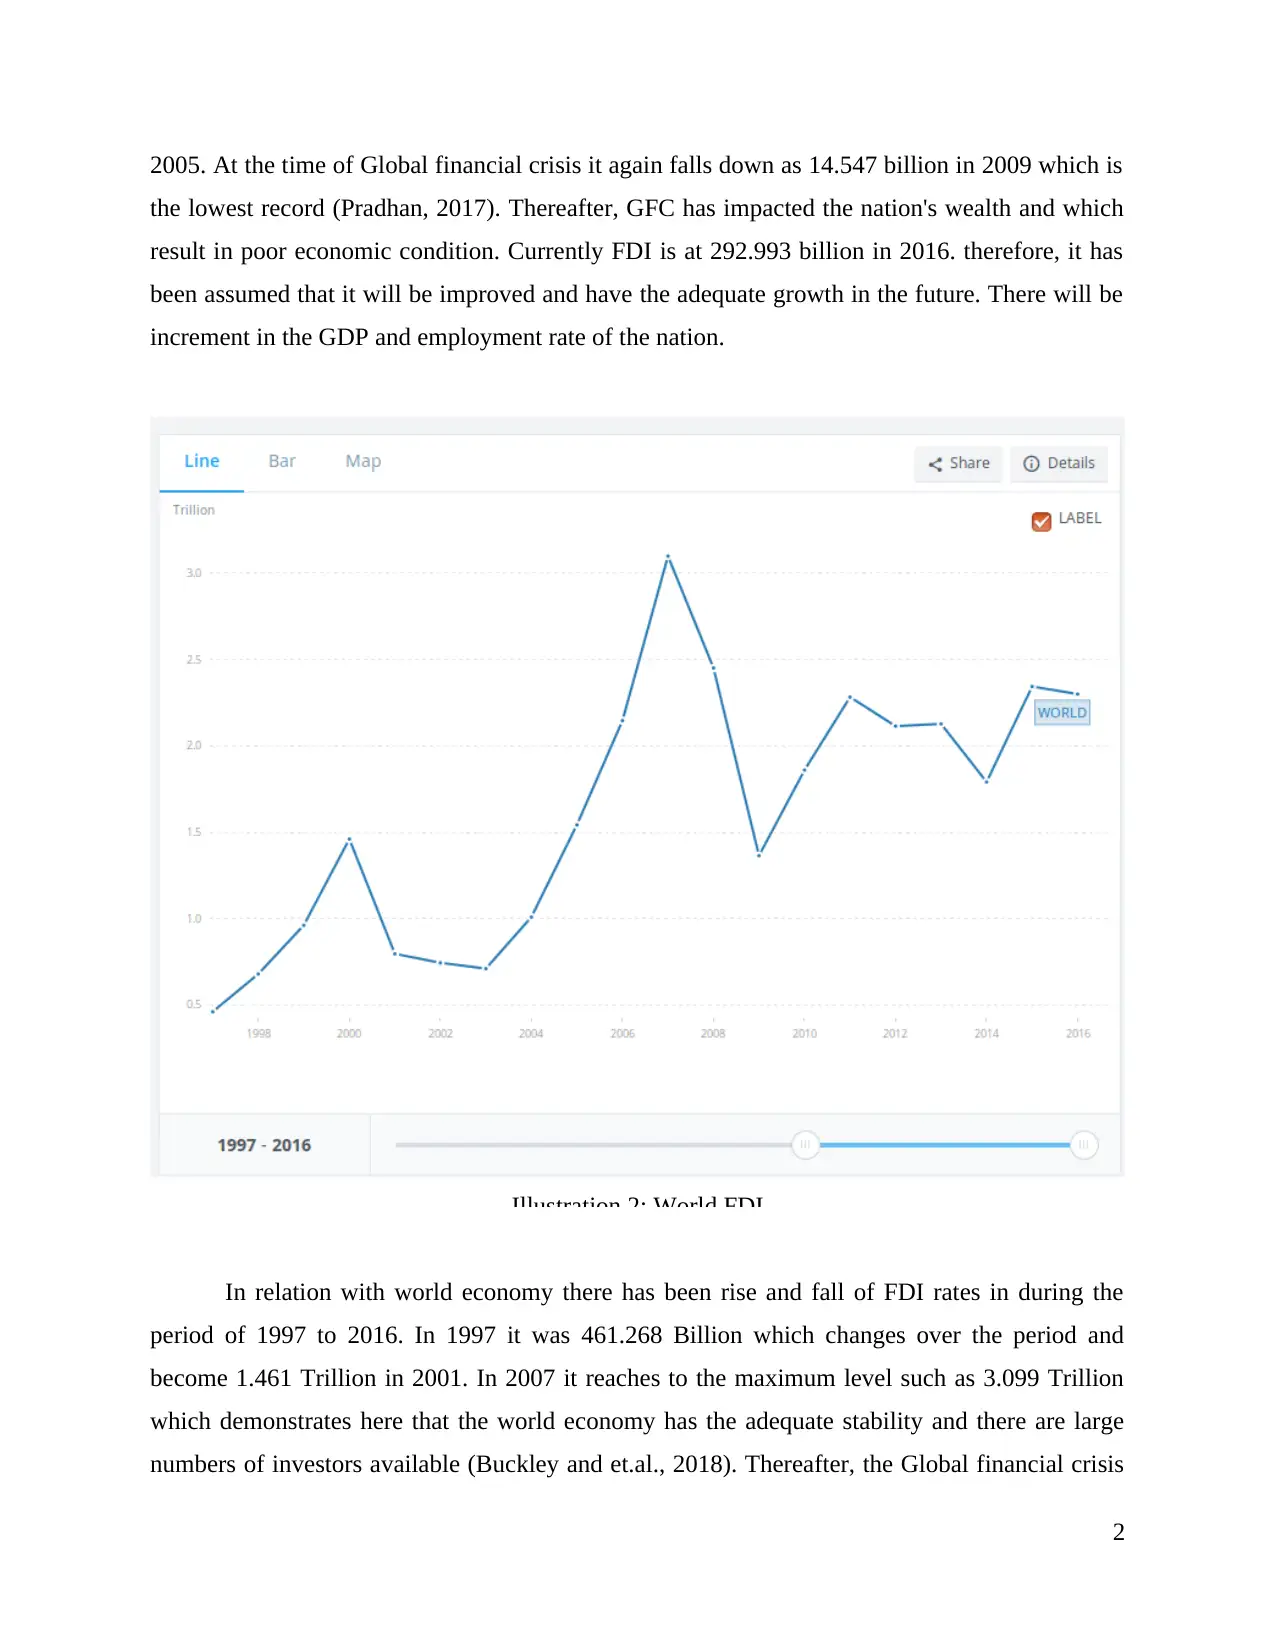
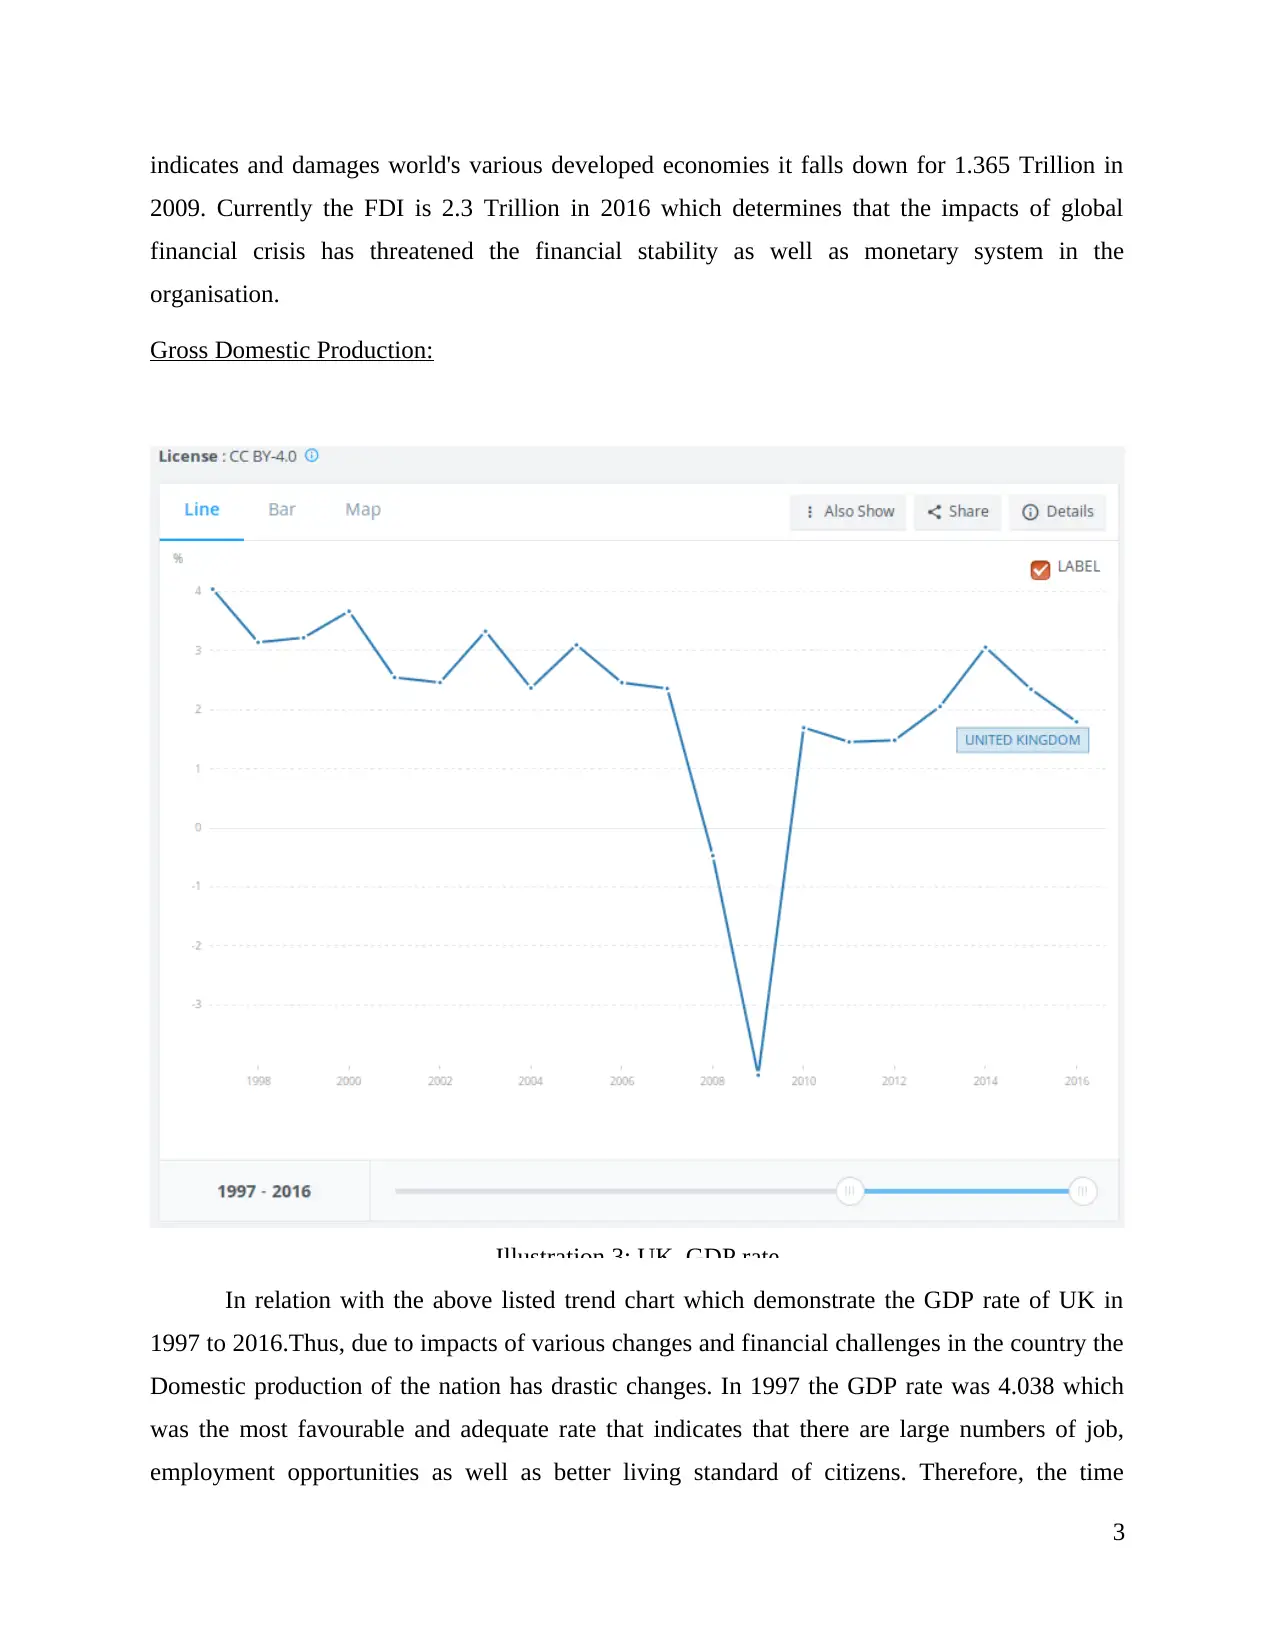
This report analyzes the Foreign Direct Investment (FDI) and Gross Domestic Product (GDP) trends in the UK and globally, spanning from 1997 to 2016. The analysis highlights the fluctuations in FDI in the UK, showing a significant rise from 1997 to 2000, a drop during the global financial crisis, and sub...

REPORT
Secure Best Marks with AI Grader
Need help grading? Try our AI Grader for instant feedback on your assignments.

TABLE OF CONTENTS
INTRODUCTION...........................................................................................................................1
FDI:.............................................................................................................................................1
Gross Domestic Production:.......................................................................................................3
REFERENCES................................................................................................................................6

INTRODUCTION
Foreign direct investments helps the nation in terms of facilitating the revenue and
employment opportunities in the nation. There will be adequate increment in the growth and
profitability which will maximises the wealth and economic condition of the nation. Therefore,
there will be analysis over the world vs UK's FDI growth rate.
FDI:
Illustration 1: FDI in UK
In accordance with the above listed graph it can be said that UK has drastic changes in
the economic environment. The trend reflects period of 1997 to 2016 which is helpful I
determining the FDI growth as well as reduction over the period. In 1997 the FDI was 37.505
Billion which reaches to 164.13 billion in 2000. Therefore, during that period various
international businesses showed their interest in making investments in the country. In 2003 it
falls at 36.011 billion and then after 2 year it reaches to the maximum level as 252.653 billion in
1

2005. At the time of Global financial crisis it again falls down as 14.547 billion in 2009 which is
the lowest record (Pradhan, 2017). Thereafter, GFC has impacted the nation's wealth and which
result in poor economic condition. Currently FDI is at 292.993 billion in 2016. therefore, it has
been assumed that it will be improved and have the adequate growth in the future. There will be
increment in the GDP and employment rate of the nation.
In relation with world economy there has been rise and fall of FDI rates in during the
period of 1997 to 2016. In 1997 it was 461.268 Billion which changes over the period and
become 1.461 Trillion in 2001. In 2007 it reaches to the maximum level such as 3.099 Trillion
which demonstrates here that the world economy has the adequate stability and there are large
numbers of investors available (Buckley and et.al., 2018). Thereafter, the Global financial crisis
2
Illustration 2: World FDI
Secure Best Marks with AI Grader
Need help grading? Try our AI Grader for instant feedback on your assignments.

indicates and damages world's various developed economies it falls down for 1.365 Trillion in
2009. Currently the FDI is 2.3 Trillion in 2016 which determines that the impacts of global
financial crisis has threatened the financial stability as well as monetary system in the
organisation.
Gross Domestic Production:
Illustration 3: UK GDP rate
In relation with the above listed trend chart which demonstrate the GDP rate of UK in
1997 to 2016.Thus, due to impacts of various changes and financial challenges in the country the
Domestic production of the nation has drastic changes. In 1997 the GDP rate was 4.038 which
was the most favourable and adequate rate that indicates that there are large numbers of job,
employment opportunities as well as better living standard of citizens. Therefore, the time
3

changes and it has constantly downfalls (GDP growth (annual %), 2017). Thus, at the time of
global financial crisis it has reflected the negative balance as -4.188. It demonstrates here that
there were unemployment, poor monetary system, the prices of the commodities were being as
the level of imports were increased in comparison with exports. In 2010 it has risen up to 1.695
and then have the constant growth. Thus, it can be said that the Global financial crisis has
impacts the economic condition of the nation as well as reduces the FDI in nation.
4

REFERENCES
Books and Journals
Buckley, P. J. and et.al., 2018. A retrospective and agenda for future research on Chinese
outward foreign direct investment. Journal of International Business Studies. pp.1-20.
Pradhan, J. P., 2017. Emerging multinationals: A comparison of Chinese and Indian outward
foreign direct investment. Institutions and Economies. pp.113-148.
Online
GDP growth (annual %). 2017. [Online]. Available through
:<https://data.worldbank.org/indicator/NY.GDP.MKTP.KD.ZG?
end=2016&locations=GB&start=1997&view=chart>.
5
1 out of 7
Related Documents

Your All-in-One AI-Powered Toolkit for Academic Success.
+13062052269
info@desklib.com
Available 24*7 on WhatsApp / Email
Unlock your academic potential
© 2024 | Zucol Services PVT LTD | All rights reserved.