Regression Analysis: Federated Islands Sales, Simple & Multiple Models

Verified

Added on  2021/06/15

|10
|600
|67
Homework Assignment
AI Summary
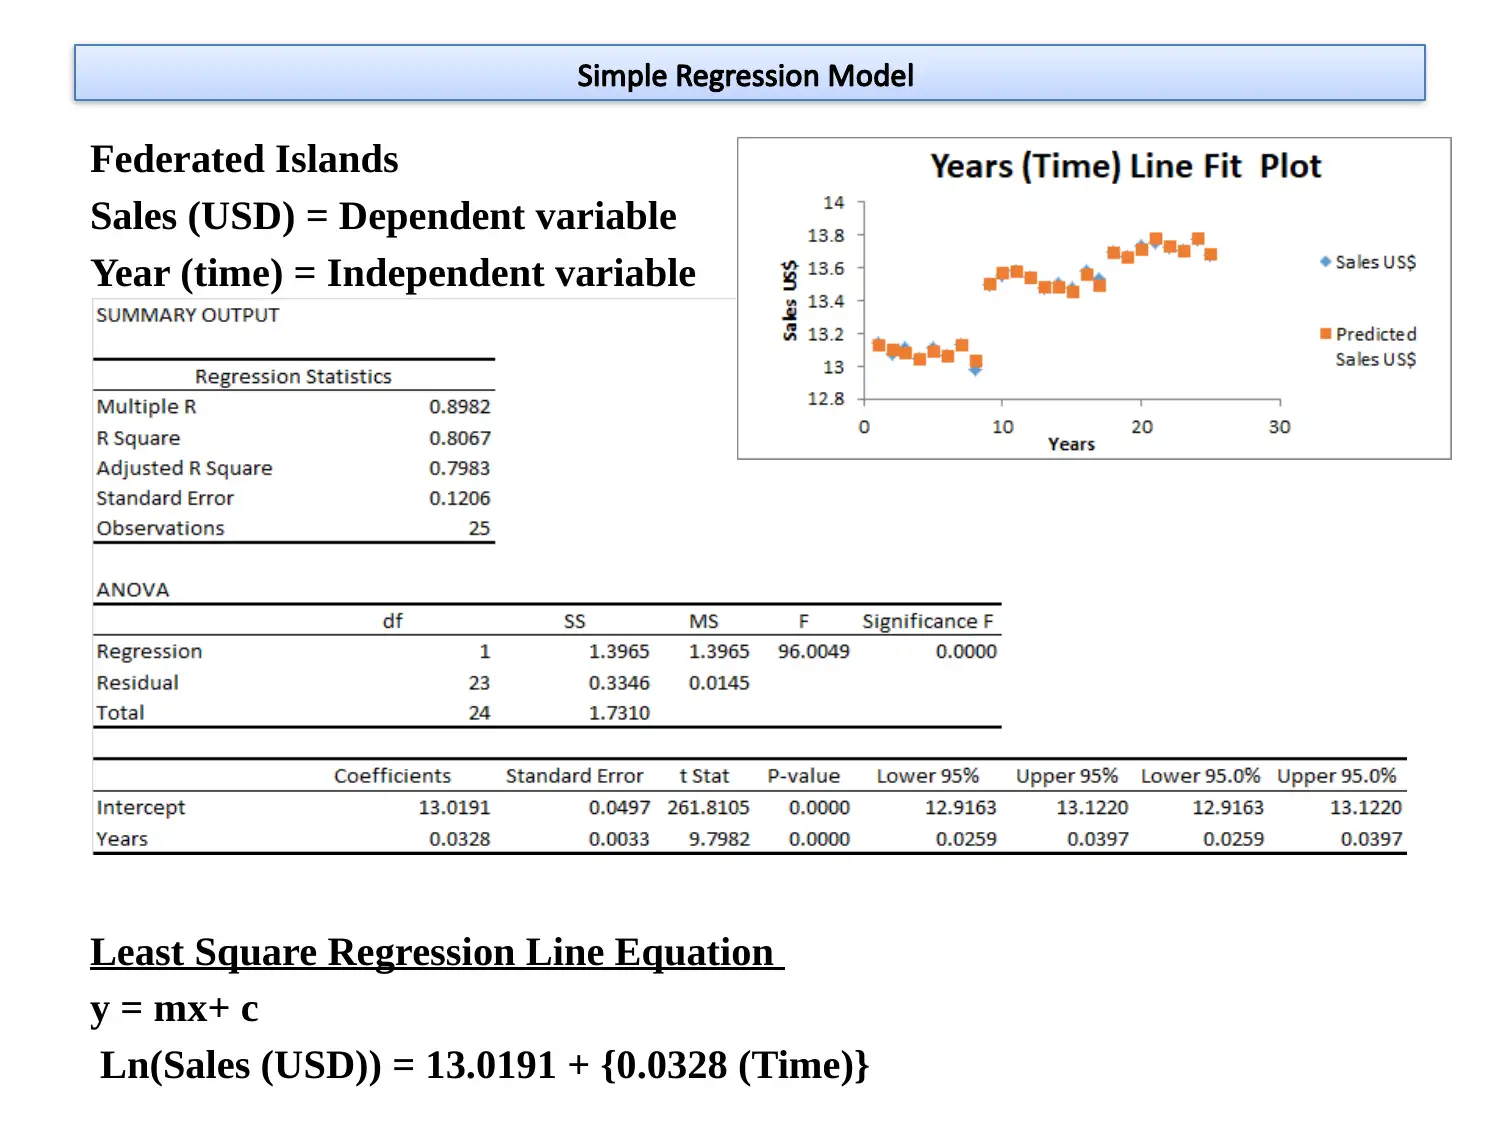
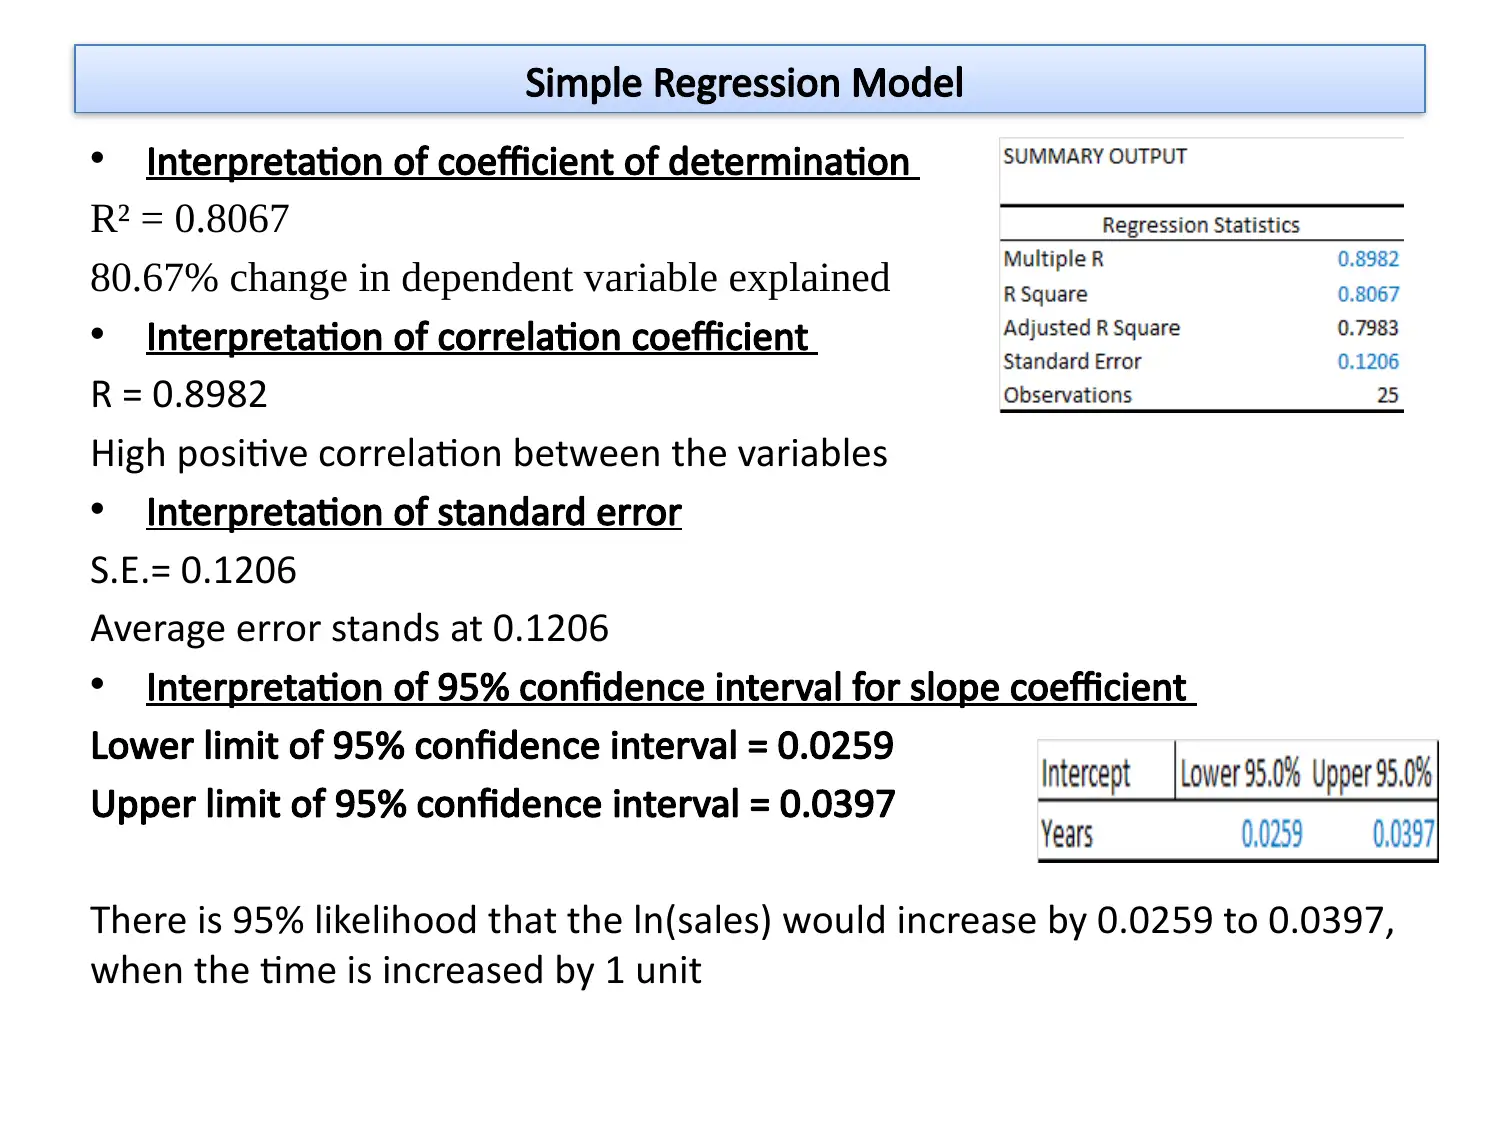
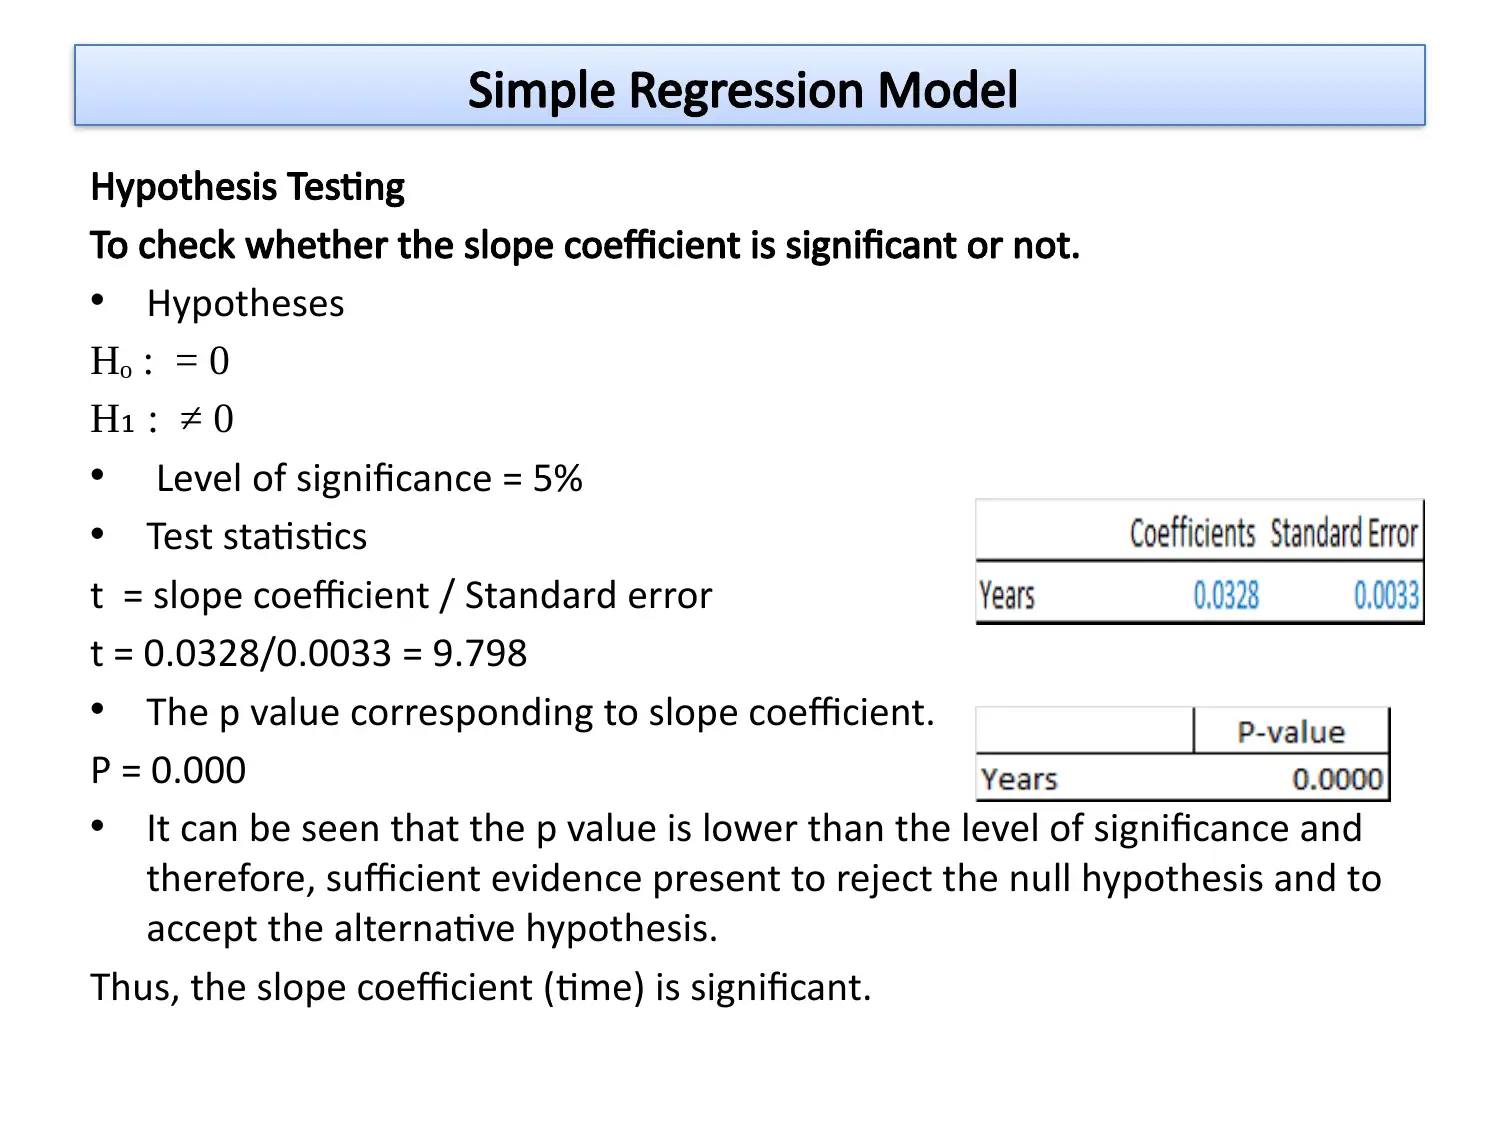
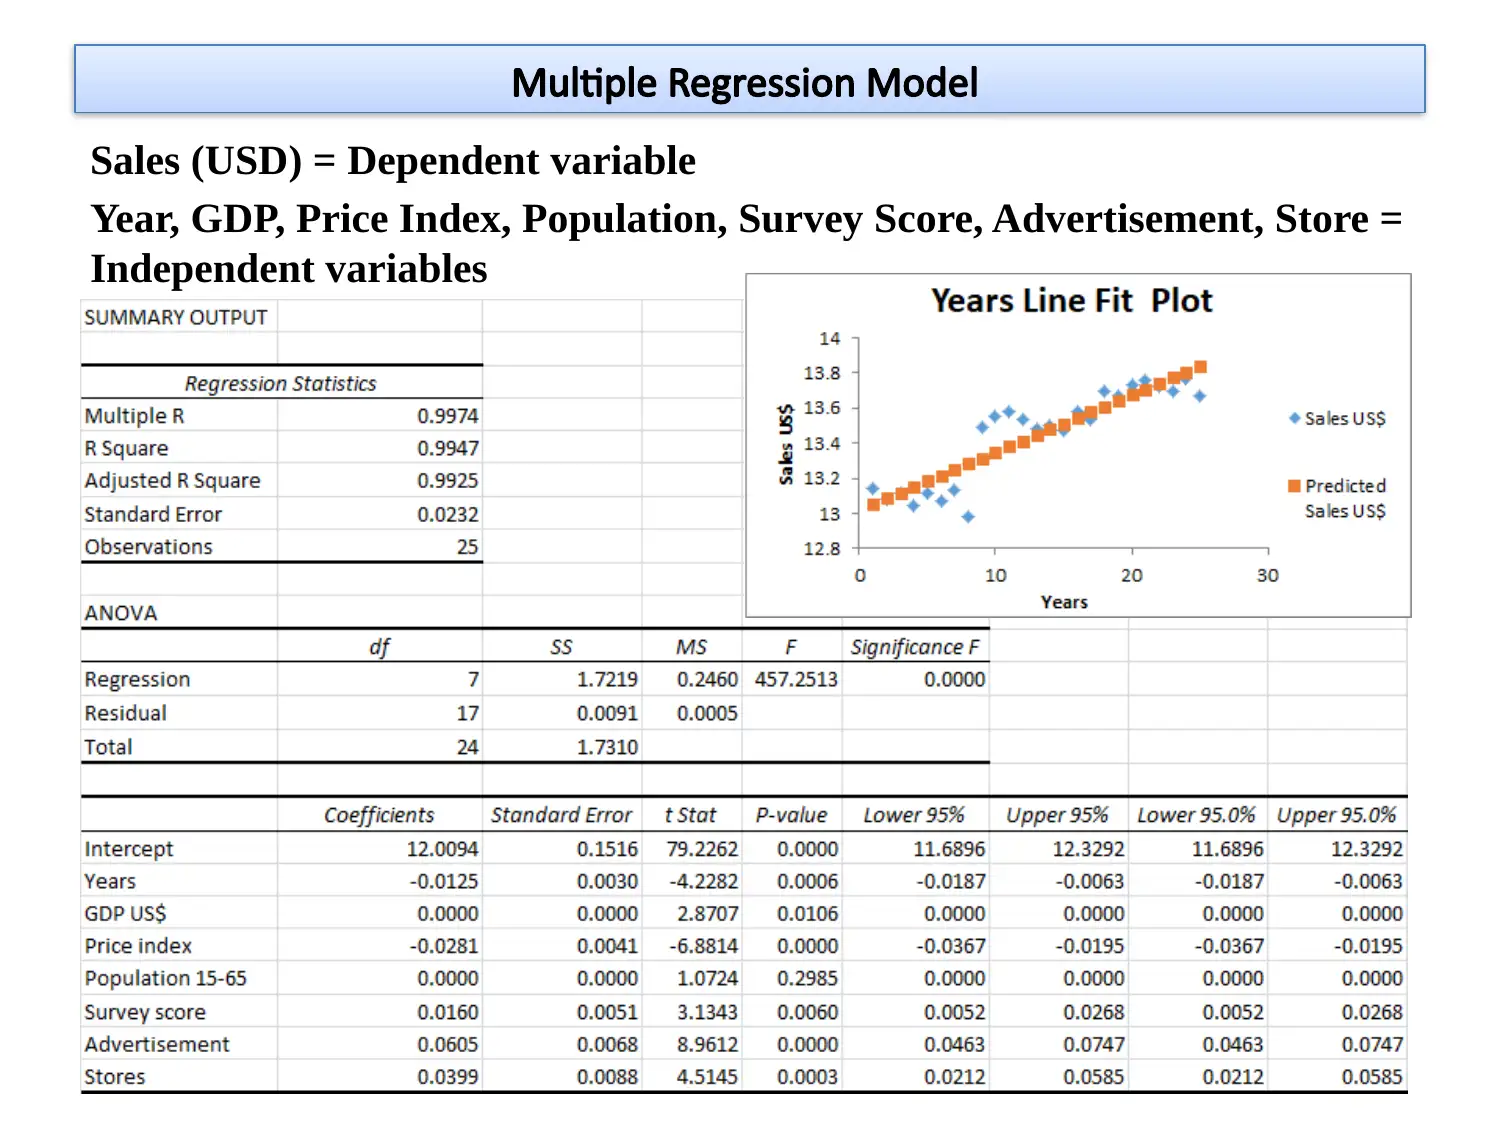
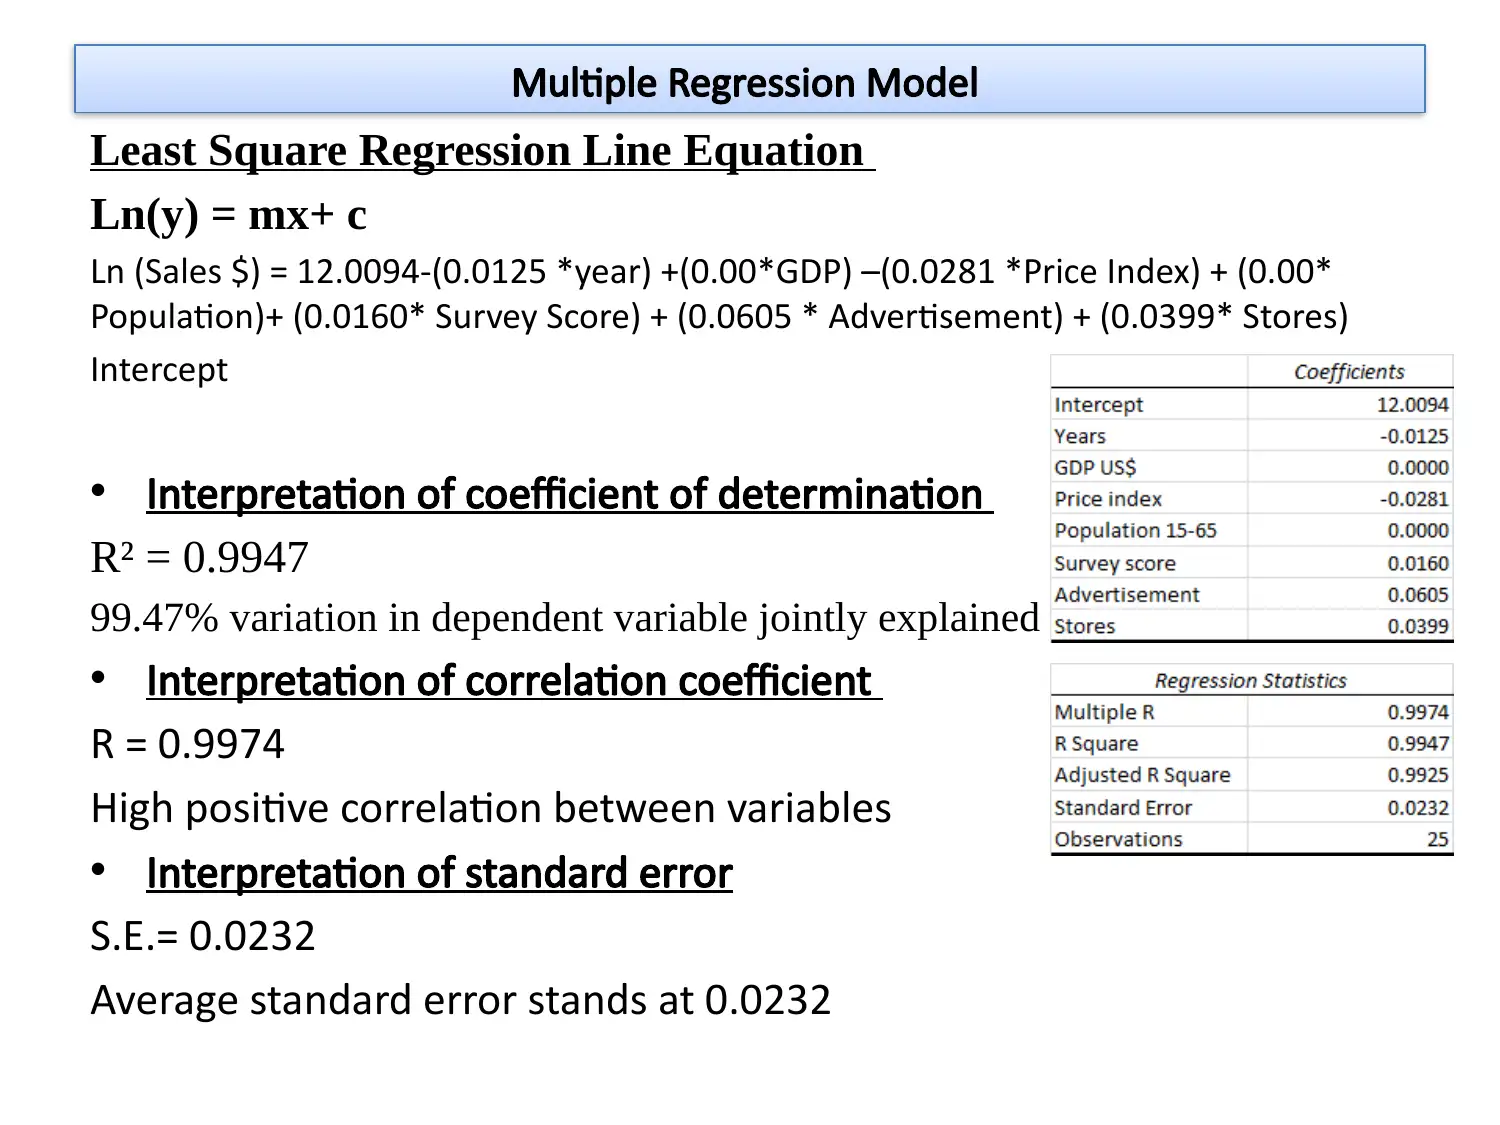
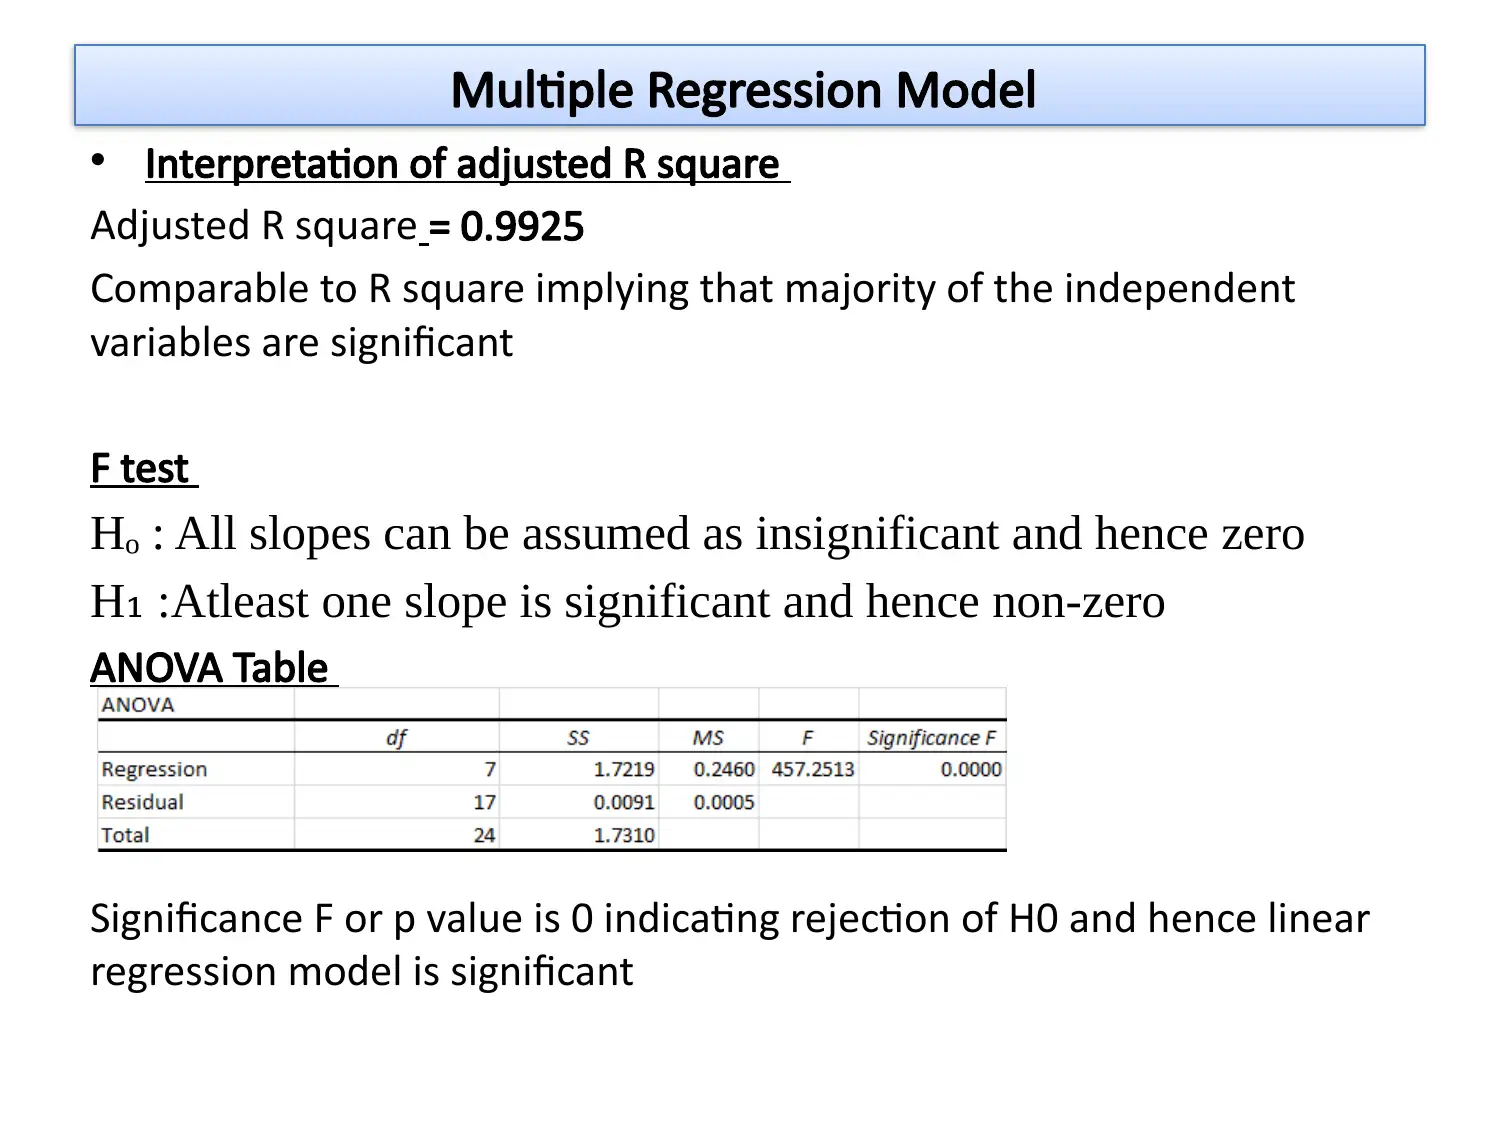
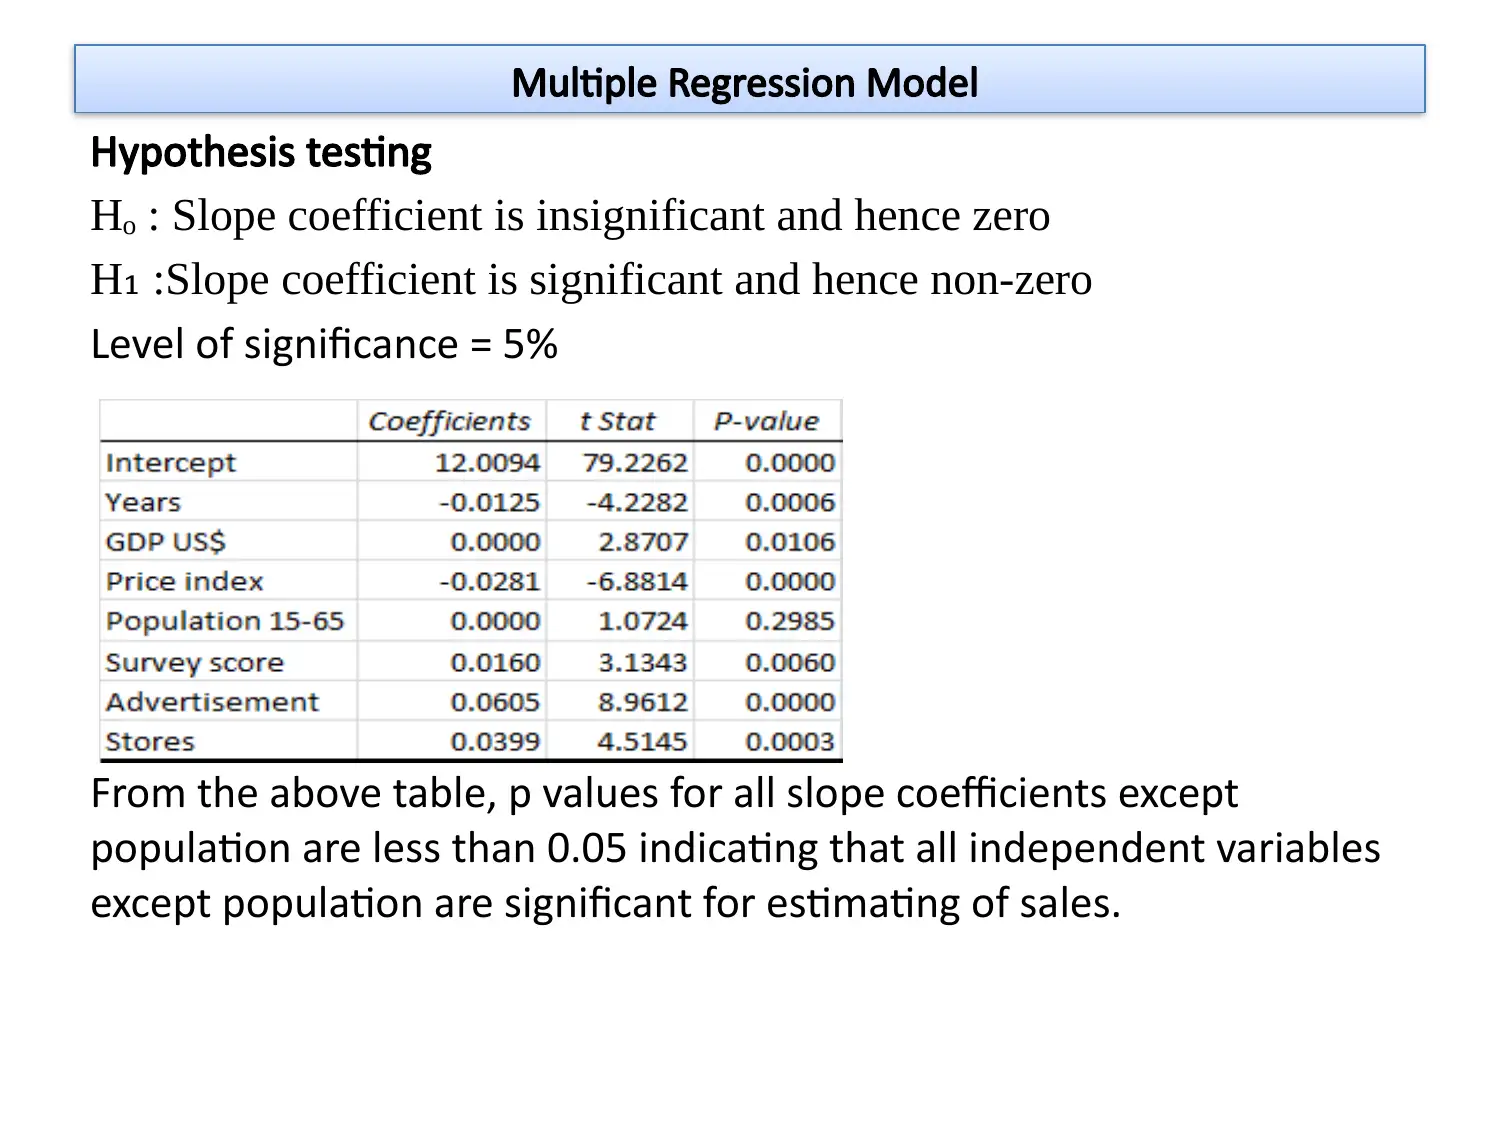
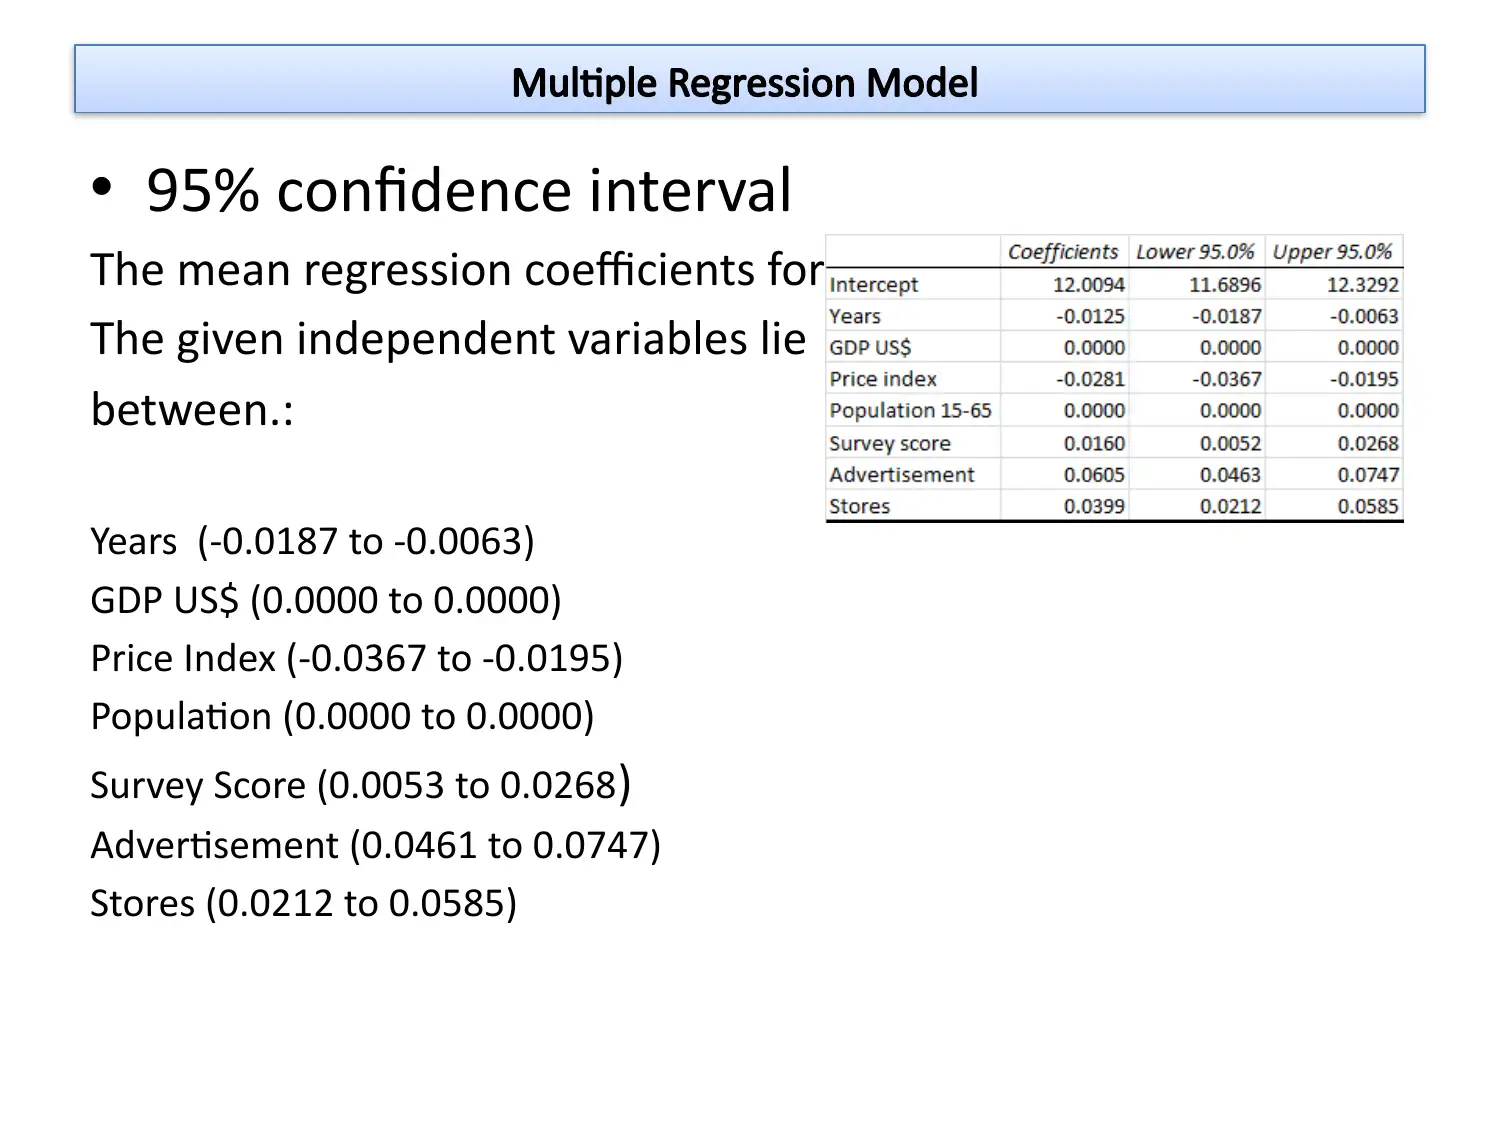
This assignment provides a comprehensive analysis of sales data using both simple and multiple regression models. The student begins by constructing a simple regression model to analyze the relationship between the sales of Federated Islands and time. The least square regression line equation is derived and the coefficients are interpreted, including the slope and intercept. The model's performance is evaluated using the coefficient of determination (R²), correlation coefficient (R), and standard error (S.E.). The 95% confidence interval for the slope coefficient is also calculated and interpreted. The assignment then progresses to a multiple regression model, incorporating multiple independent variables like year, GDP, price index, population, survey score, advertisement, and number of stores. The least square regression line equation is presented, and the coefficients are interpreted. The assignment includes the interpretation of R², adjusted R square, and the correlation coefficient. An ANOVA table and hypothesis testing are conducted to assess the significance of the model and individual variables. Finally, 95% confidence intervals for the regression coefficients are provided for each independent variable. The analysis demonstrates how to interpret the significance of each variable in the model, providing a thorough understanding of the statistical techniques used in regression analysis.
Document Page
STUDENT NAME/ID
SIMPLE & MULTIPLE
REGRESSION MODEL
tabler-icon-diamond-filled.svg

Paraphrase This Document

Need a fresh take? Get an instant paraphrase of this document with our AI Paraphraser
Document Page
Simple Regression Model
Federated Islands
Sales (USD) = Dependent variable
Year (time) = Independent variable
Least Square Regression Line Equation
y = mx+ c
Ln(Sales (USD)) = 13.0191 + {0.0328 (Time)}
Document Page
Ln(Sales $) = 13.0191 + {0.0328 (Time)}
Interpretation of Coefficients
Slope coefficient:
m = 13.0191
The above value indicates the rate of change
Intercept
c = 0.0328
At t =0, the above value would be observed
The value of sales (USD) for Federated Islands would be determined based on the
given time.
For example, the sales for Federated Islands for a period of 8 years would be computed
below:
Ln(Sales $) = 13.0191 + {0.0328 (Time)}
Time = 8
Ln(Sales $) = 13.0191 + {0.0328*8}
Sales = $587,428
Hence, the mean sales is $587,428
Simple Regression Model
Document Page
Interpretation of coefficient of determination
R² = 0.8067
80.67% change in dependent variable explained
Interpretation of correlation coefficient
R = 0.8982
High positive correlation between the variables
Interpretation of standard error
S.E.= 0.1206
Average error stands at 0.1206
Interpretation of 95% confidence interval for slope coefficient
Lower limit of 95% confidence interval = 0.0259
Upper limit of 95% confidence interval = 0.0397
There is 95% likelihood that the ln(sales) would increase by 0.0259 to 0.0397,
when the time is increased by 1 unit
Simple Regression Model
tabler-icon-diamond-filled.svg

Paraphrase This Document

Need a fresh take? Get an instant paraphrase of this document with our AI Paraphraser
Document Page
Hypothesis Testing
To check whether the slope coefficient is significant or not.
Hypotheses
Hₒ : = 0
H : ≠ 0
Level of significance = 5%
Test statistics
t = slope coefficient / Standard error
t = 0.0328/0.0033 = 9.798
The p value corresponding to slope coefficient.
P = 0.000
It can be seen that the p value is lower than the level of significance and
therefore, sufficient evidence present to reject the null hypothesis and to
accept the alternative hypothesis.
Thus, the slope coefficient (time) is significant.
Simple Regression Model
Document Page
Sales (USD) = Dependent variable
Year, GDP, Price Index, Population, Survey Score, Advertisement, Store =
Independent variables
Multiple Regression Model
Document Page
Least Square Regression Line Equation
Ln(y) = mx+ c
Ln (Sales $) = 12.0094-(0.0125 *year) +(0.00*GDP) –(0.0281 *Price Index) + (0.00*
Population)+ (0.0160* Survey Score) + (0.0605 * Advertisement) + (0.0399* Stores)
Intercept
Interpretation of coefficient of determination
R² = 0.9947
99.47% variation in dependent variable jointly explained
Interpretation of correlation coefficient
R = 0.9974
High positive correlation between variables
Interpretation of standard error
S.E.= 0.0232
Average standard error stands at 0.0232
Multiple Regression Model
tabler-icon-diamond-filled.svg

Paraphrase This Document

Need a fresh take? Get an instant paraphrase of this document with our AI Paraphraser
Document Page
Interpretation of adjusted R square
Adjusted R square = 0.9925
Comparable to R square implying that majority of the independent
variables are significant
F test
Hₒ : All slopes can be assumed as insignificant and hence zero
H :Atleast one slope is significant and hence non-zero
ANOVA Table
Significance F or p value is 0 indicating rejection of H0 and hence linear
regression model is significant
Multiple Regression Model
Document Page
Hypothesis testing
Hₒ : Slope coefficient is insignificant and hence zero
H :Slope coefficient is significant and hence non-zero
Level of significance = 5%
From the above table, p values for all slope coefficients except
population are less than 0.05 indicating that all independent variables
except population are significant for estimating of sales.
Multiple Regression Model
Document Page
95% confidence interval
The mean regression coefficients for
The given independent variables lie
between.:
Years (-0.0187 to -0.0063)
GDP US$ (0.0000 to 0.0000)
Price Index (-0.0367 to -0.0195)
Population (0.0000 to 0.0000)
Survey Score (0.0053 to 0.0268)
Advertisement (0.0461 to 0.0747)
Stores (0.0212 to 0.0585)
Multiple Regression Model
chevron_up_icon
1 out of 10
circle_padding
hide_on_mobile
zoom_out_icon
[object Object]