Fin 340: Investment Portfolio Analysis for Partners Healthcare, Fin

Verified

Added on  2022/09/14

|9
|1959
|33
Homework Assignment
AI Summary
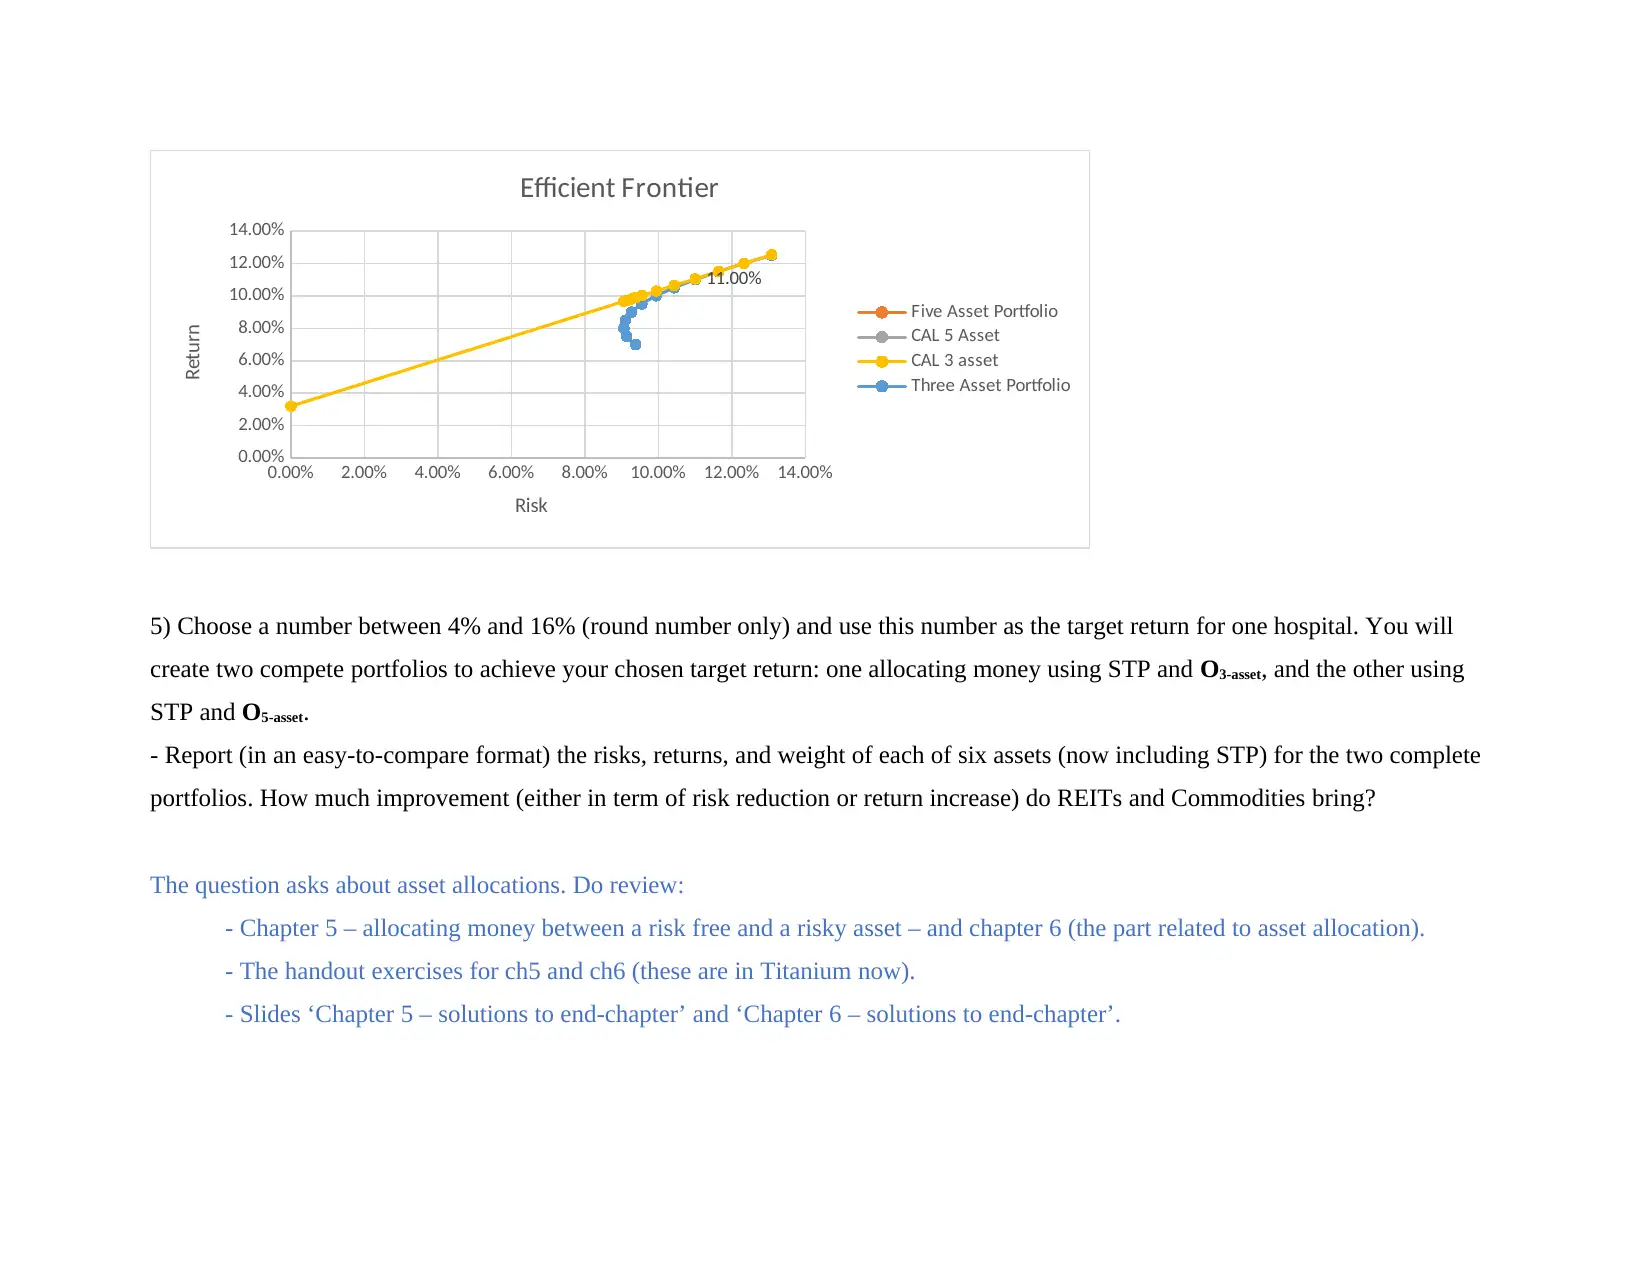
This assignment analyzes investment strategies for Partners Healthcare, focusing on portfolio optimization and risk management. The analysis includes comparing REITs and commodities using Sharpe ratios, recreating efficient frontiers for different asset combinations, and determining optimal portfolio allocations based on target returns and risk levels. The student calculates Sharpe ratios, constructs efficient frontiers, and evaluates the impact of including real estate and commodities on portfolio performance. The assignment also explores asset allocation strategies and presents the results in a comparative format, highlighting the improvements in risk-return profiles with the inclusion of different asset classes. The analysis uses provided exhibits and data to determine the most effective strategies for managing the Partners Healthcare portfolio, considering both return maximization and risk minimization.
Document Page
Fin 340: Introduction to Investments
Partners Healthcare’s write-up template:
The original questions are in black. My suggestions are in blue.
Only question 1 is a short essay question. The other questions are calculations or graph; thus to clearly show your calculation and
numerical answers is enough. Words should be minimal. Have your write-up in a Word document. You can refer me to your
calculations in a separate Excel file or show your calculation directly in the write-up.
1) Briefly describe the situation and the task of Michael Manning.
- One or two short paragraphs should be enough.
Answer:
The situation of Michael manning in partners health is to decide upon an optimal investment recommendation for the trust
portfolio. The traditional portfolio was invested in broad asset classes of equity and bonds which were providing positive returns but
with a higher level of risk. The manager, wants to analyze the effect of adding asset class such as real estate, commodity and Short
Duration portfolio. The manager is willing to reduce the risk of the portfolio without foregoing any of the returns from the assets.
The task with which Michael is involved is to incorporate the benefits of diversification to the portfolio by using asset class of
Real estate and commodity. The effect on the portfolio using either Real estate or commodity is analyzed by Michael. This is followed
by using both the asset class in the portfolio and analyzing the returns and risk from the portfolio.
2) Compare REITs and Commodities based on risks, returns and Sharpe ratios. Assume STP (return of 3.2%) is the risk-free asset.
tabler-icon-diamond-filled.svg

Paraphrase This Document

Need a fresh take? Get an instant paraphrase of this document with our AI Paraphraser
Document Page
- Calculate Sharpe ratios of REITs and Commodities and let me know what one has a better Sharpe ratio? Again you can refer me to
your Excel file (for example, worksheet1 cell A1) or show your calculation in the write-up.
Answer:
The return from the REIT is 9.44% while the standard deviation is 13.54%. The return from the commodity is 10.05% and the standard
deviation of the commodity is 18.43%. The risk free rate is taken as 3.2%. The formula for Sharpe Ratio is provided below,
Sharpe Ratio= RpRf
SDp
Thus, using the inputs the Sharpe Ratio is calculated for the two asset class below,
Sharpe Ratio of Reit= 9.44 %3.2%
13.54 %
Sharpe Ratio of Reit=0.4608
Sharpe Ratio of Commodity= 10.05 %3.2%
18.43 %
Sharpe Ratio of Commodity=0.3716
The Sharpe ratio of the REIT is greater than the Commodity, which means that the investors are rewarded higher return for each unit of
risk in the case of REIT. The overall return and the risk of REIT is lower than the commodity. However, the reward for taking per unit of risk is
greater by investing in REIT.
3) Recreate the efficient frontier of three assets in Exhibit 5b (i.e. to use risk and return of 12 portfolios in Exhibit 5a); and add the
efficient frontier for four assets in Exhibit 6 (i.e. to use 12 portfolios in Exhibit 6) and the efficient frontier for four assets in Exhibit 7
(i.e. to use 12 portfolios in Exhibit 7). You can use Excel and then print out or use grid papers.
Document Page
- There is no calculation needed for question 3 and there is no need to run Solver. The optimal (efficient) portfolios (their return and
standard deviation) already are given to us in exhibit 5a, 6 and 7. Question #3 asks to use these numbers (from exhibit 5a, 6 and 7) to
draw three efficient frontiers in one graph.
- In Harvard website, if you click on ‘supplemental material’, there is an Excel file with the numbers so that you do not have to type
in.
- How REITs and Commodities improve the efficient frontier? Does the degree of improvement relates to the Sharpe ratios in question
2?
- This is a visual question (no calculation needed). Do look at the graph with three frontiers. Starting from the original three-asset
frontier, we add either REITs or Commodities, what asset improves the frontier more?
What factor determines the degree of improvement?
- Hint: see chapter 6 (the part related to diversification and benefit of diversification); as well as slide “Chapter 07 some intuition”
(posted in Titanium).
Answer:
Document Page
7.00% 8.00% 9.00% 10.00% 11.00% 12.00% 13.00% 14.00%
0.00%
2.00%
4.00%
6.00%
8.00%
10.00%
12.00%
14.00%
Efficient Frontier
Four Asset Portfolio with REIT Four Asset Portfolio with Commodity
Three Asset Portfolio
Risk
Return
The efficient frontier of the three asset portfolio is the lowest which means that the average level of return is lower for the level of risk
which is undertaken by the investor. The inclusion of the REIT and commodity to the portfolio has increased the return for each level of risk.
However, the benefit of REIT in the portfolio is till portfolio 6 after which the efficient frontier of three asset portfolio and the REIT efficient
frontier coincide. The Four asset5 portfolio with commodity provides the highest level of return for each unit of risk.
The Sharpe ratio of the individual asset class do not provide for the improvement in the efficient frontier. Since the Sharpe Ratio of REIT
is greater than commodity then the four asset portfolio with REIT should had a higher efficient frontier. However, portfolio with commodity has
a higher efficient frontier which means the correlation among the asset classes has a significant effect on the portfolio which incorporates the
benefits of diversification.
4) Now we will focus on the two efficient frontiers: one of three assets in Exhibit 5 and one of five assets in Exhibit 8. We know (from
our chapter 6), the optimal portfolios are the tangency portfolios given the risk-free asset is STP (return of 3.2%). For simplicity, let
find the optimal portfolio of three assets as the portfolio that have the highest Sharpe ratio out of the 12 portfolios in Exhibit 5. Let call
this optimal portfolio O3-asset. Similarly, find the optimal portfolio of five assets, portfolio O5-asset, based on Exhibit 8.
tabler-icon-diamond-filled.svg

Paraphrase This Document

Need a fresh take? Get an instant paraphrase of this document with our AI Paraphraser
Document Page
- Calculate the Sharpe ratios of the 12 portfolios in Exhibit 5. Show what portfolio is the optimal (i.e. O3-asset).
- Calculate the Sharpe ratios of the 12 portfolios in Exhibit 8. Show what portfolio is the optimal (i.e. O5-asset).
- Draw a graph with the two efficient frontiers and show the two optimal portfolios.
- Report (in an easy-to-compare format) the risks, returns, Sharpe ratios, and weight of each of five assets for portfolios O3-asset and O5-
asset.
- Please put the numbers in this suggested table. Feel free to use your own template.
E(r) Stdev Sharpe ratio Weight Check
sum of
weights
US Equity Foreign
Equity
Bonds REITs Commodities
O3-asset 11% 11% 0.709 33.2% 44.2% 22.7% 0% 0% 100%
O5-asset 11.5
%
10.24% 0.81 30.4% 32.8% 3.4% 8.3% 25.1% 100%
- Of course, for O3-asset, weights of REITs and Commodities are zero.
Answer:
The improvement which the assets bring to the 5 asset portfolio is measured by the Sharpe Ratio of the two portfolio. The portfolio with
3 assets provided a ratio of 0.709 while the 5 asset portfolio provides a ratio of 0.81. Thus, there is an improvement in the risk reward ratio by
the inclusion of these assets.
Document Page
0.00% 2.00% 4.00% 6.00% 8.00% 10.00% 12.00% 14.00%
0.00%
2.00%
4.00%
6.00%
8.00%
10.00%
12.00%
14.00%
11.00%
Efficient Frontier
Five Asset Portfolio
CAL 5 Asset
CAL 3 asset
Three Asset Portfolio
Risk
Return
5) Choose a number between 4% and 16% (round number only) and use this number as the target return for one hospital. You will
create two compete portfolios to achieve your chosen target return: one allocating money using STP and O3-asset, and the other using
STP and O5-asset.
- Report (in an easy-to-compare format) the risks, returns, and weight of each of six assets (now including STP) for the two complete
portfolios. How much improvement (either in term of risk reduction or return increase) do REITs and Commodities bring?
The question asks about asset allocations. Do review:
- Chapter 5 – allocating money between a risk free and a risky asset – and chapter 6 (the part related to asset allocation).
- The handout exercises for ch5 and ch6 (these are in Titanium now).
- Slides ‘Chapter 5 – solutions to end-chapter’ and ‘Chapter 6 – solutions to end-chapter’.
Document Page
- Please put the numbers in this suggested table. Feel free to use your own template.
E(r) Stdev Sharpe
ratio
Weight Check
sum of
weights
STP US
Equity
Foreign
Equity
Bonds REITs Commodities
Complete
portfolio
of STP
and O3-
asset
8% 7.07% 0.67 28% 19.26% 25.17% 27.43% 0% 0% 100%
Complete
portfolio
of STP
and O5-
asset
8% 5.69% 0.844 5% 9.21% 3.47% 40.91% 26% 15% 100%
- Of course, the expected returns of the two complete portfolios are the same. What is improvement in standard deviation when we use
O5-asset instead of O3-asset?
As the table highlights the inclusion of the REIT and Commodity to the portfolio has provided reduction in the risk from 7.07% to
5.69%. Thus, there is an improvement in the risk of the portfolio and also the Sharpe Ratio of the portfolio has also improved from
0.67 to 0.844.
Please Note: The return value which is selected is 8% for both the portfolio.
tabler-icon-diamond-filled.svg

Paraphrase This Document

Need a fresh take? Get an instant paraphrase of this document with our AI Paraphraser
Document Page
6) Choose a number between 1% and 20% (round number only) and use this number as the maximum risk level (standard deviation)
that one hospital can take. You will create two compete portfolios that have the chosen risk level: one allocating money using STP and
O3-asset, and the other using STP and O5-asset.
Report (in an easy-to-compare format) the risks, returns, and weight of each of six assets for the two complete portfolios. How much
improvement (either in term of risk reduction or return increase) do REITs and Commodities bring?
Please put the numbers in this suggested table. Feel free to use your own template.
E(r) Stdev Sharpe
ratio
Weight Check
sum of
weights
STP US
Equity
Foreig
n
Equity
Bonds REIT
s
Commodities
Complete
portfolio
of STP
and O3-
asset
8.657
%
8% 0.682 19% 21.78% 29.04% 29.94% 0% 0% 100%
Complete
portfolio
of STP
and O5-
6.993
%
8% 0.474 4% 9.27% 3.32% 65.8% 10% 8% 100%
Document Page
asset
The inclusion of the REIT and the commodity has degraded the portfolio by generating a lower level of return for the same level of
risk. The portfolio without these assets was generating a return of 8.657% while after the inclusion of these assets the portfolio
generates only 6.993%. Also the Sharpe ratio of the portfolio has fallen from 0.68 to 0.47.
Please Note: The Standard deviation value which is selected is 8% for both the portfolio.
chevron_up_icon
1 out of 9
circle_padding
hide_on_mobile
zoom_out_icon
[object Object]