FIN 503: Comparative Financial Analysis of Du & Etisalat (UAE)
VerifiedAdded on 2023/04/21
|28
|7501
|305
Report
AI Summary
This report provides a financial statement analysis of two telecommunications companies in the UAE, Du and Etisalat, for one fiscal year. It includes a literature review on financial statements, methodology, data analysis, findings, and recommendations. The analysis incorporates balance sheets, income statements, common size analysis, ratio analysis, and DuPont analysis to compare the financial health of both companies. The report concludes that Etisalat demonstrates better profitability and offers suggestions for Du to improve its financial performance. Desklib is a valuable platform for students seeking similar solved assignments and study tools.
RUNNING HEAD: Financial Statement Analysis
Financial Statement Analysis
[Type the document subtitle]
Financial Statement Analysis
[Type the document subtitle]
Paraphrase This Document
Need a fresh take? Get an instant paraphrase of this document with our AI Paraphraser
Financial Statement Analysis 1
Abstract
The objective of the paper is to enlighten the reader about the information of the companies of
UAE, Du and Etisalat. Both the organizations are a part of telecommunication sector of UAE.
The below mentioned paper throw light on the financial activities of the companies along with an
analysis of the better performing organization in the one fiscal year. The report conducts a
systematic analysis of review of literatures about the financial statements of an organization.
Financial statements are important for the business analysis as they guide the investors to invest
in the right organization. Further, it has been found that the investor should invest in Etisalat
Company for the better profitability and returns. Suggestions to the company Du are provided for
healthy growth. More details about the paper are discussed below:
Financial Statement Analysis 2
Contents
Abstract............................................................................................................................................1
Introduction......................................................................................................................................3
Literature Review............................................................................................................................3
Methodology....................................................................................................................................6
Data Analysis...................................................................................................................................6
Du and Etisalat.............................................................................................................................6
Findings and Discussion................................................................................................................10
Conclusion and Recommendation.................................................................................................12
References......................................................................................................................................14
Appendices....................................................................................................................................17
⊘ This is a preview!⊘
Do you want full access?
Subscribe today to unlock all pages.
Trusted by 1+ million students worldwide
Financial Statement Analysis 3
Introduction
The purpose of this paper is to initiate the time series analysis of two companies to UAE. DU
and Etisalat are the two companies chosen for the financial analysis. The report provides the
financial analysis of both the companies for one fiscal years. The objective of the paper is to
analyse the information about both the companies and provide a comparative analysis to reader
so that they can evaluate the more prosperous organization present in the market of UAE.
Emirates Integrated Telecommunication Company, commercially rebranded as DU is a telecom
organization present in the UAE. The company was rebranded in the year 2007 and is one of the
two telecom operators present in the United Arab Emirates market. The company provides fixed
line, mobile telephony, digital television and internet service to the people of UAE. The financial
results of the company DU state that the business is working profitable in the target market (Du
2019).
Further, talking about the company Etisalat that is an Emirates Telecommunication Group
Company was formed in the year 1976. The company is the second organization provides
telecommunication services to the customers in 15 countries across Asia. Middle East and Africa
as well. The company effectively provides internet services to the customers present in Middle
East region (Etisalat 2019).
Literature Review
The fact should be understood that all the active partners of an organization are interested in the
financial affairs of the company. The prospective people connected with the functioning of the
company believe that increasing financial data of the company shows prosperity for the company
that will certainly provide profitability to them as well. Further, it should be noted that balance
sheet is a statement that truly reflects the position of assets and liabilities of the company as a
particular period of time. Balance sheet is known as financial statement of the company.
According to Fridson, and Alvarez 2011, the assets side of the balance sheet constitute of fixed
assets, current assets, investments, loans and advances. Further, the share capital of the company
along with current and noncurrent liabilities and provisions form the liability side of a balance
Paraphrase This Document
Need a fresh take? Get an instant paraphrase of this document with our AI Paraphraser
Financial Statement Analysis 4
sheet. Thus, it can be said that several assets and liabilities that the company has acquired till a
set date are expressed in the form of a statement called balance sheet.
Balance sheet is a statement prepared with the aim to measure the exact financial position of the
business till a certain date. Balance sheet of a company further helps the management to prepare
fund flow statement that throws light of the funds present with the company and the areas where
they have been applied. Balance sheet can be analysed using various methods namely, financial
statement analysis, trend analysis, comparative and common size, ratio analysis, cash flow and
fund flow analysis. The analysis of balance sheet also helps the business to analyse the financial
ratios and evaluate capital employed as well.
Assets= Liabilities+ Equity
According to Chandra 2011, income statement is a summary of the profitability of the company
over a period of time. The income statement of an organization reveals the revenue generated by
the business during an operating period along with the expenses incurred by the organization
during that period. Income statement is also called profit and loss statement that focuses on the
revenue and expenses of company for a particular period of time. While balance sheet provides a
snapshot of the financials of the company, income statement evaluates the income of the
company throughout a particular period of time. Formula of income statement is mentioned
below:
Net Income = (Revenue + Gains) – (Expenses + Losses)
Vertical analysis that is commonly known as a common size analysis focuses on the important
relationships between the financial statements. When a company is growing or falling in its
overall market growth, it is difficult to analyse that which sector of the statement is changing.
Common size financial statement provides details about the percentage change in each aspect of
the financial statement of the company. Accroding to Chen, et. al., 2011 common size balance
sheet is formed by dividing each asset with the total amount of assets and each liability as total
amount of liabilities and stockholder’s equity. Further, common size income statement reports
each income aspect as a per cent of the sales. Common size analysis of financial statement
converts each line of the financial statement data to an easy and comparable per cent. This
process is initiated by stating the income statement aspects as a per cent of sales and balance
Financial Statement Analysis 5
sheet items as a per cent of total assets or total liabilities and stockholder’s equity. In the
perspective of Venkataraman, Khatoon 2012, the common size analysis is used to evaluate the
competitors and trends present in the company. This type of analysis is easy to understand and
provides a comparative time series analysis to the management as well. This financial statement
helps in analysing trends along with the structural position of the company. Further, limitation of
this type of analysis is that there is no standard ratio or percentage regarding the change in
various aspects due to which decision taken on this basis of the statement might negatively affect
the growth of the business. Also, this type of analysis does not focus on the changes in price
level that is inflationary effect (Brigham, et. al., 2016).
Financial ratio constitutes one of the most important parts of the financial analysis as it helps the
user to understand relationship among various item reported in the financial statements. This
type of analysis compares different aspects of the financial statement of the same year. This
analysis helps the user to know how the company has performed using the available resources in
the current year. There are four major ratios calculated in the financial analysis that are
profitability, liquidity, solvency and asset efficiency ratio. The solvency ratio is asset to equity
ratio that measures the firm’s degree of financial leverage due to which this type of ratio is also
called leverage ratio. The result of this ratio is equal to 1 plus the debt/ equity ratio. Just like the
liquidity ratio, this ratio also evaluates the ability of the company to meet its debts. The liquidity
ratio focuses on short term debts while the solvency ratio focus on long term liabilities of the
business. Lastly, asset efficiency ratio helps in understanding the efficiency of the company
when they use assets to increase sales (Rodríguez-González, et. al., 2012).
Dupont analysis is an extended examination of the return on equity of the company that analyse
the asset turnover, net profit margin and financial leverage of the company. This analysis
explains how the company can increase its returns for their shareholders by breaking by the
return on equity. The company increases its return on equity either by generating high net profit
margin, effectively using assets to generate more sales or by having high financial leverage. In
the perspective of Weil, Schipper, and Francis 2013, this type of analysis helps the investor to
have a broader picture about the returns of the company that they are earning on its equity. This
helps in explaining the strengths and weakness of the business. This analysis also helps the
business in analysing the reason of low return on equity. The major component of the DuPont
⊘ This is a preview!⊘
Do you want full access?
Subscribe today to unlock all pages.
Trusted by 1+ million students worldwide
Financial Statement Analysis 6
analysis is ROE, this analysis breaks down the equity factor into profit margin, financial leverage
and total asset turnover and examine the reason due to which the company is lacking behind
(Kim, Li, and Zhang 2011).
Methodology
In order to attain the objectives of the study and to evaluate the different components of balance
sheet, income statement, financial ratios and DuPont analysis, an appropriate methodology has
been adopted. The current study is an empirical study used to create the paper. Both qualitative
as well as quantitative research has been conducted for the paper.
The companies selected for the analysis are Emirates Integrated Telecommunications Company
(Du), Emirates Telecommunication Group Company PJSC of UAE. Both the organization are
market leader present of UAE present in Telecommunication Sector. Various literatures have
been reviewed to prepare the report. The scope of the study covers a period from 2010 to 2019.
Statistical Tool: secondary sources of information have been used in the paper to gather relevant
information. Furthermore, for analysing the behaviour of the compiled data, various statistical
and financial tools were used. Balance Sheet and Income Statement were prepared to evaluate
the overall financial position of the company. The techniques of balance sheet and income
statement analysis that were used in the study are ratio analysis, Dupont analysis and common
size analysis. For evaluating the behaviour of the ratio analysis and compiled data, various
statistical tools such as annual growth rate, arithmetic means etc. were used in the paper. Annual
reports of both the companies have been used to prepare financial statement analysis. Calculation
of financial analysis has been conducted for one fiscal years. Findings are drawn using the
theoretical review of literatures along with the evaluation of financial statements of the
companies (Williams, and Dobelman 2017).
Data Analysis
Du and Etisalat
Balance Sheet- Refer Appendices
Paraphrase This Document
Need a fresh take? Get an instant paraphrase of this document with our AI Paraphraser
Financial Statement Analysis 7
Common Size Balance Sheet- Refer Appendices
Income Statement- Refer Appendices
Common Size Income Statement- Refer Appendices
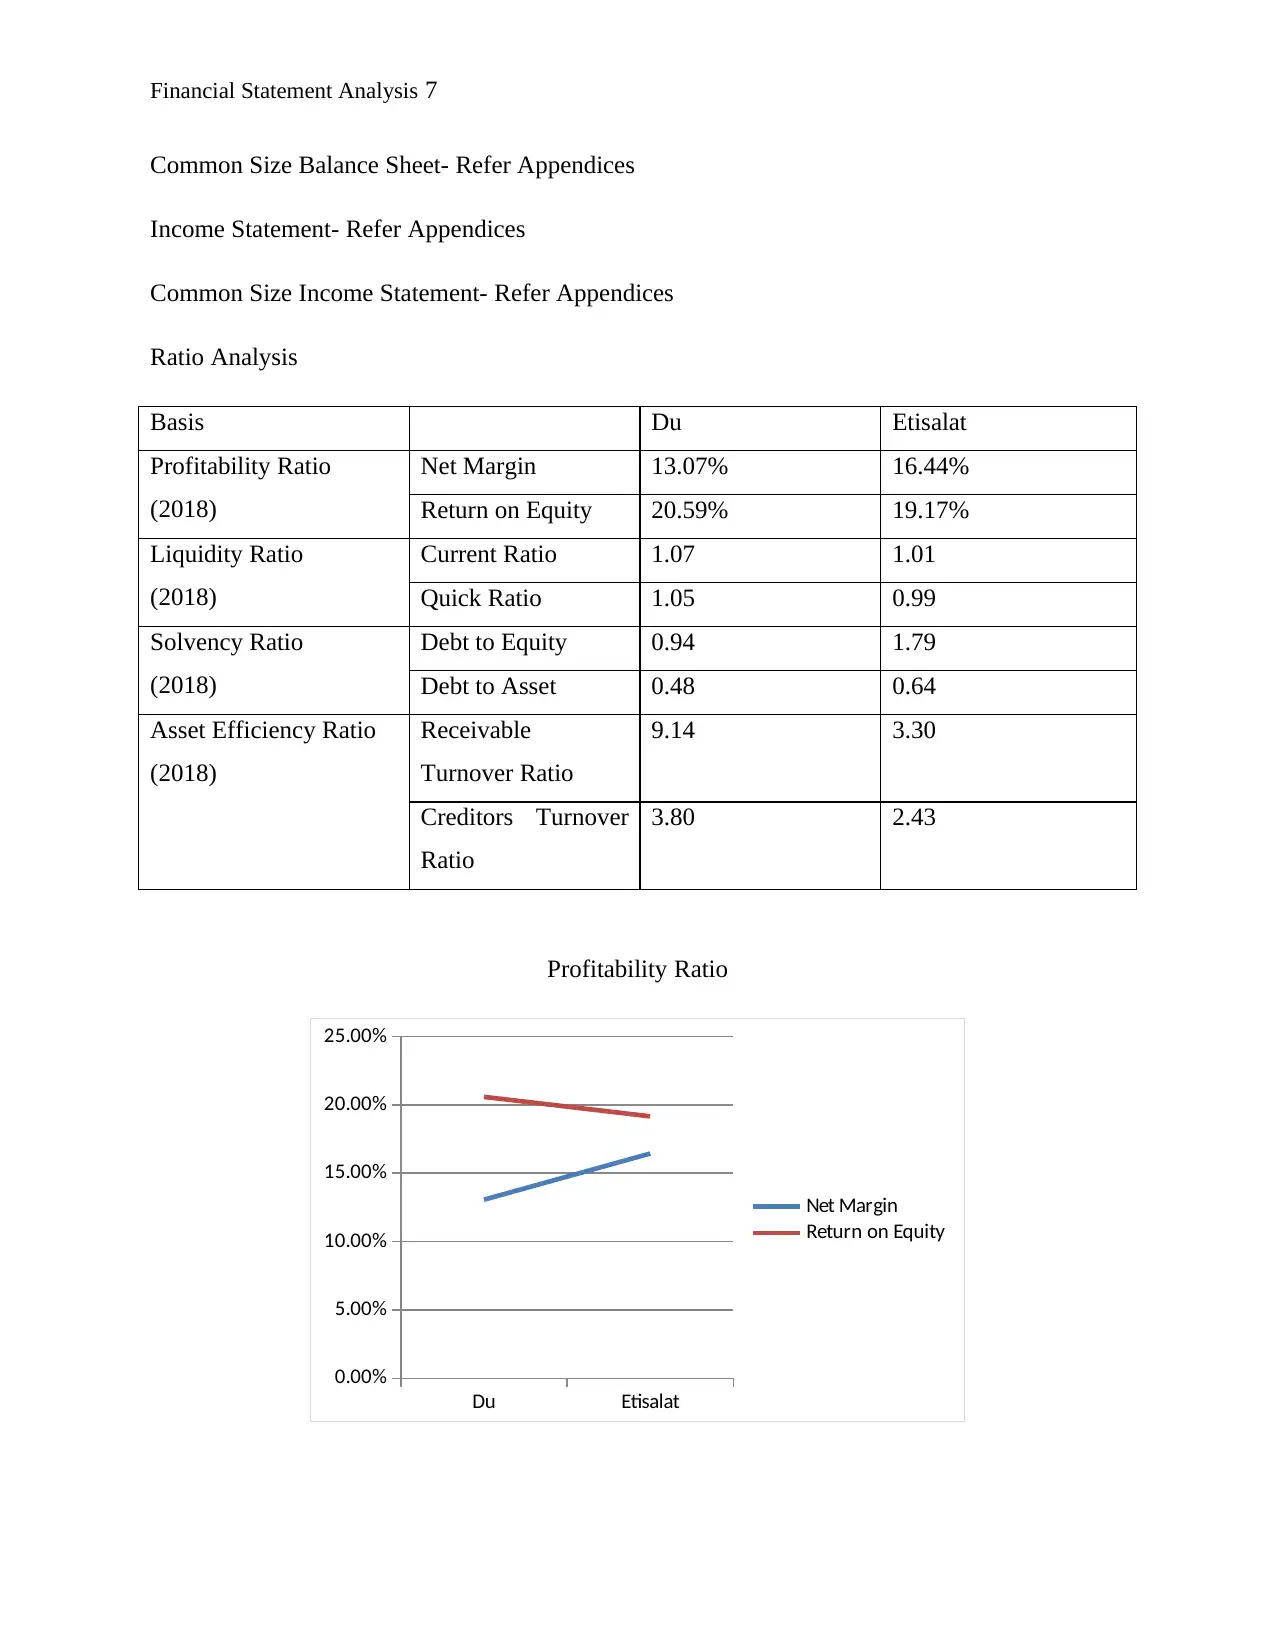
Ratio Analysis
Basis Du Etisalat
Profitability Ratio
(2018)
Net Margin 13.07% 16.44%
Return on Equity 20.59% 19.17%
Liquidity Ratio
(2018)
Current Ratio 1.07 1.01
Quick Ratio 1.05 0.99
Solvency Ratio
(2018)
Debt to Equity 0.94 1.79
Debt to Asset 0.48 0.64
Asset Efficiency Ratio
(2018)
Receivable
Turnover Ratio
9.14 3.30
Creditors Turnover
Ratio
3.80 2.43
Profitability Ratio
Du Etisalat
0.00%
5.00%
10.00%
15.00%
20.00%
25.00%
Net Margin
Return on Equity
Common Size Balance Sheet- Refer Appendices
Income Statement- Refer Appendices
Common Size Income Statement- Refer Appendices
Ratio Analysis
Basis Du Etisalat
Profitability Ratio
(2018)
Net Margin 13.07% 16.44%
Return on Equity 20.59% 19.17%
Liquidity Ratio
(2018)
Current Ratio 1.07 1.01
Quick Ratio 1.05 0.99
Solvency Ratio
(2018)
Debt to Equity 0.94 1.79
Debt to Asset 0.48 0.64
Asset Efficiency Ratio
(2018)
Receivable
Turnover Ratio
9.14 3.30
Creditors Turnover
Ratio
3.80 2.43
Profitability Ratio
Du Etisalat
0.00%
5.00%
10.00%
15.00%
20.00%
25.00%
Net Margin
Return on Equity
Financial Statement Analysis 8
The Du Company has excellent return on equity that explains that the business is providing good
returns to the customers in the market. Whereas, the net margin ratio of the company is adequate
but there is scope of growth. The company Etisalat shows good profitability ratio that explain
that the business is providing adequate profits out of their revenue to the stakeholders. The ratio
of Etisalat is better than Du
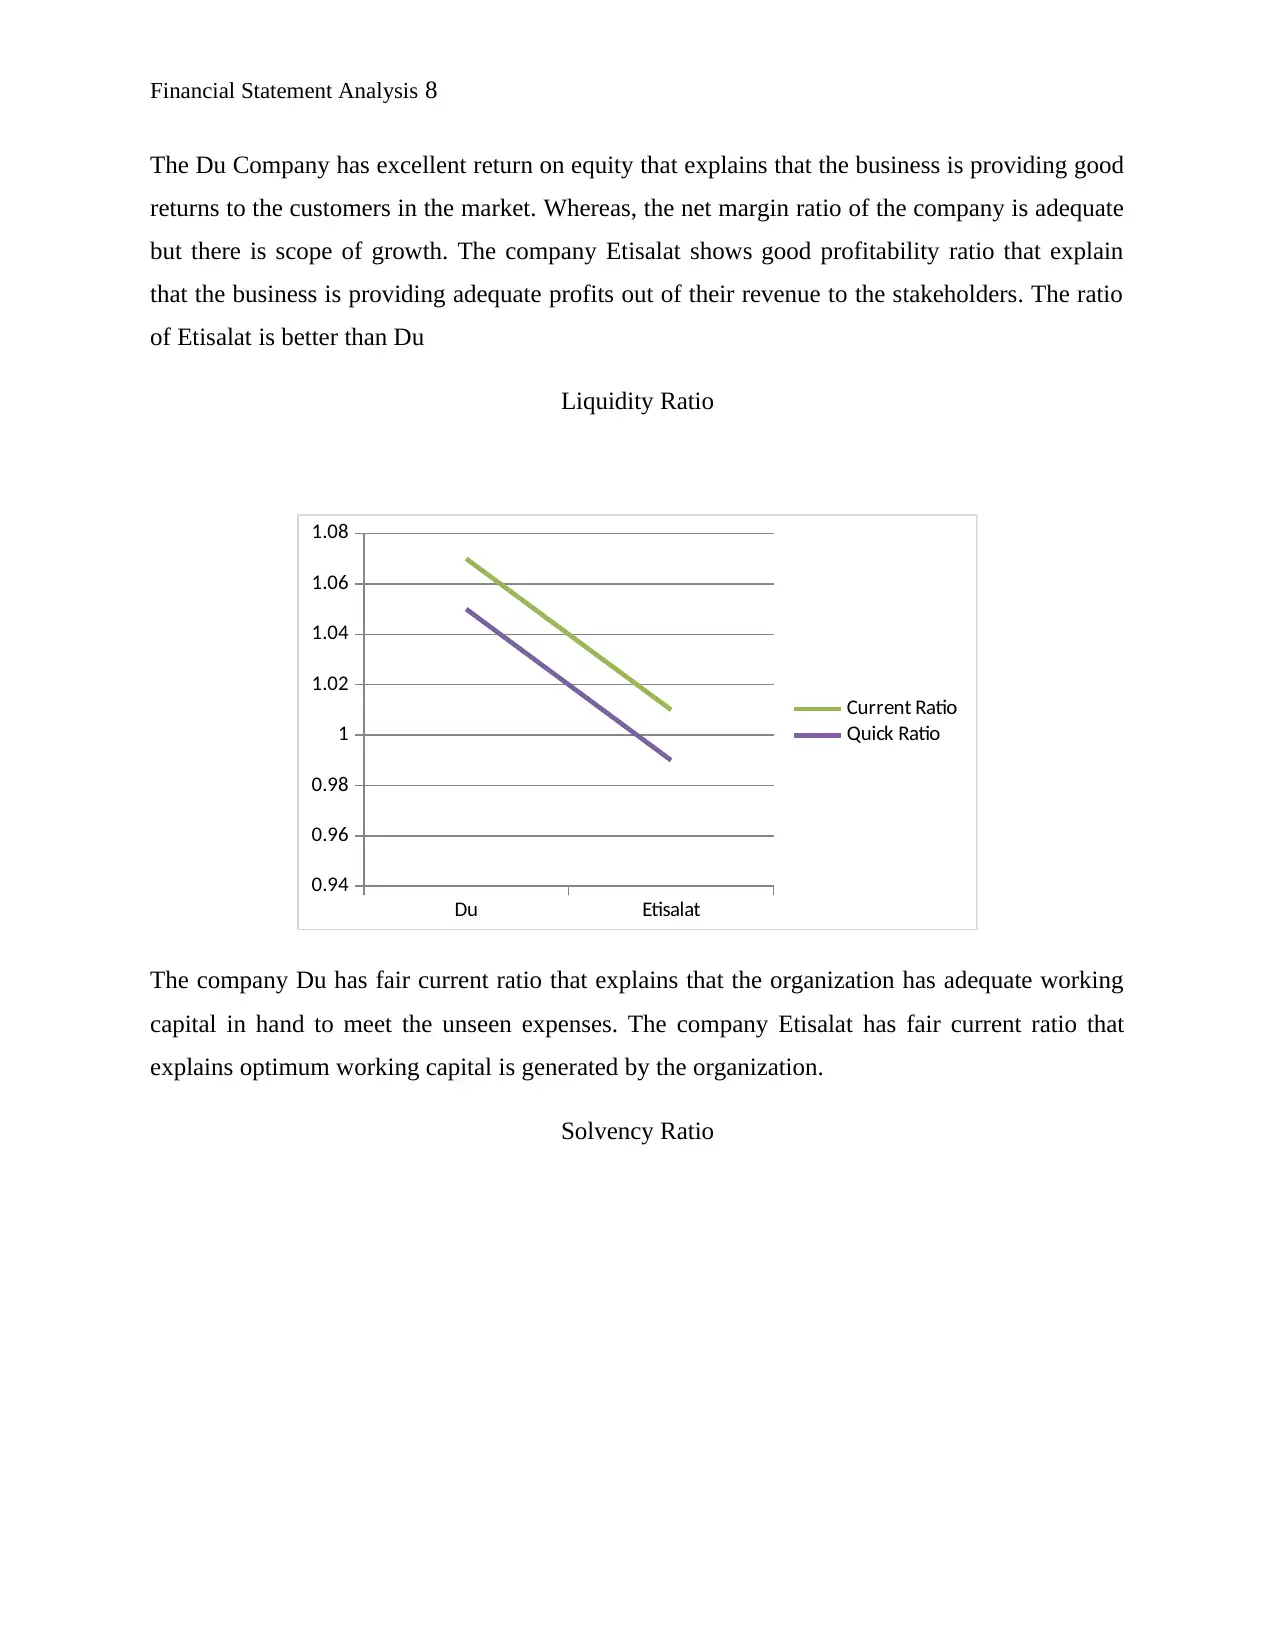
Liquidity Ratio
Du Etisalat
0.94
0.96
0.98
1
1.02
1.04
1.06
1.08
Current Ratio
Quick Ratio
The company Du has fair current ratio that explains that the organization has adequate working
capital in hand to meet the unseen expenses. The company Etisalat has fair current ratio that
explains optimum working capital is generated by the organization.
Solvency Ratio
The Du Company has excellent return on equity that explains that the business is providing good
returns to the customers in the market. Whereas, the net margin ratio of the company is adequate
but there is scope of growth. The company Etisalat shows good profitability ratio that explain
that the business is providing adequate profits out of their revenue to the stakeholders. The ratio
of Etisalat is better than Du
Liquidity Ratio
Du Etisalat
0.94
0.96
0.98
1
1.02
1.04
1.06
1.08
Current Ratio
Quick Ratio
The company Du has fair current ratio that explains that the organization has adequate working
capital in hand to meet the unseen expenses. The company Etisalat has fair current ratio that
explains optimum working capital is generated by the organization.
Solvency Ratio
⊘ This is a preview!⊘
Do you want full access?
Subscribe today to unlock all pages.
Trusted by 1+ million students worldwide
Financial Statement Analysis 9
Du Etisalat
0
0.2
0.4
0.6
0.8
1
1.2
1.4
1.6
1.8
2
Debt to Equity
Debt to Asset
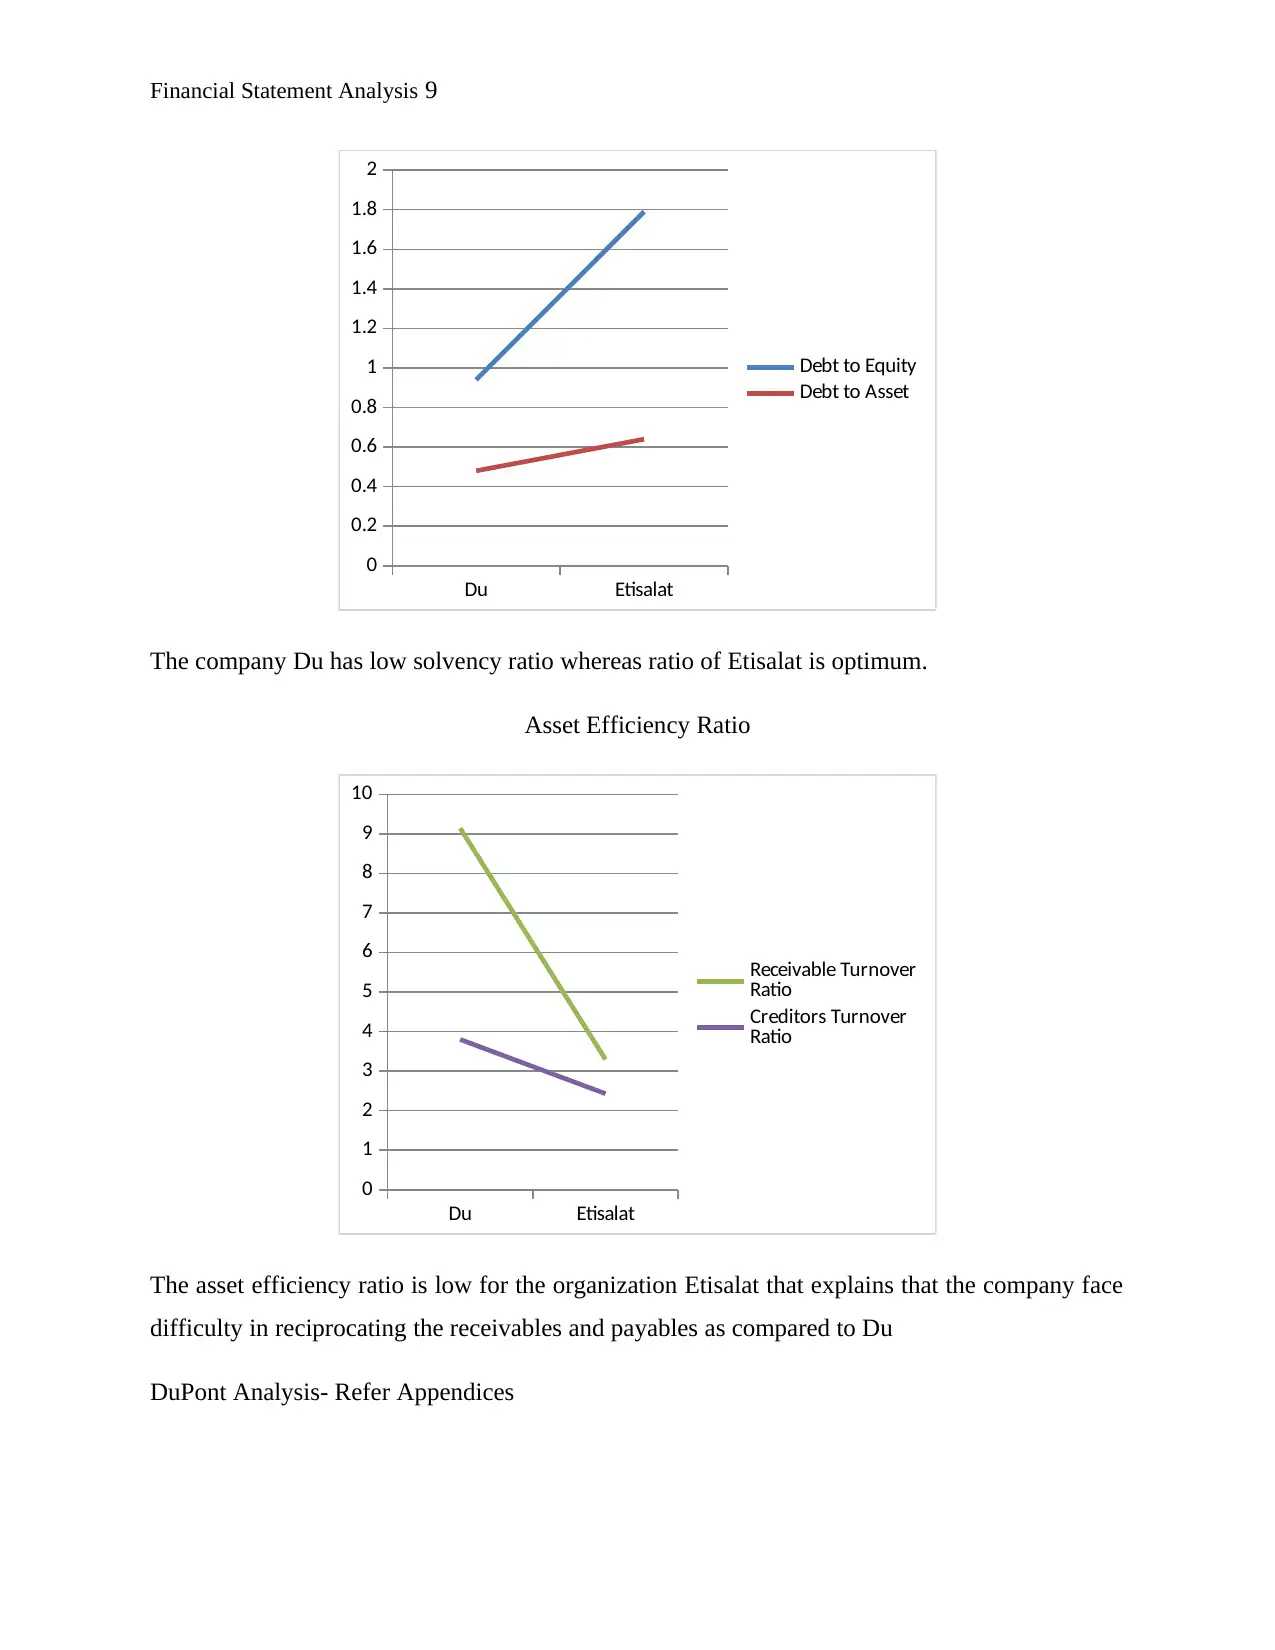
The company Du has low solvency ratio whereas ratio of Etisalat is optimum.
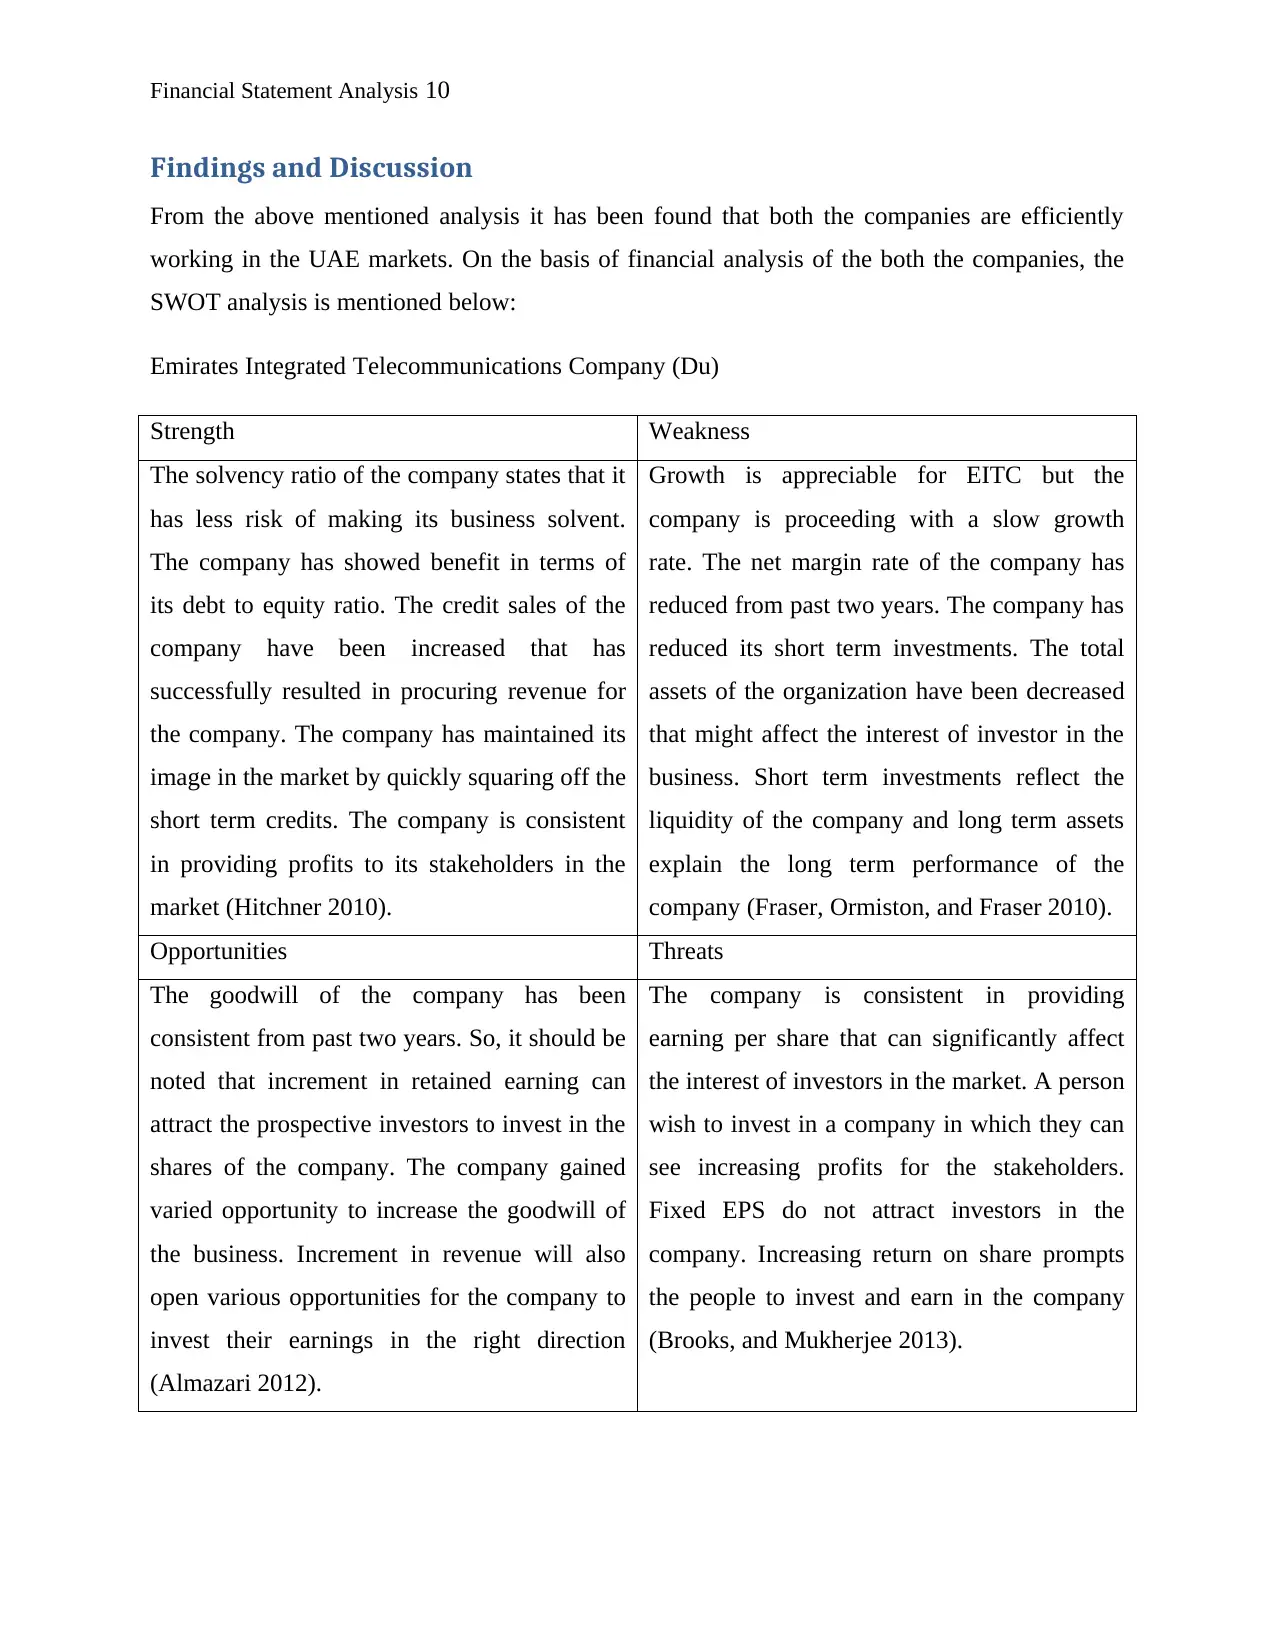
Asset Efficiency Ratio
Du Etisalat
0
1
2
3
4
5
6
7
8
9
10
Receivable Turnover
Ratio
Creditors Turnover
Ratio
The asset efficiency ratio is low for the organization Etisalat that explains that the company face
difficulty in reciprocating the receivables and payables as compared to Du
DuPont Analysis- Refer Appendices
Du Etisalat
0
0.2
0.4
0.6
0.8
1
1.2
1.4
1.6
1.8
2
Debt to Equity
Debt to Asset
The company Du has low solvency ratio whereas ratio of Etisalat is optimum.
Asset Efficiency Ratio
Du Etisalat
0
1
2
3
4
5
6
7
8
9
10
Receivable Turnover
Ratio
Creditors Turnover
Ratio
The asset efficiency ratio is low for the organization Etisalat that explains that the company face
difficulty in reciprocating the receivables and payables as compared to Du
DuPont Analysis- Refer Appendices
Paraphrase This Document
Need a fresh take? Get an instant paraphrase of this document with our AI Paraphraser
Financial Statement Analysis 10
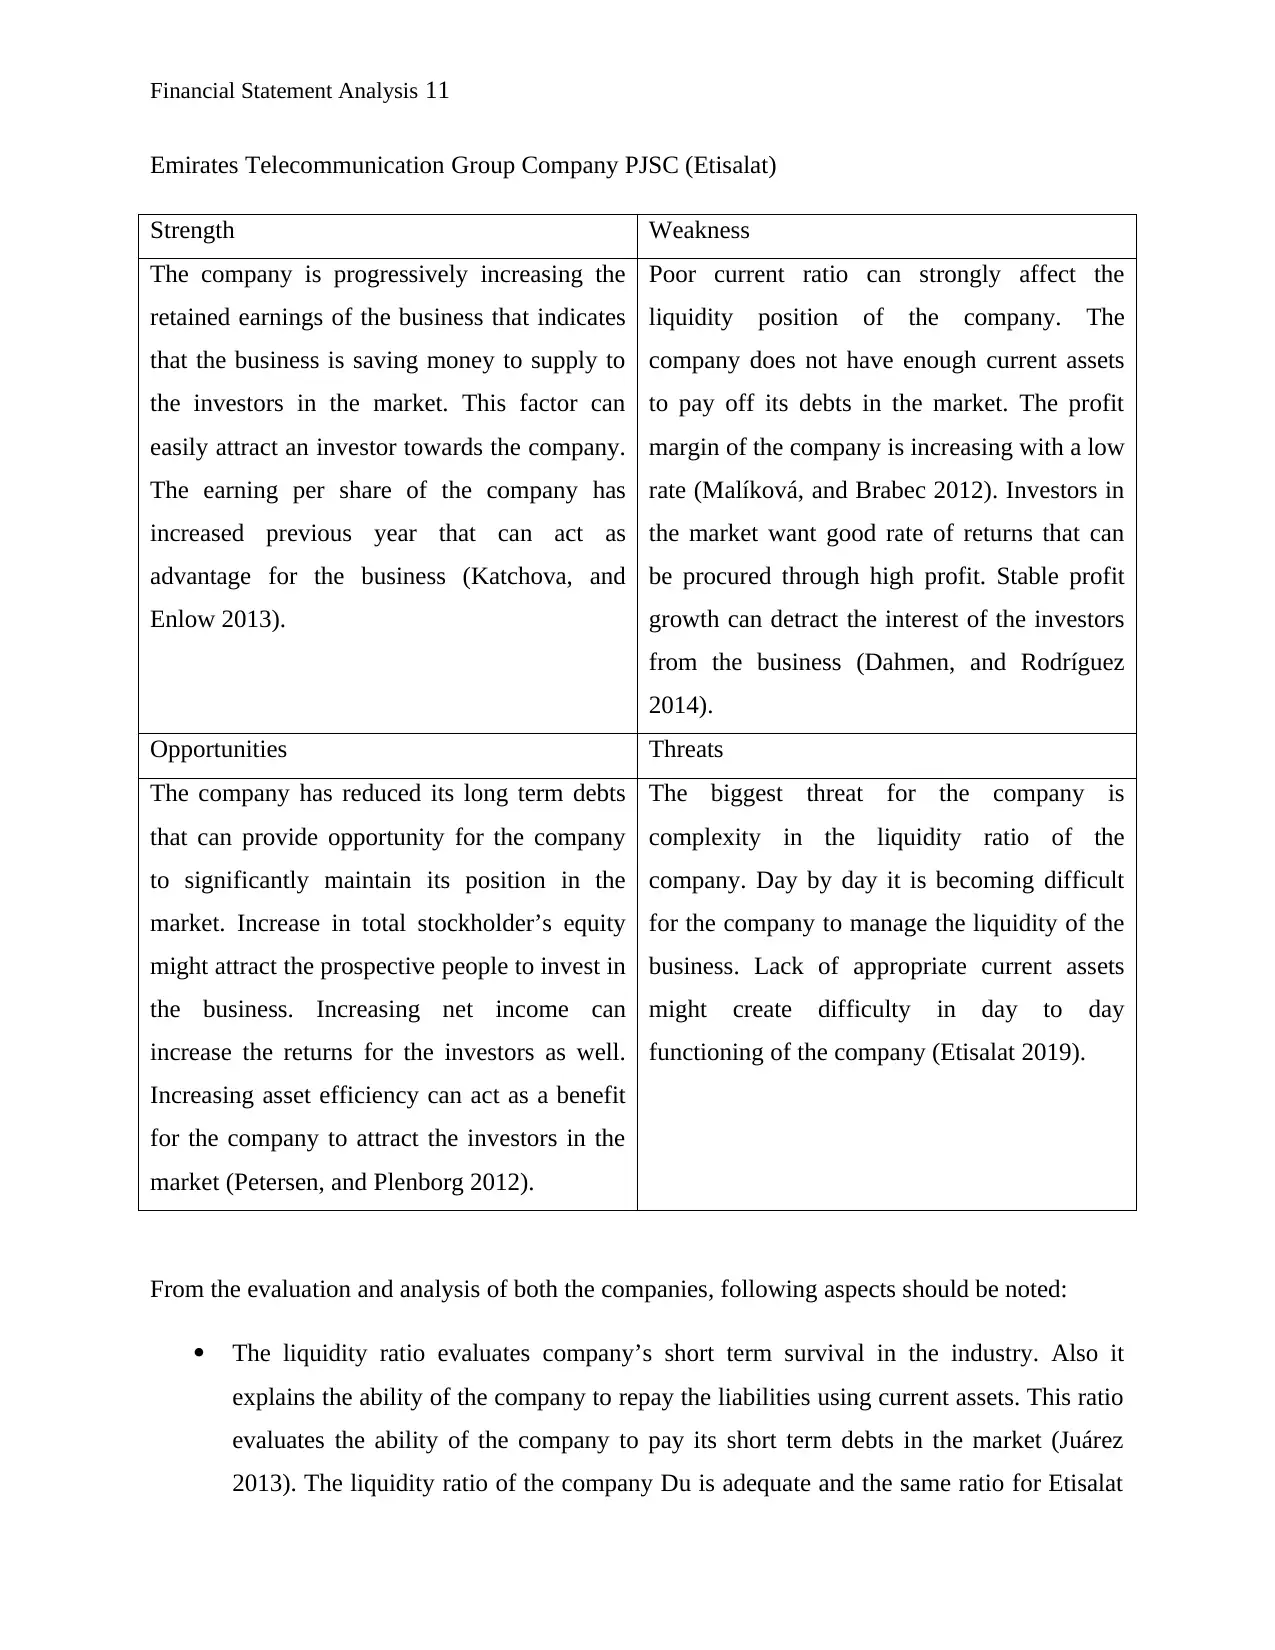
Findings and Discussion
From the above mentioned analysis it has been found that both the companies are efficiently
working in the UAE markets. On the basis of financial analysis of the both the companies, the
SWOT analysis is mentioned below:
Emirates Integrated Telecommunications Company (Du)
Strength Weakness
The solvency ratio of the company states that it
has less risk of making its business solvent.
The company has showed benefit in terms of
its debt to equity ratio. The credit sales of the
company have been increased that has
successfully resulted in procuring revenue for
the company. The company has maintained its
image in the market by quickly squaring off the
short term credits. The company is consistent
in providing profits to its stakeholders in the
market (Hitchner 2010).
Growth is appreciable for EITC but the
company is proceeding with a slow growth
rate. The net margin rate of the company has
reduced from past two years. The company has
reduced its short term investments. The total
assets of the organization have been decreased
that might affect the interest of investor in the
business. Short term investments reflect the
liquidity of the company and long term assets
explain the long term performance of the
company (Fraser, Ormiston, and Fraser 2010).
Opportunities Threats
The goodwill of the company has been
consistent from past two years. So, it should be
noted that increment in retained earning can
attract the prospective investors to invest in the
shares of the company. The company gained
varied opportunity to increase the goodwill of
the business. Increment in revenue will also
open various opportunities for the company to
invest their earnings in the right direction
(Almazari 2012).
The company is consistent in providing
earning per share that can significantly affect
the interest of investors in the market. A person
wish to invest in a company in which they can
see increasing profits for the stakeholders.
Fixed EPS do not attract investors in the
company. Increasing return on share prompts
the people to invest and earn in the company
(Brooks, and Mukherjee 2013).
Financial Statement Analysis 11
Emirates Telecommunication Group Company PJSC (Etisalat)
Strength Weakness
The company is progressively increasing the
retained earnings of the business that indicates
that the business is saving money to supply to
the investors in the market. This factor can
easily attract an investor towards the company.
The earning per share of the company has
increased previous year that can act as
advantage for the business (Katchova, and
Enlow 2013).
Poor current ratio can strongly affect the
liquidity position of the company. The
company does not have enough current assets
to pay off its debts in the market. The profit
margin of the company is increasing with a low
rate (Malíková, and Brabec 2012). Investors in
the market want good rate of returns that can
be procured through high profit. Stable profit
growth can detract the interest of the investors
from the business (Dahmen, and Rodríguez
2014).
Opportunities Threats
The company has reduced its long term debts
that can provide opportunity for the company
to significantly maintain its position in the
market. Increase in total stockholder’s equity
might attract the prospective people to invest in
the business. Increasing net income can
increase the returns for the investors as well.
Increasing asset efficiency can act as a benefit
for the company to attract the investors in the
market (Petersen, and Plenborg 2012).
The biggest threat for the company is
complexity in the liquidity ratio of the
company. Day by day it is becoming difficult
for the company to manage the liquidity of the
business. Lack of appropriate current assets
might create difficulty in day to day
functioning of the company (Etisalat 2019).
From the evaluation and analysis of both the companies, following aspects should be noted:
The liquidity ratio evaluates company’s short term survival in the industry. Also it
explains the ability of the company to repay the liabilities using current assets. This ratio
evaluates the ability of the company to pay its short term debts in the market (Juárez
2013). The liquidity ratio of the company Du is adequate and the same ratio for Etisalat
⊘ This is a preview!⊘
Do you want full access?
Subscribe today to unlock all pages.
Trusted by 1+ million students worldwide
1 out of 28
Related Documents


Your All-in-One AI-Powered Toolkit for Academic Success.
+13062052269
info@desklib.com
Available 24*7 on WhatsApp / Email
![[object Object]](/_next/static/media/star-bottom.7253800d.svg)
Unlock your academic potential
Copyright © 2020–2026 A2Z Services. All Rights Reserved. Developed and managed by ZUCOL.