University Taxation Data Analysis Report for FIN10002 Assignment 2
VerifiedAdded on 2022/10/12
|19
|2999
|272
Report
AI Summary
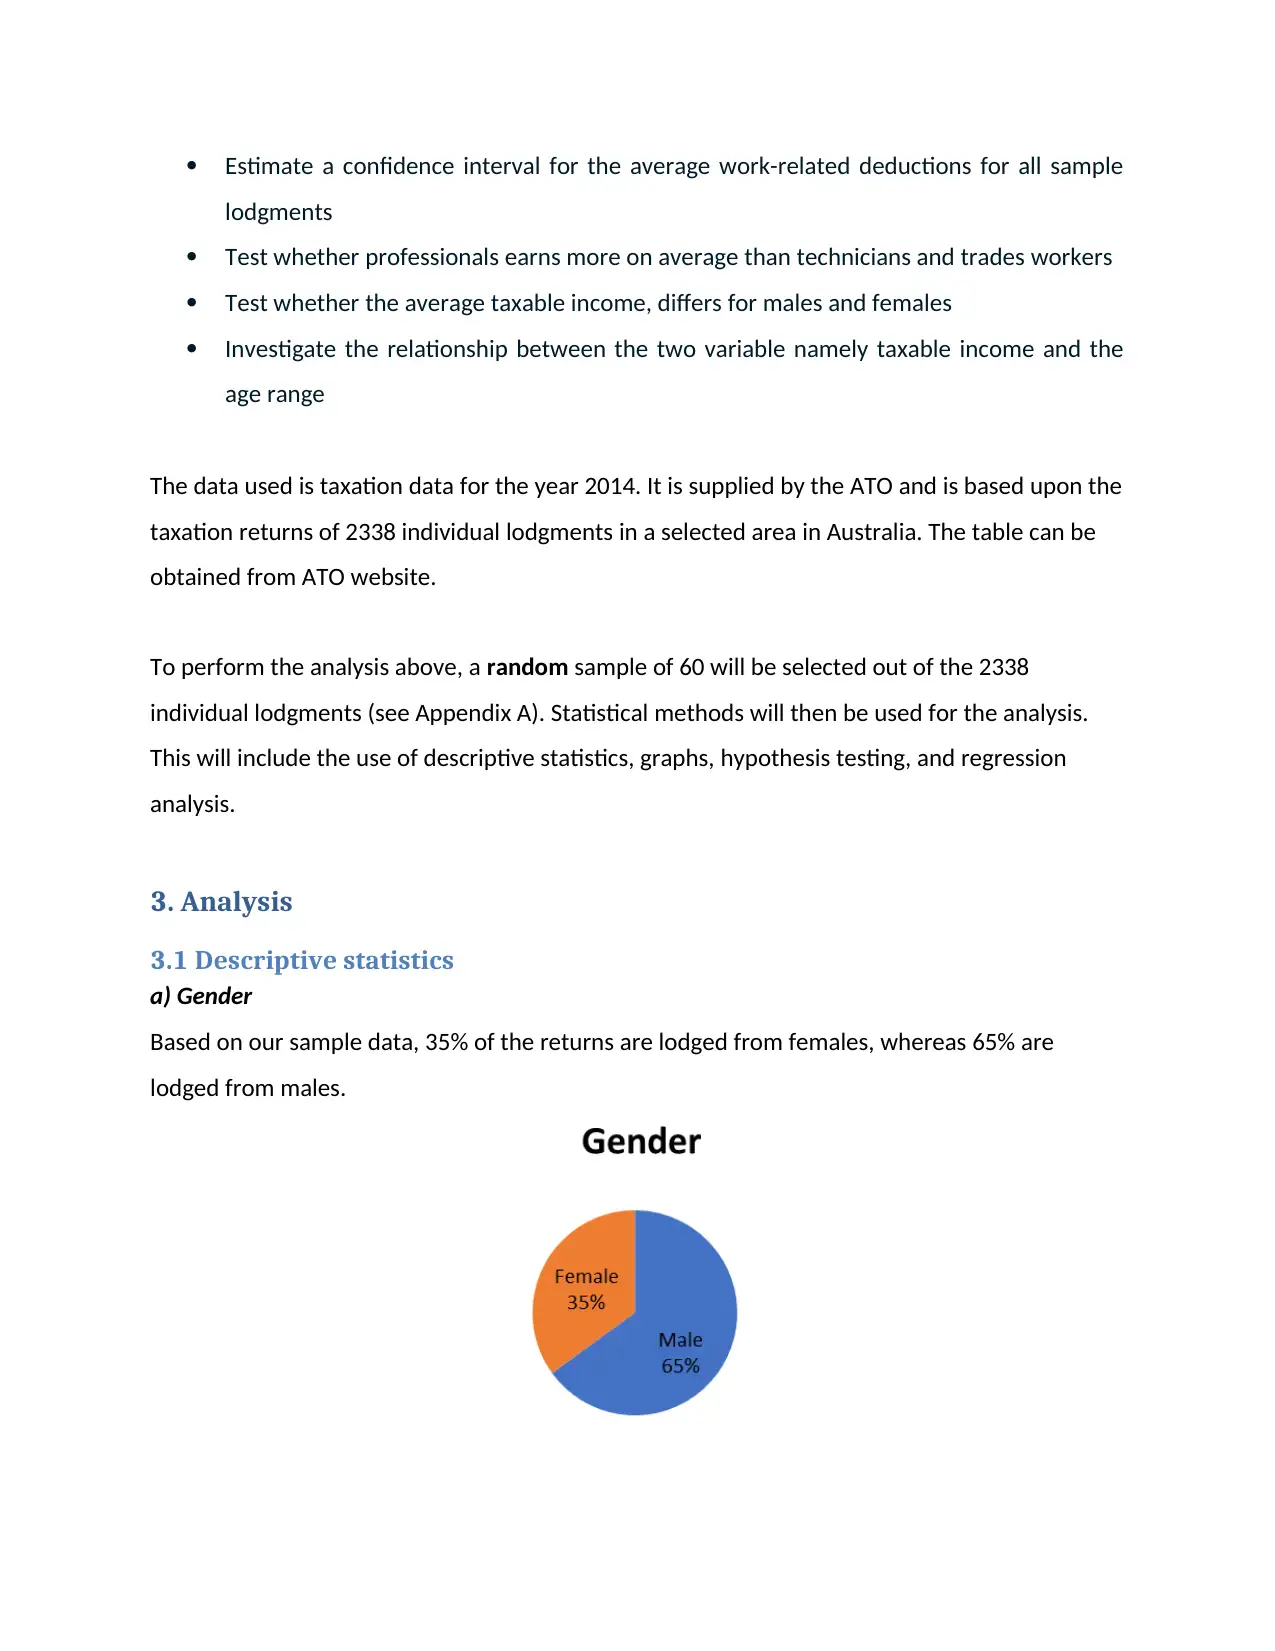
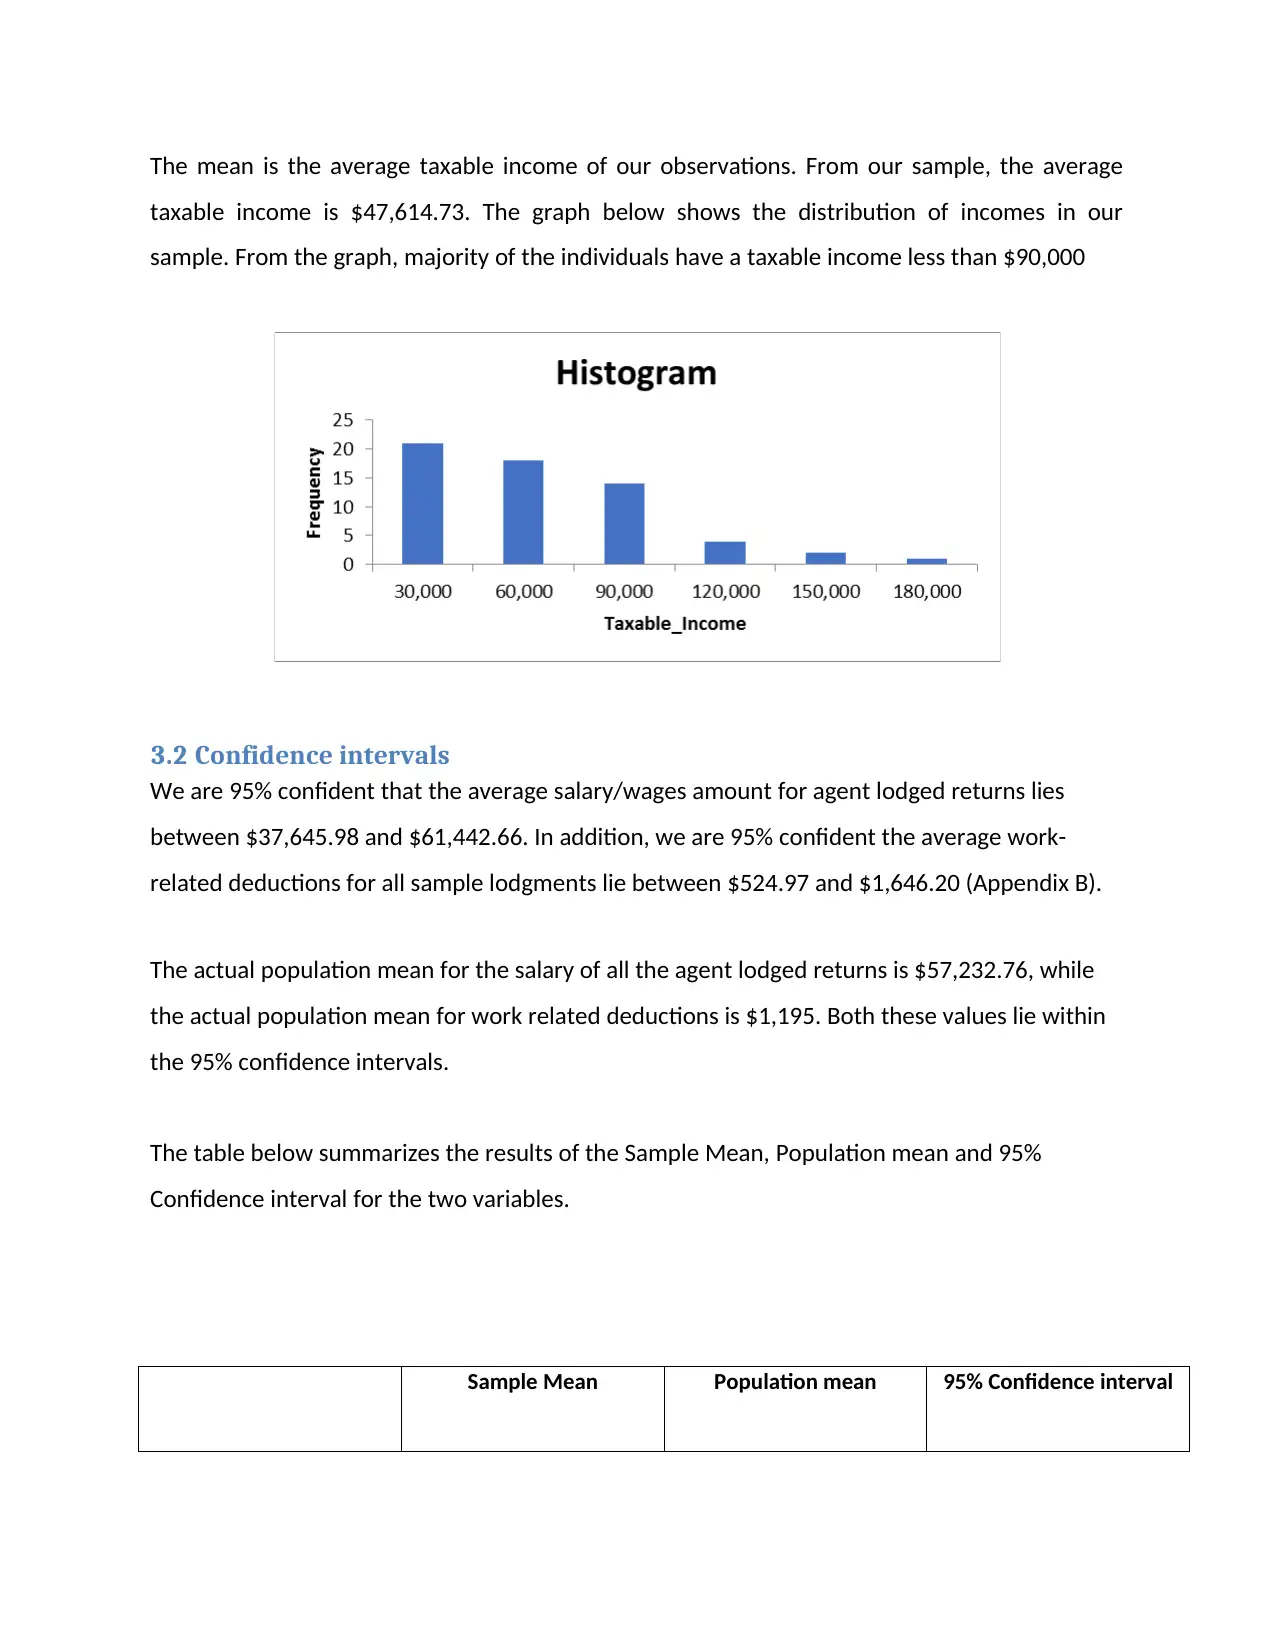
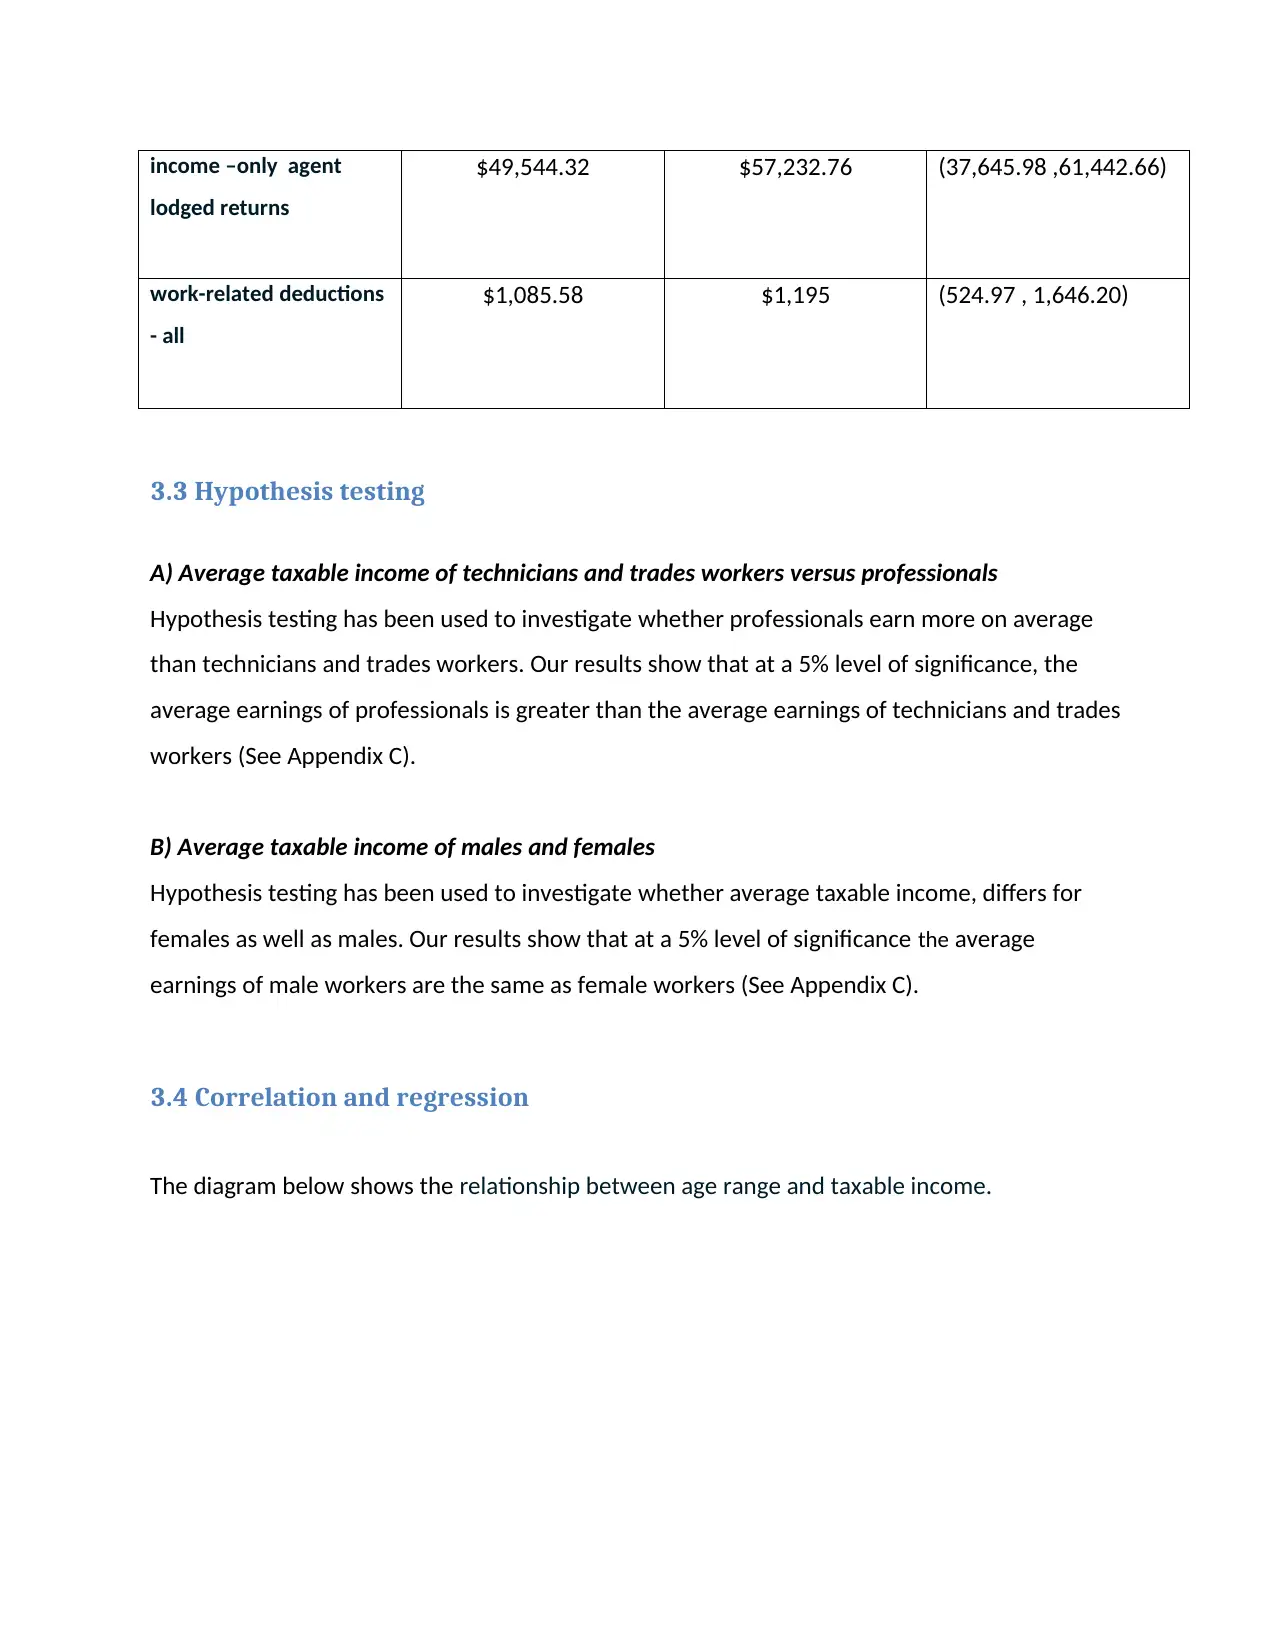
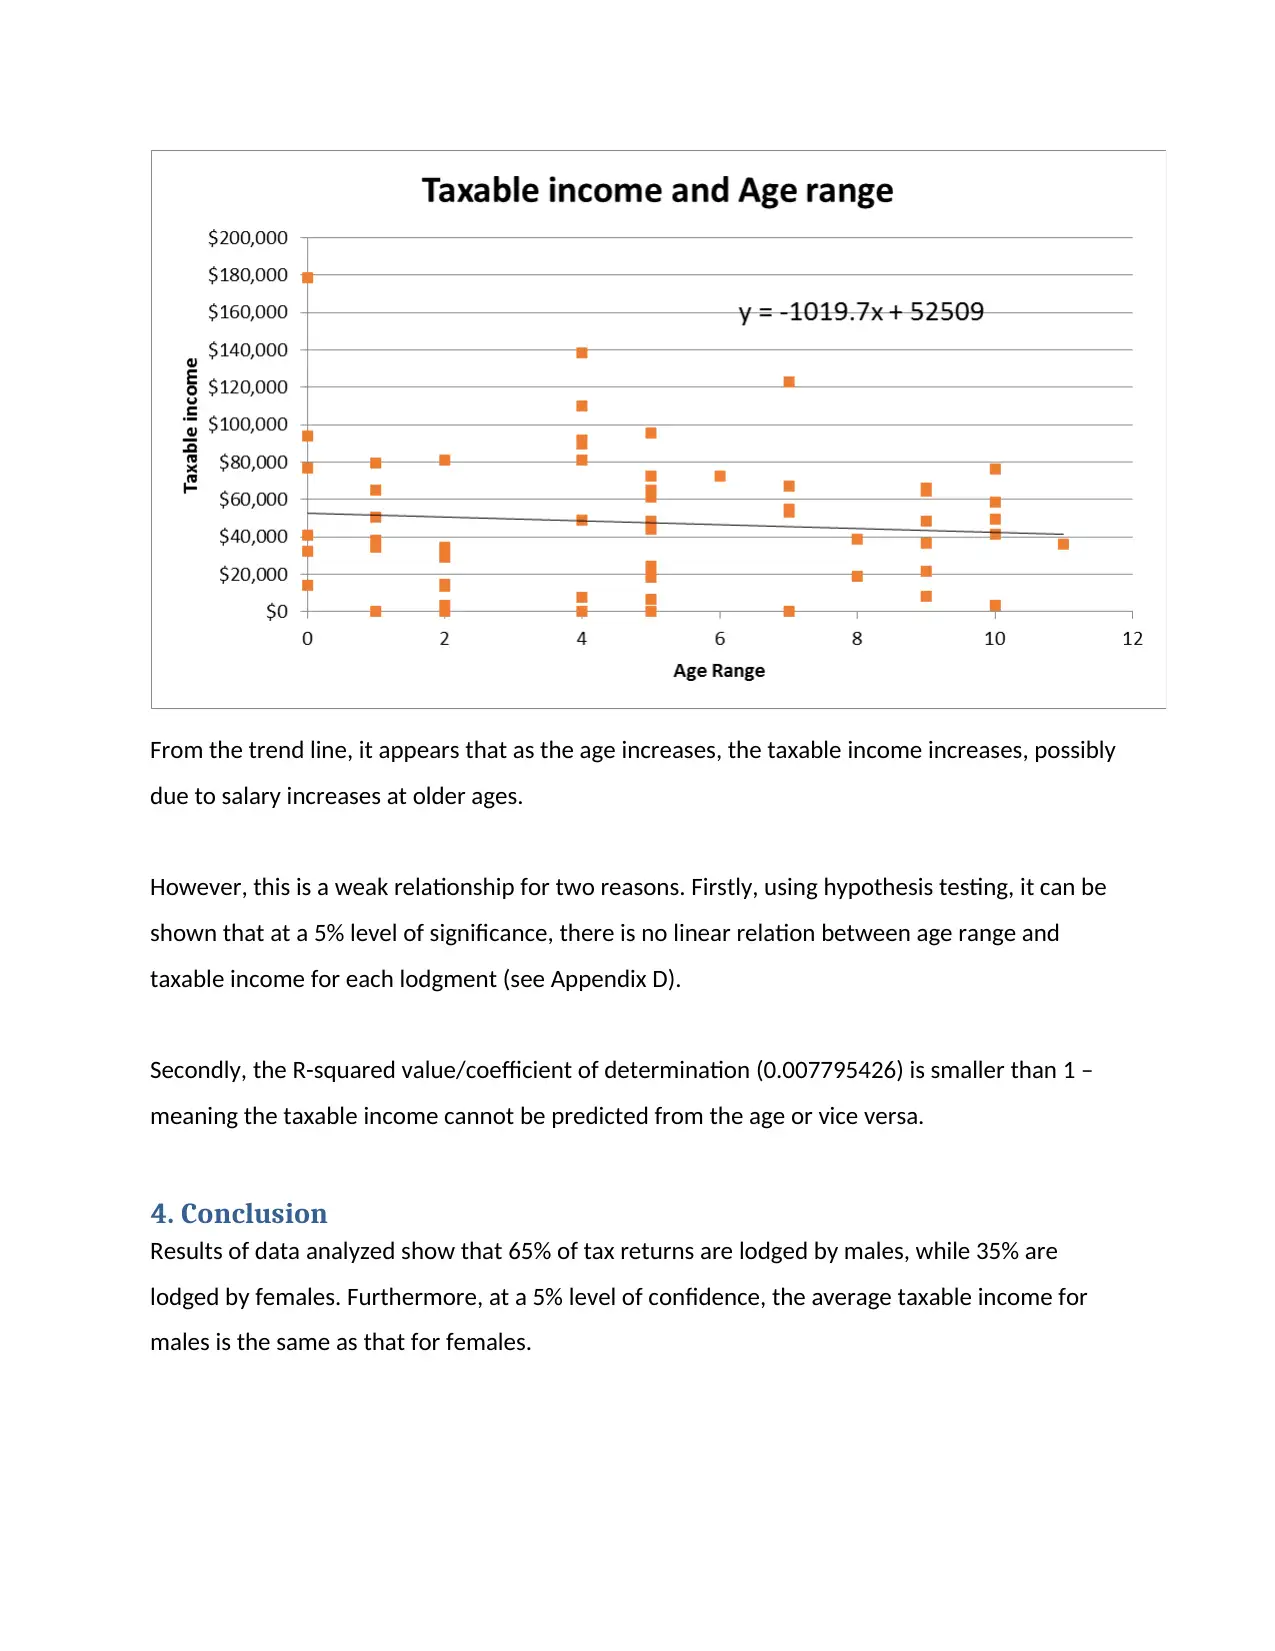
This report presents an analysis of Australian taxation returns from 2014, based on a dataset of 2338 individual lodgments. The analysis employs descriptive statistics, confidence intervals, hypothesis testing, and regression analysis to examine various aspects of the data. Key findings include the gender distribution of lodgments, age and occupation demographics, and income summaries. The report calculates confidence intervals for average salaries and work-related deductions, tests hypotheses regarding income differences between professional and technician/trade workers, and investigates the relationship between age and taxable income. The analysis reveals that the average taxable income was $47,614, with the majority earning less than $30,000. The report also finds that there is no significant relationship between age and taxable income, and professional workers earn more than technicians or trades workers. The report concludes with a discussion of the limitations of the analysis, including missing occupation data for some lodgments.

COVER PAGE
Paraphrase This Document
Need a fresh take? Get an instant paraphrase of this document with our AI Paraphraser

Table of Contents
1. Executive Summary.................................................................................................................................3
2. Introduction.............................................................................................................................................3
3. Analysis....................................................................................................................................................4
3.1 Descriptive statistics..........................................................................................................................4
3.2 Confidence intervals..........................................................................................................................9
3.3 Hypothesis testing...........................................................................................................................10
3.4 Correlation and regression..............................................................................................................10
4. Conclusion.............................................................................................................................................11
Appendix...................................................................................................................................................13

1. Executive Summary
This report summarizes the statistical results of the 2014 taxation returns in Australia. The
method of analysis includes use of descriptive statistics, graphs, hypothesis testing, and
regression analysis. Detailed calculations are included the appendices.
Results of data analyzed reveal that majority of tax returns are lodged by males. Despite the
controversial topic that male workers earn more than female workers, the data shows there is
no significant difference in the average taxable income between males and females.
Additionally, returns are mostly lodged by individuals over age 20 and there is no relationship
between age range and taxable income for each lodgment.
In 2014, the average taxable income was $49,680; however majority of the population received
a taxable income of less than $30,000.
The report also finds the average salary amount for agent lodged returns lies between
$37,645.98 and $61,442.66. In addition, the average work-related deductions for all sample
lodgments lie between $524.97 and $1,646.20.
The report also shows that some occupations such as professionals earn more income than
others e.g. technician and trade workers.
2. Introduction
The purpose of this report is to provide an analysis of taxation returns of individuals lodged
from a selected area of Australia. It will cover the following:-
Describe the characteristics of the sample
Estimate a confidence intervals for the average salary or wage amount for agent lodged
returns only
⊘ This is a preview!⊘
Do you want full access?
Subscribe today to unlock all pages.

Trusted by 1+ million students worldwide

Estimate a confidence interval for the average work-related deductions for all sample
lodgments
Test whether professionals earns more on average than technicians and trades workers
Test whether the average taxable income, differs for males and females
Investigate the relationship between the two variable namely taxable income and the
age range
The data used is taxation data for the year 2014. It is supplied by the ATO and is based upon the
taxation returns of 2338 individual lodgments in a selected area in Australia. The table can be
obtained from ATO website.
To perform the analysis above, a random sample of 60 will be selected out of the 2338
individual lodgments (see Appendix A). Statistical methods will then be used for the analysis.
This will include the use of descriptive statistics, graphs, hypothesis testing, and regression
analysis.
3. Analysis
3.1 Descriptive statistics
a) Gender
Based on our sample data, 35% of the returns are lodged from females, whereas 65% are
lodged from males.
Paraphrase This Document
Need a fresh take? Get an instant paraphrase of this document with our AI Paraphraser

b) Age Distribution
The table and graph below shows the age distribution of the sample data.
Age ranges Age ranges –
description
Frequency %
0 70 and over 10%
1 65 to 69 10%
2 60 to 64 13%
3 55 to 59 0%
4 50 to 54 13%
5 45 to 49 18%
6 40 to 44 2%
7 35 to 39 10%
8 30 to 34 3%
9 25 to 29 10%
10 20 to 24 8%
11 under 20 2%
From the chart we observe that majority of the lodgments are from workers aged over 20 as
expected. Furthermore there is an average representation of each age group in the data.
c) Occupation
The table and graph below shows the occupation of the sample data.

Occupation code (one digit
level)
Broad Occupation
grouping
Frequency %
0
Occupation not listed/
Occupation not specified
33%
1 Managers 7%
2 Professionals 8%
3
Technicians and Trades
Workers
8%
4
Community and Personal
Service Workers
7%
5
Clerical and
Administrative Workers
15%
6 Sales workers 5%
7
Machinery operators and
drivers
3%
8 Labourers 10%
9
Consultants, apprentices
and type not specified or
not listed
3%
From the chart we observe that majority of the lodgments are from workers whose occupation
is not listed/specified, followed by Clerical and Administrative Workers.
d) Total income
The table below shows a summary of statistics in relation to Total income.
⊘ This is a preview!⊘
Do you want full access?
Subscribe today to unlock all pages.

Trusted by 1+ million students worldwide

Summary Statistics
Mean $49,680.05
Median $42,912.50
Standard Deviation 38977.954
Minimum -$2,856
Maximum $178,839
The mean is the average of the data set and is the most common statistics. From our sample,
the average total income is $49,680. The standard deviation is a measure of the distance of
each value from the mean total income. It is calculated as 38977. The median is the value that
appears in the middle of the data set when it is arranged from the lowest to the highest. From
our sample, the median income is $42,912. The maximum and minimum values are the highest
and lowest incomes. These are $178,839 and -$2856 respectively.
The graph below shows the distribution of incomes in our sample. From the graph, majority of
the individuals have a total income less than $30,000
e) Work Related Deductions total
The table below shows a summary of statistics in relation to Work Related Deductions total
Summary Statistics
Mean $1,085.58
Median $161.50
Standard deviation 2170.79
Paraphrase This Document
Need a fresh take? Get an instant paraphrase of this document with our AI Paraphraser

Minimum $0
Maximum $10,097
The mean is the average work related deductions in our observations. From our sample, the
average work related deductions are $1,085.58. The standard deviation is calculated as
2170.79. The median is the value that appears in the middle of the data set when it is arranged
from the lowest to the highest. From our sample, the median work related deductions are
$161.50.
The graph below shows the distribution of incomes in our sample. From the graph, majority of
the work related deductions are less than $1,700
f) Taxable income (total income less total deductions)
The table below shows a summary of statistics in relation to Total income.
Summary Statistics
Mean $47,614.73
Median $42,688.50
Standard Deviation 37547.50
Minimum $0
Maximum $178,626

The mean is the average taxable income of our observations. From our sample, the average
taxable income is $47,614.73. The graph below shows the distribution of incomes in our
sample. From the graph, majority of the individuals have a taxable income less than $90,000
3.2 Confidence intervals
We are 95% confident that the average salary/wages amount for agent lodged returns lies
between $37,645.98 and $61,442.66. In addition, we are 95% confident the average work-
related deductions for all sample lodgments lie between $524.97 and $1,646.20 (Appendix B).
The actual population mean for the salary of all the agent lodged returns is $57,232.76, while
the actual population mean for work related deductions is $1,195. Both these values lie within
the 95% confidence intervals.
The table below summarizes the results of the Sample Mean, Population mean and 95%
Confidence interval for the two variables.
Sample Mean Population mean 95% Confidence interval
⊘ This is a preview!⊘
Do you want full access?
Subscribe today to unlock all pages.

Trusted by 1+ million students worldwide

income –only agent
lodged returns
$49,544.32 $57,232.76 (37,645.98 ,61,442.66)
work-related deductions
- all
$1,085.58 $1,195 (524.97 , 1,646.20)
3.3 Hypothesis testing
A) Average taxable income of technicians and trades workers versus professionals
Hypothesis testing has been used to investigate whether professionals earn more on average
than technicians and trades workers. Our results show that at a 5% level of significance, the
average earnings of professionals is greater than the average earnings of technicians and trades
workers (See Appendix C).
B) Average taxable income of males and females
Hypothesis testing has been used to investigate whether average taxable income, differs for
females as well as males. Our results show that at a 5% level of significance the average
earnings of male workers are the same as female workers (See Appendix C).
3.4 Correlation and regression
The diagram below shows the relationship between age range and taxable income.
Paraphrase This Document
Need a fresh take? Get an instant paraphrase of this document with our AI Paraphraser

From the trend line, it appears that as the age increases, the taxable income increases, possibly
due to salary increases at older ages.
However, this is a weak relationship for two reasons. Firstly, using hypothesis testing, it can be
shown that at a 5% level of significance, there is no linear relation between age range and
taxable income for each lodgment (see Appendix D).
Secondly, the R-squared value/coefficient of determination (0.007795426) is smaller than 1 –
meaning the taxable income cannot be predicted from the age or vice versa.
4. Conclusion
Results of data analyzed show that 65% of tax returns are lodged by males, while 35% are
lodged by females. Furthermore, at a 5% level of confidence, the average taxable income for
males is the same as that for females.

Results also show that tax returns are mostly lodged by individuals over 20 years old.
Furthermore, the report also showed that there is no significant relationship between age and
taxable income. That is, taxable income cannot be predicted from the age.
In 2014, the average taxable income was $47,614. However, majority of the population
received a taxable income of less than $30,000.
The report also reveals that the average salary amount for agent lodged returns lies between
$37,645.98 and $61,442.66. In addition, the average work-related deductions for all sample
lodgments lie between $524.97 and $1,646.20.
Finally, the report also finds that professional workers earn more in income than technicians or
trades workers. One of the limitations to this analysis is about a third of the lodged returns did
not have their occupations listed or specified. Hence results regarding relationship between
occupations and income will need further review.
⊘ This is a preview!⊘
Do you want full access?
Subscribe today to unlock all pages.

Trusted by 1+ million students worldwide
1 out of 19
Related Documents
Your All-in-One AI-Powered Toolkit for Academic Success.
+13062052269
info@desklib.com
Available 24*7 on WhatsApp / Email
Unlock your academic potential
Copyright © 2020–2026 A2Z Services. All Rights Reserved. Developed and managed by ZUCOL.


