FIN200 Trimester 2 Assignment: Analyzing CML, SML, and CAPM Model
VerifiedAdded on 2023/06/07
|12
|2832
|378
Report
AI Summary
This report provides a detailed analysis of Capital Market Line (CML) and Security Market Line (SML), highlighting their differences in risk evaluation and application in investment decisions. It discusses the significance of minimum variance portfolios in supporting conservative investment strategies and diversifying financial instruments to reduce risk. Furthermore, the report explores the Capital Asset Pricing Model (CAPM), emphasizing its relevance in calculating expected returns and its simplicity compared to alternative models, while also acknowledging its limitations. The assessment concludes that understanding these financial theories is crucial for investors in managing risk and optimizing portfolio returns. Desklib offers a range of solved assignments and study resources to aid students in mastering these concepts.

Running head: CORPORATE FINANCE
Corporate Finance
Name of the Student:
Name of the University:
Authors Note:
Corporate Finance
Name of the Student:
Name of the University:
Authors Note:
Paraphrase This Document
Need a fresh take? Get an instant paraphrase of this document with our AI Paraphraser

CORPORATE FINANCE
1
Table of Contents
Introduction:...............................................................................................................................2
Capital Market Line and Security Market Line difference:.......................................................2
Minimum variance portfolio Significance:................................................................................5
CAPM calculation description and analysis:.............................................................................7
Conclusion:................................................................................................................................9
References:...............................................................................................................................10
CORPORATE FINANCE
2
Introduction:
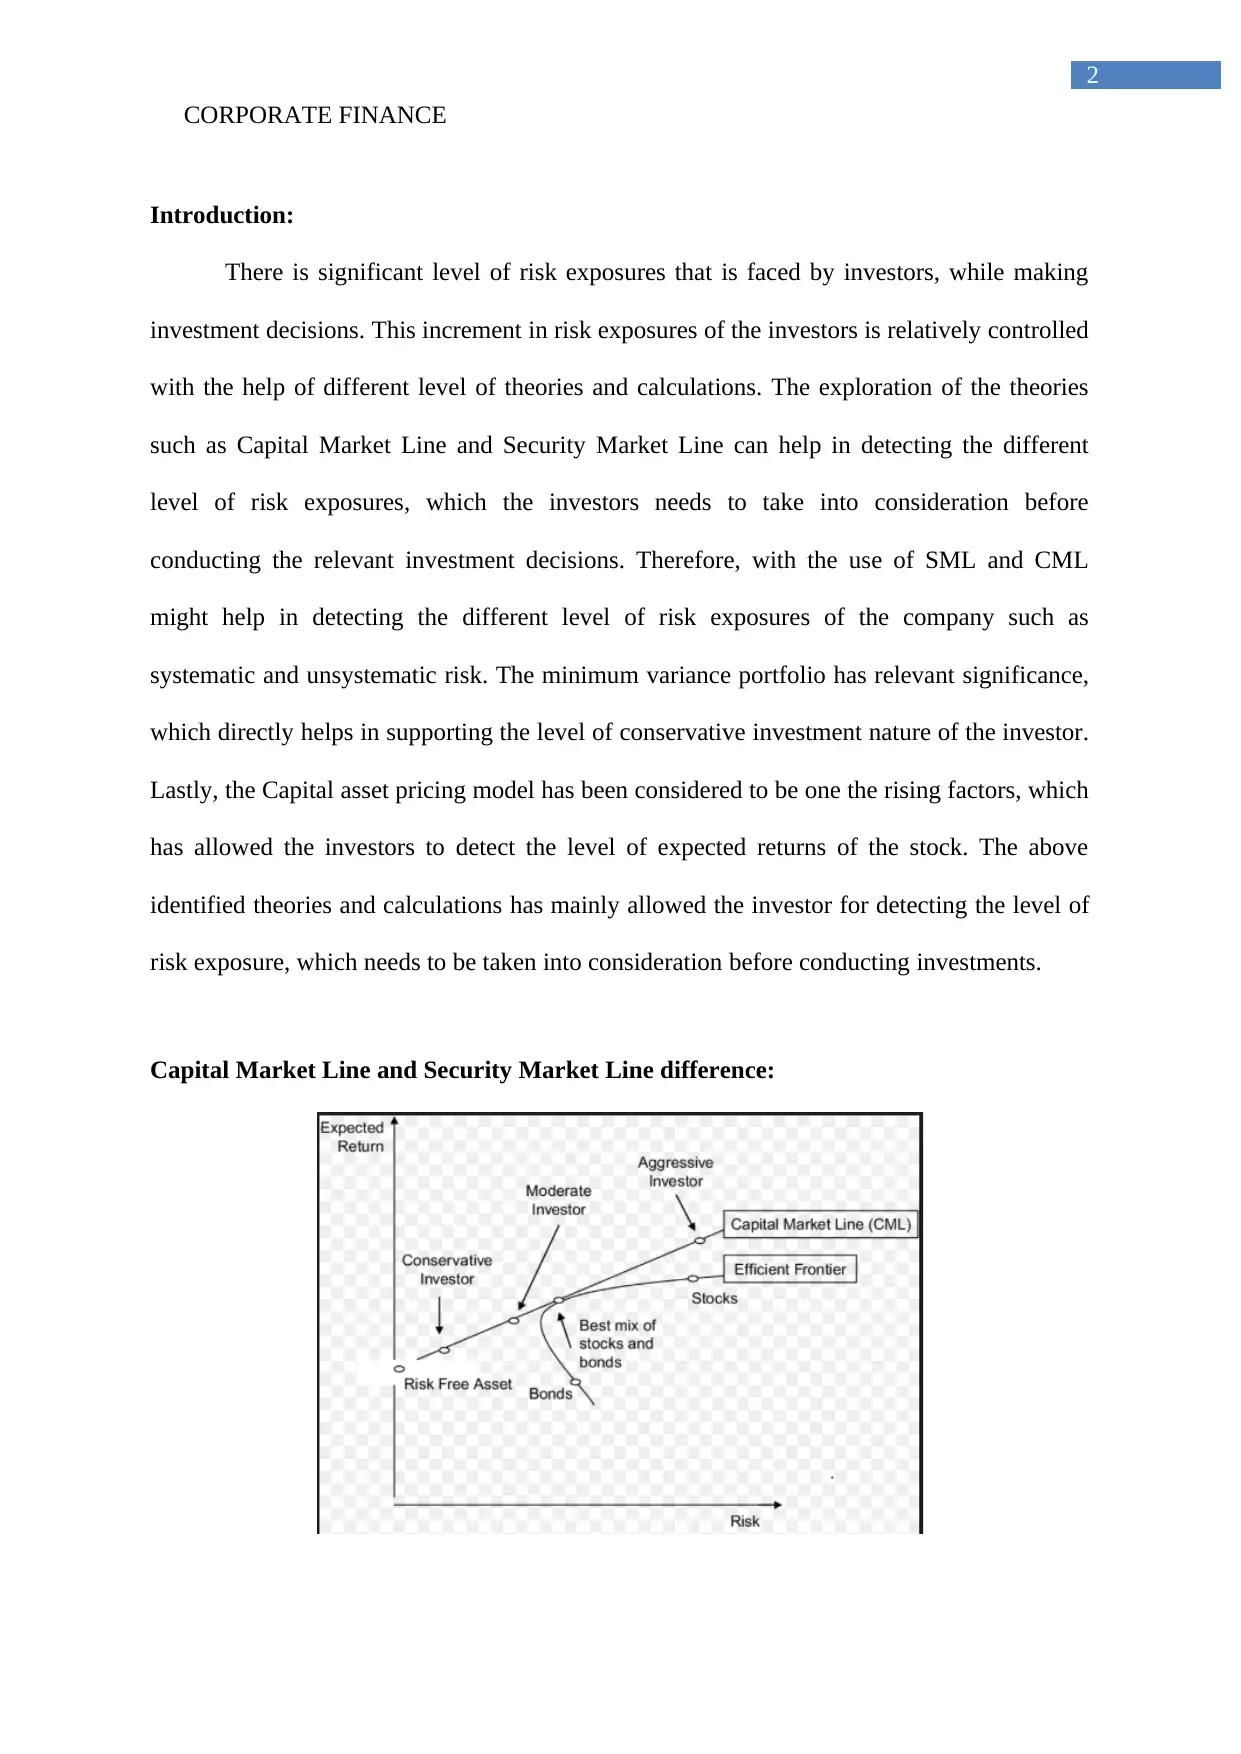
There is significant level of risk exposures that is faced by investors, while making
investment decisions. This increment in risk exposures of the investors is relatively controlled
with the help of different level of theories and calculations. The exploration of the theories
such as Capital Market Line and Security Market Line can help in detecting the different
level of risk exposures, which the investors needs to take into consideration before
conducting the relevant investment decisions. Therefore, with the use of SML and CML
might help in detecting the different level of risk exposures of the company such as
systematic and unsystematic risk. The minimum variance portfolio has relevant significance,
which directly helps in supporting the level of conservative investment nature of the investor.
Lastly, the Capital asset pricing model has been considered to be one the rising factors, which
has allowed the investors to detect the level of expected returns of the stock. The above
identified theories and calculations has mainly allowed the investor for detecting the level of
risk exposure, which needs to be taken into consideration before conducting investments.
Capital Market Line and Security Market Line difference:
2
Introduction:
There is significant level of risk exposures that is faced by investors, while making
investment decisions. This increment in risk exposures of the investors is relatively controlled
with the help of different level of theories and calculations. The exploration of the theories
such as Capital Market Line and Security Market Line can help in detecting the different
level of risk exposures, which the investors needs to take into consideration before
conducting the relevant investment decisions. Therefore, with the use of SML and CML
might help in detecting the different level of risk exposures of the company such as
systematic and unsystematic risk. The minimum variance portfolio has relevant significance,
which directly helps in supporting the level of conservative investment nature of the investor.
Lastly, the Capital asset pricing model has been considered to be one the rising factors, which
has allowed the investors to detect the level of expected returns of the stock. The above
identified theories and calculations has mainly allowed the investor for detecting the level of
risk exposure, which needs to be taken into consideration before conducting investments.
Capital Market Line and Security Market Line difference:
⊘ This is a preview!⊘
Do you want full access?
Subscribe today to unlock all pages.
Trusted by 1+ million students worldwide
CORPORATE FINANCE
3
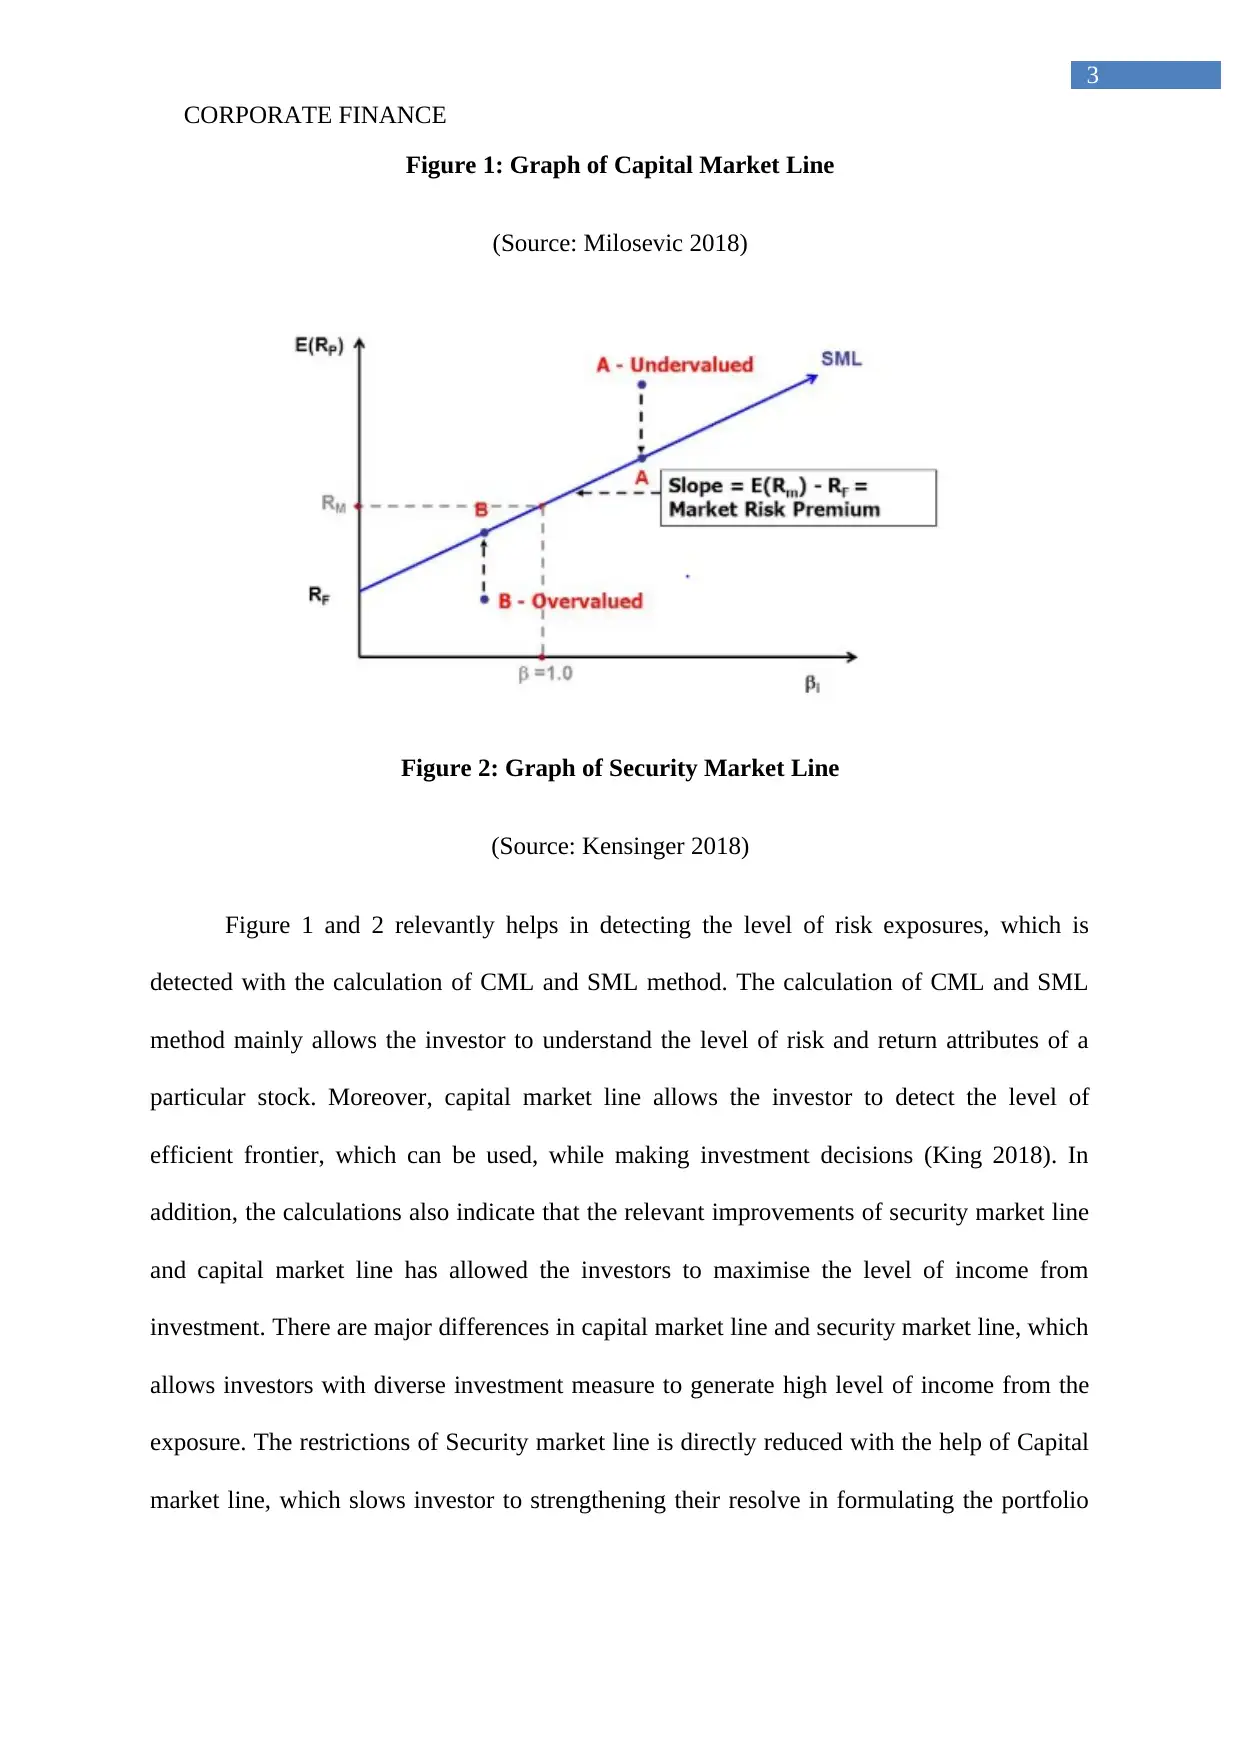
Figure 1: Graph of Capital Market Line
(Source: Milosevic 2018)
Figure 2: Graph of Security Market Line
(Source: Kensinger 2018)
Figure 1 and 2 relevantly helps in detecting the level of risk exposures, which is
detected with the calculation of CML and SML method. The calculation of CML and SML
method mainly allows the investor to understand the level of risk and return attributes of a
particular stock. Moreover, capital market line allows the investor to detect the level of
efficient frontier, which can be used, while making investment decisions (King 2018). In
addition, the calculations also indicate that the relevant improvements of security market line
and capital market line has allowed the investors to maximise the level of income from
investment. There are major differences in capital market line and security market line, which
allows investors with diverse investment measure to generate high level of income from the
exposure. The restrictions of Security market line is directly reduced with the help of Capital
market line, which slows investor to strengthening their resolve in formulating the portfolio
3
Figure 1: Graph of Capital Market Line
(Source: Milosevic 2018)
Figure 2: Graph of Security Market Line
(Source: Kensinger 2018)
Figure 1 and 2 relevantly helps in detecting the level of risk exposures, which is
detected with the calculation of CML and SML method. The calculation of CML and SML
method mainly allows the investor to understand the level of risk and return attributes of a
particular stock. Moreover, capital market line allows the investor to detect the level of
efficient frontier, which can be used, while making investment decisions (King 2018). In
addition, the calculations also indicate that the relevant improvements of security market line
and capital market line has allowed the investors to maximise the level of income from
investment. There are major differences in capital market line and security market line, which
allows investors with diverse investment measure to generate high level of income from the
exposure. The restrictions of Security market line is directly reduced with the help of Capital
market line, which slows investor to strengthening their resolve in formulating the portfolio
Paraphrase This Document
Need a fresh take? Get an instant paraphrase of this document with our AI Paraphraser
CORPORATE FINANCE
4
(Tejada-Arango et al. 2018). The major differences between capital market line and security
market line are depicted as follows.
The risk evaluating attribute of both CML and SML is different, which can directly have
an impact on the investment decisions of the investor. The calculation conducted in
security market line directly uses different level risk exposures, which can be used for
investment purpose. The SML line directly uses beta for deriving the level of risk and
return capability of the stock, which helps in supporting the level of risk exposure after
conducting investments (Bothfeld and Rosenthal 2018). On the other hand, the CML
method directly utilises the standard deviation for calculating the overall risk of the stocks
listed in the portfolio. In addition, the measure directly utilises different level of risk
exposure to understand the current risk condition of the portfolio.
There is other difference between the CML and SML methods, which directly initiates
different level of risk exposures to understand the current performance of the investment
scope. The security market line directly utilises only one stock and depicts its valuation,
whether they are undervalued or overvalued. This might directly help in detecting the
level of risk exposure for generating high level of income from investment (Sweeney
2018). The calculation that has been conducted in CML line directly allows the investor
to analyse the overall portfolio, which helps in detecting the total risk involved in
investment. However, with the SML method the investors are only able to analyse one
stock and compete its with the market returns. This SML line eventually allowed the
investor to understand the specific risk of the stock, which needs to be borne during the
investment phase. Therefore, investors can utilise both CML and SML method for
creating the adequate portfolio with low risk and high returns (Korinek 2018).
The output data for Capital Market Line and Security Market Line is relevantly different,
which are used by investors to analyse different level of returns that can be generated
CORPORATE FINANCE
5
from investment. The capital market line directly provides relevant calculations, which
help in detecting the overall efficient frontier that comprises of different level of risk and
return measures. The calculations have also allowed the investor to detect different level
of risk and return attributes of a combined portfolio. Moreover, the CML depicts the
systematic and unsystematic risk involved in investment. On the other hand, the SML
method only portrays the systematic risk involved in investment, which does not allow
the investor to determine its profitability. On the contrary, Walter and Kessler (2018)
argued that both CML and SML method does not factor different components of risk,
which increases the level of risk involved in investment.
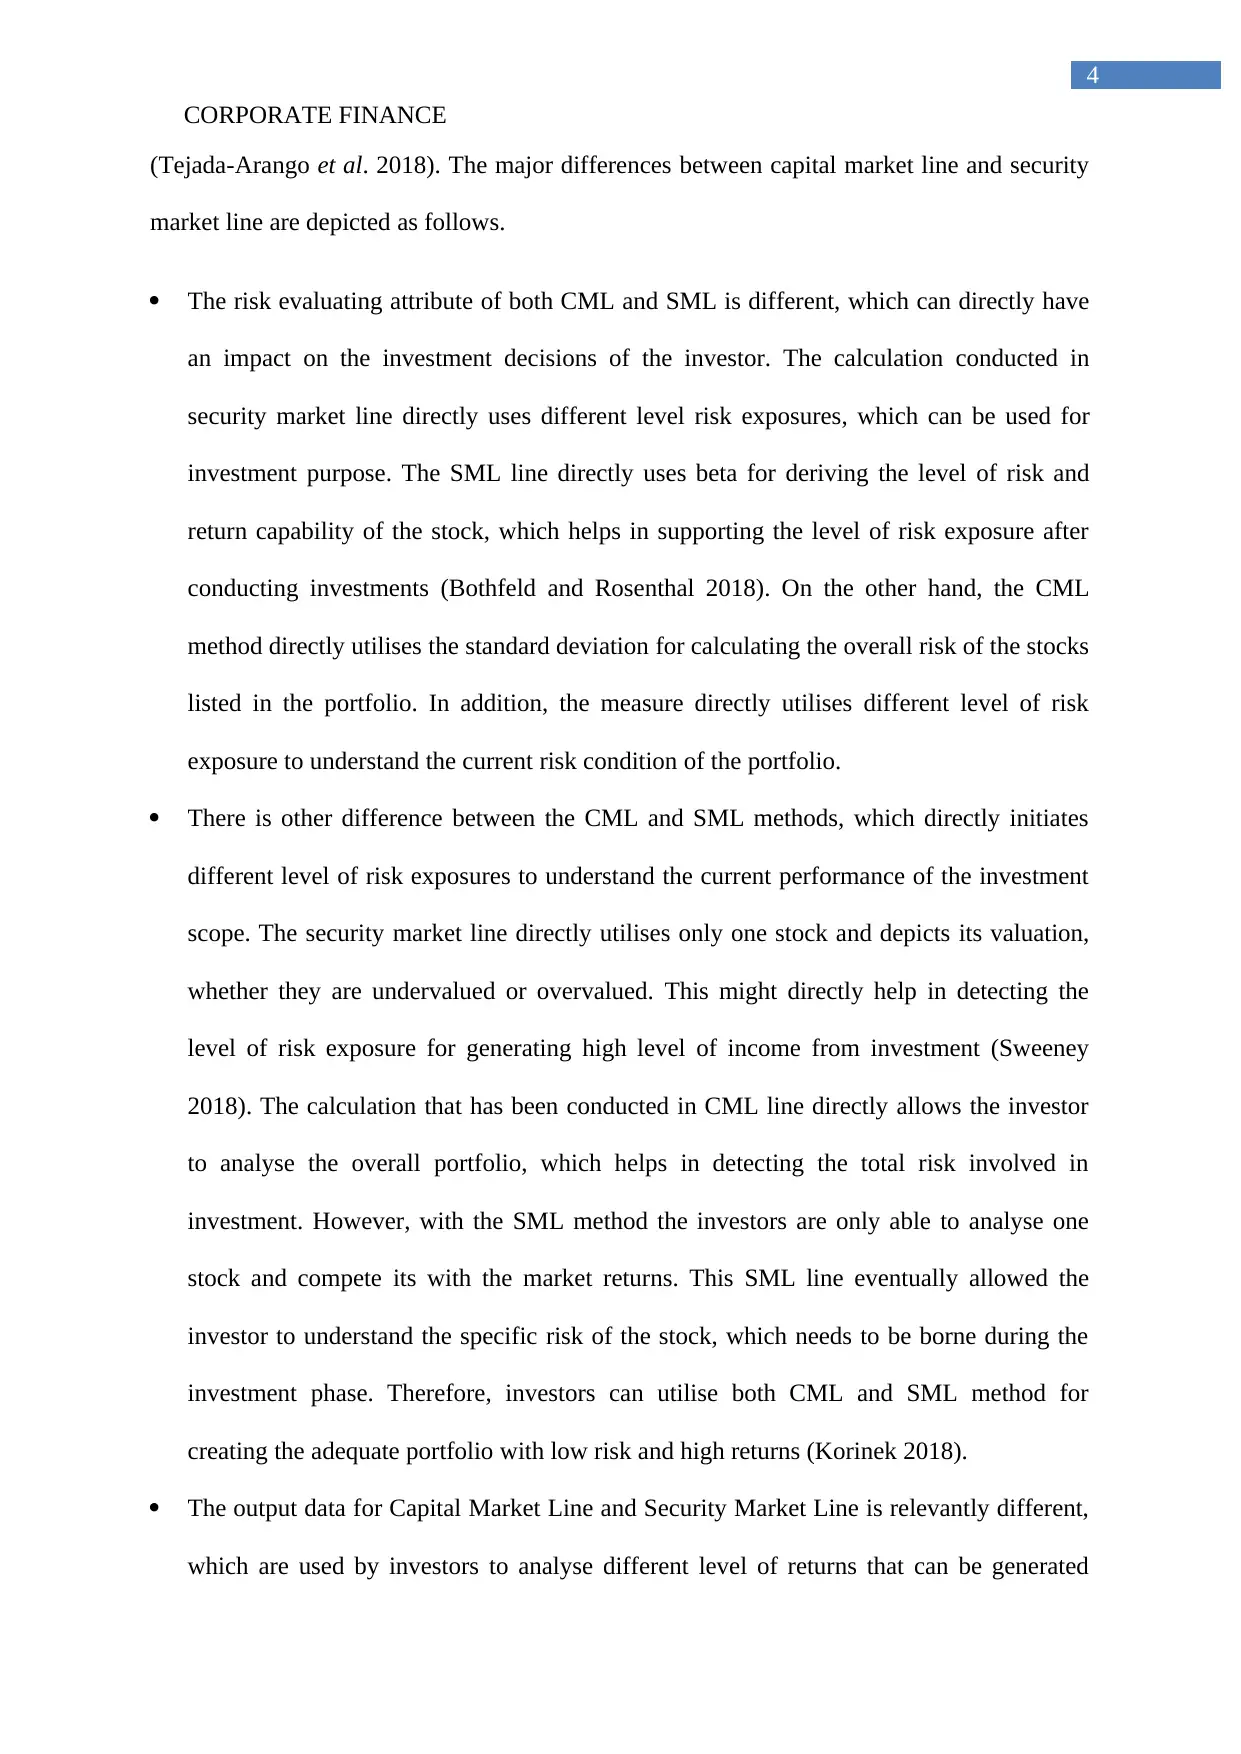
Minimum variance portfolio Significance:
Figure 3: Minimum variance portfolio graph
(Source: Bodnar, Parolya and Schmid 2018)
5
from investment. The capital market line directly provides relevant calculations, which
help in detecting the overall efficient frontier that comprises of different level of risk and
return measures. The calculations have also allowed the investor to detect different level
of risk and return attributes of a combined portfolio. Moreover, the CML depicts the
systematic and unsystematic risk involved in investment. On the other hand, the SML
method only portrays the systematic risk involved in investment, which does not allow
the investor to determine its profitability. On the contrary, Walter and Kessler (2018)
argued that both CML and SML method does not factor different components of risk,
which increases the level of risk involved in investment.
Minimum variance portfolio Significance:
Figure 3: Minimum variance portfolio graph
(Source: Bodnar, Parolya and Schmid 2018)
⊘ This is a preview!⊘
Do you want full access?
Subscribe today to unlock all pages.
Trusted by 1+ million students worldwide
CORPORATE FINANCE
6
The above graph directly indicates the level of minimum variance portfolio, which
can be used by investors in reducing the risk from investment. The minimum variance
portfolio can be used by investors to detect different level of risk exposure, which can be
used for investors for maximising the level of income from investment. The minimum
variance portfolio is mainly identified in the above figure, where the total risk involved in
investment is the lowest. The above graph relevantly represents the efficient curve, which
comprises of different portfolios that have risk and return measures. The minimum variance
portfolio has relevant significance for investors, which is depicted as follows.
The major significance of minimum variance portfolio is its capability to support the
conservative investors with their risk aversion needs. The minimum variance portfolio
directly helps investors to formulate an adequate portfolio, which helps in detecting the
level of risk and return condition of the company. The calculations directly allow the
investor for understanding the current condition of the stocks and how they can react to
volatile capital market fluctuations. Hence, investors using the minimum variance
portfolio are able to understand the level of risk involved in investment, which can be
reduced substantially for maintaining constant returns. On the other hand, Kim and Shin
(2018) criticises that minimum variance portfolio limit capability of the investor to
generate high returns, as it aims in formulating a portfolio, which has low risk.
The second significance of minimum variance portfolio is the overall accommodation of
different level of financial instruments, which can be used for creating an adequate
portfolio that can generate adequate returns with low risk. Therefore, investors with the
help of minimum variance portfolio are able to detect the risk level of different stocks,
which is used for formulating the portfolio. Hence, with the help of Minimum Variance
Portfolio investors are able to use different kinds of financial instruments such as risk free
rate, bonds and equity shares to create an adequate portfolio with the lowest risk. This
Paraphrase This Document
Need a fresh take? Get an instant paraphrase of this document with our AI Paraphraser
CORPORATE FINANCE
7
type of measure eventually allows the investor to extend its current investments scope and
diversified portfolio to reduce the level of risk and maximize the return from investment.
Bednarek and Patel (2018) argued that investors using the minimum variance portfolio is
not able to increase their current return conditions, are a myth uses stocks in a form where
the least risk involved in investment can be exaggerated. This mainly limits the overall
condition of the investors to maximize the returns from investment.
The third significance of minimum variance portfolio is its capability to handle situations
of the capital market, which eventually protects the investor’s capital and reduces the
concern for abnormal losses. Minimum variance portfolio directly uses diverse stocks for
creating the portfolio, which relatively reduces the impact of share price change that is
influenced from the volatile capital market. Therefore investors can use the minimum
variance portfolio technique to create an efficient Frontier, which can help in detecting
the relevant curve of different portfolio combinations. This combination of different
stocks relevantly allow the investors to select an adequate portfolio which can support is
there investment criteria (Qu et al. 2018).
Therefore it would be understood that with the help of minimum variance portfolio
investors are able to analyze different stocks and conduct investments according to their
return requirements.
CAPM calculation description and analysis:
CORPORATE FINANCE
8
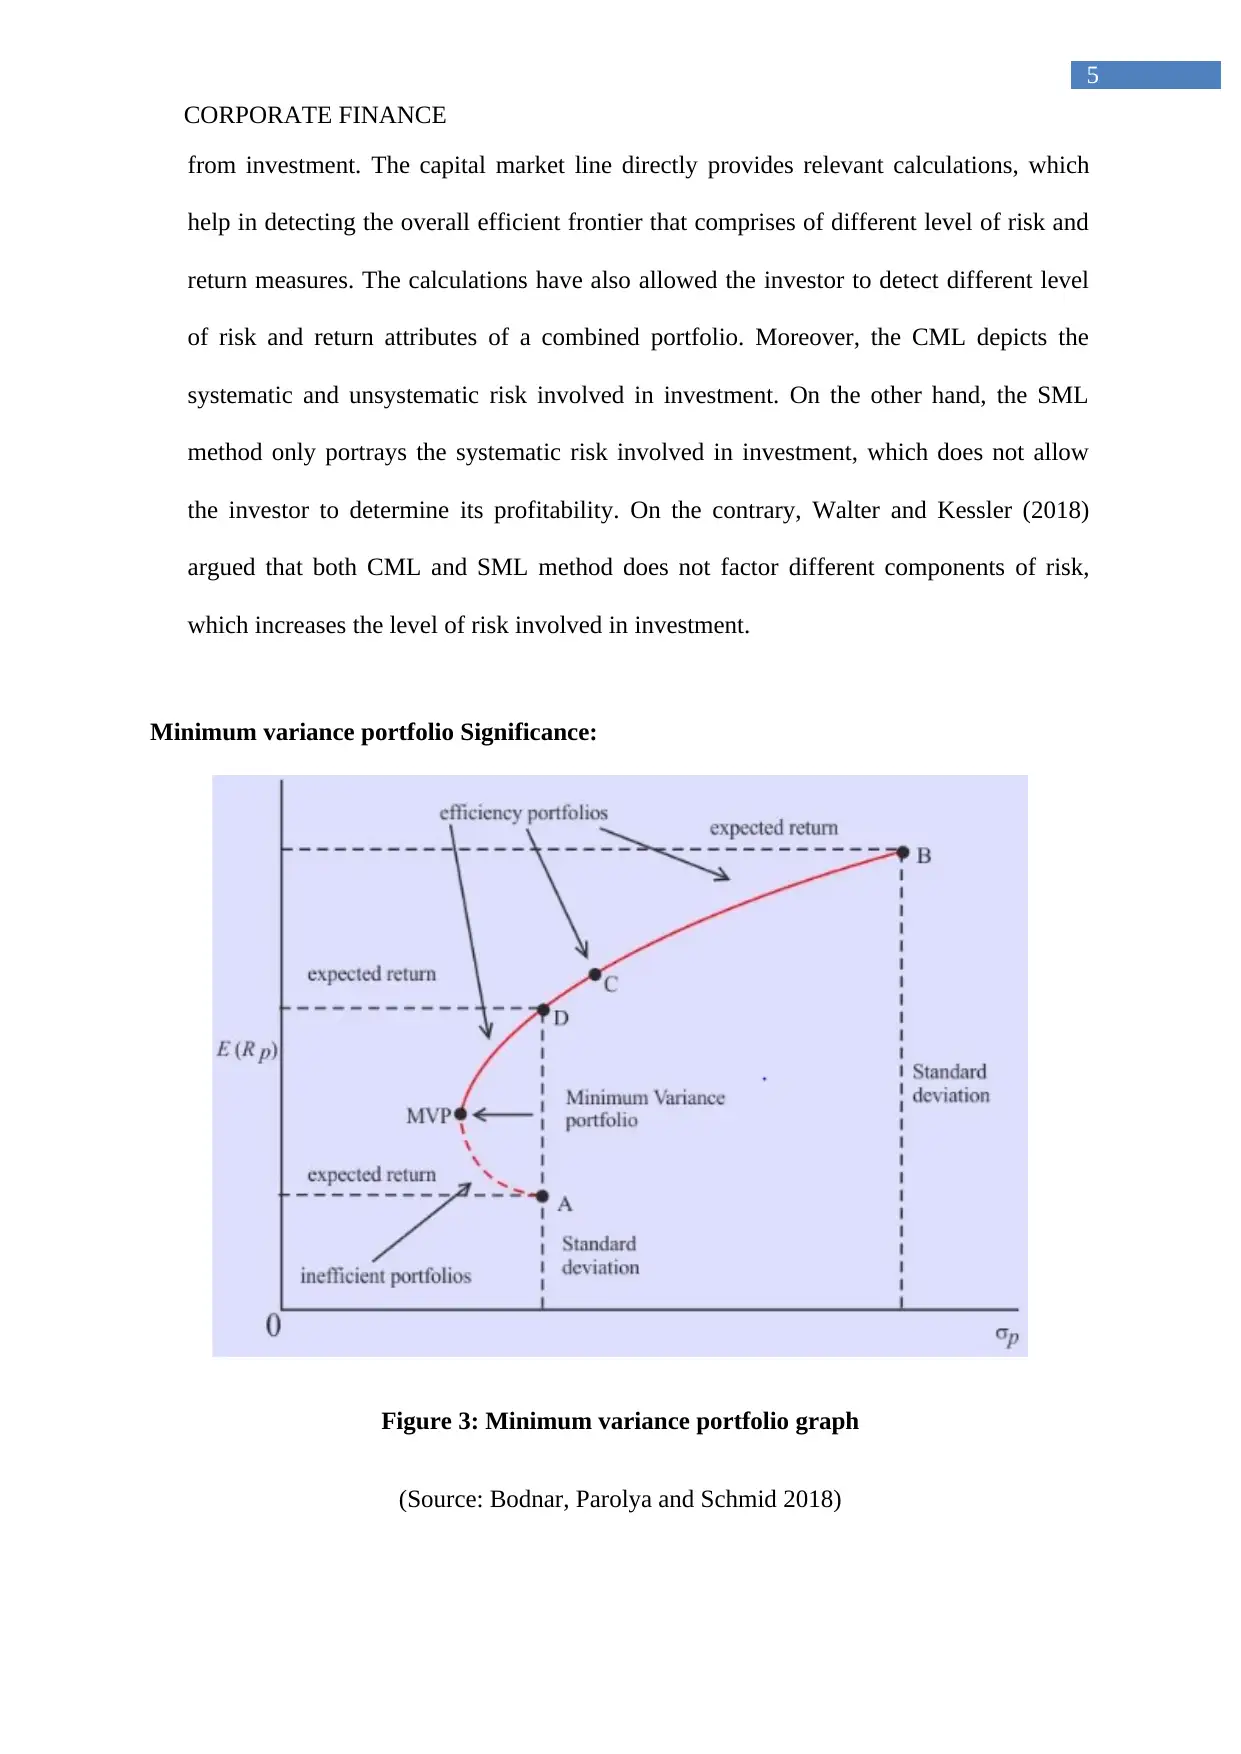
Figure 4: Capital Asset Pricing Model
(Source: Bellalah and Zhang 2018)
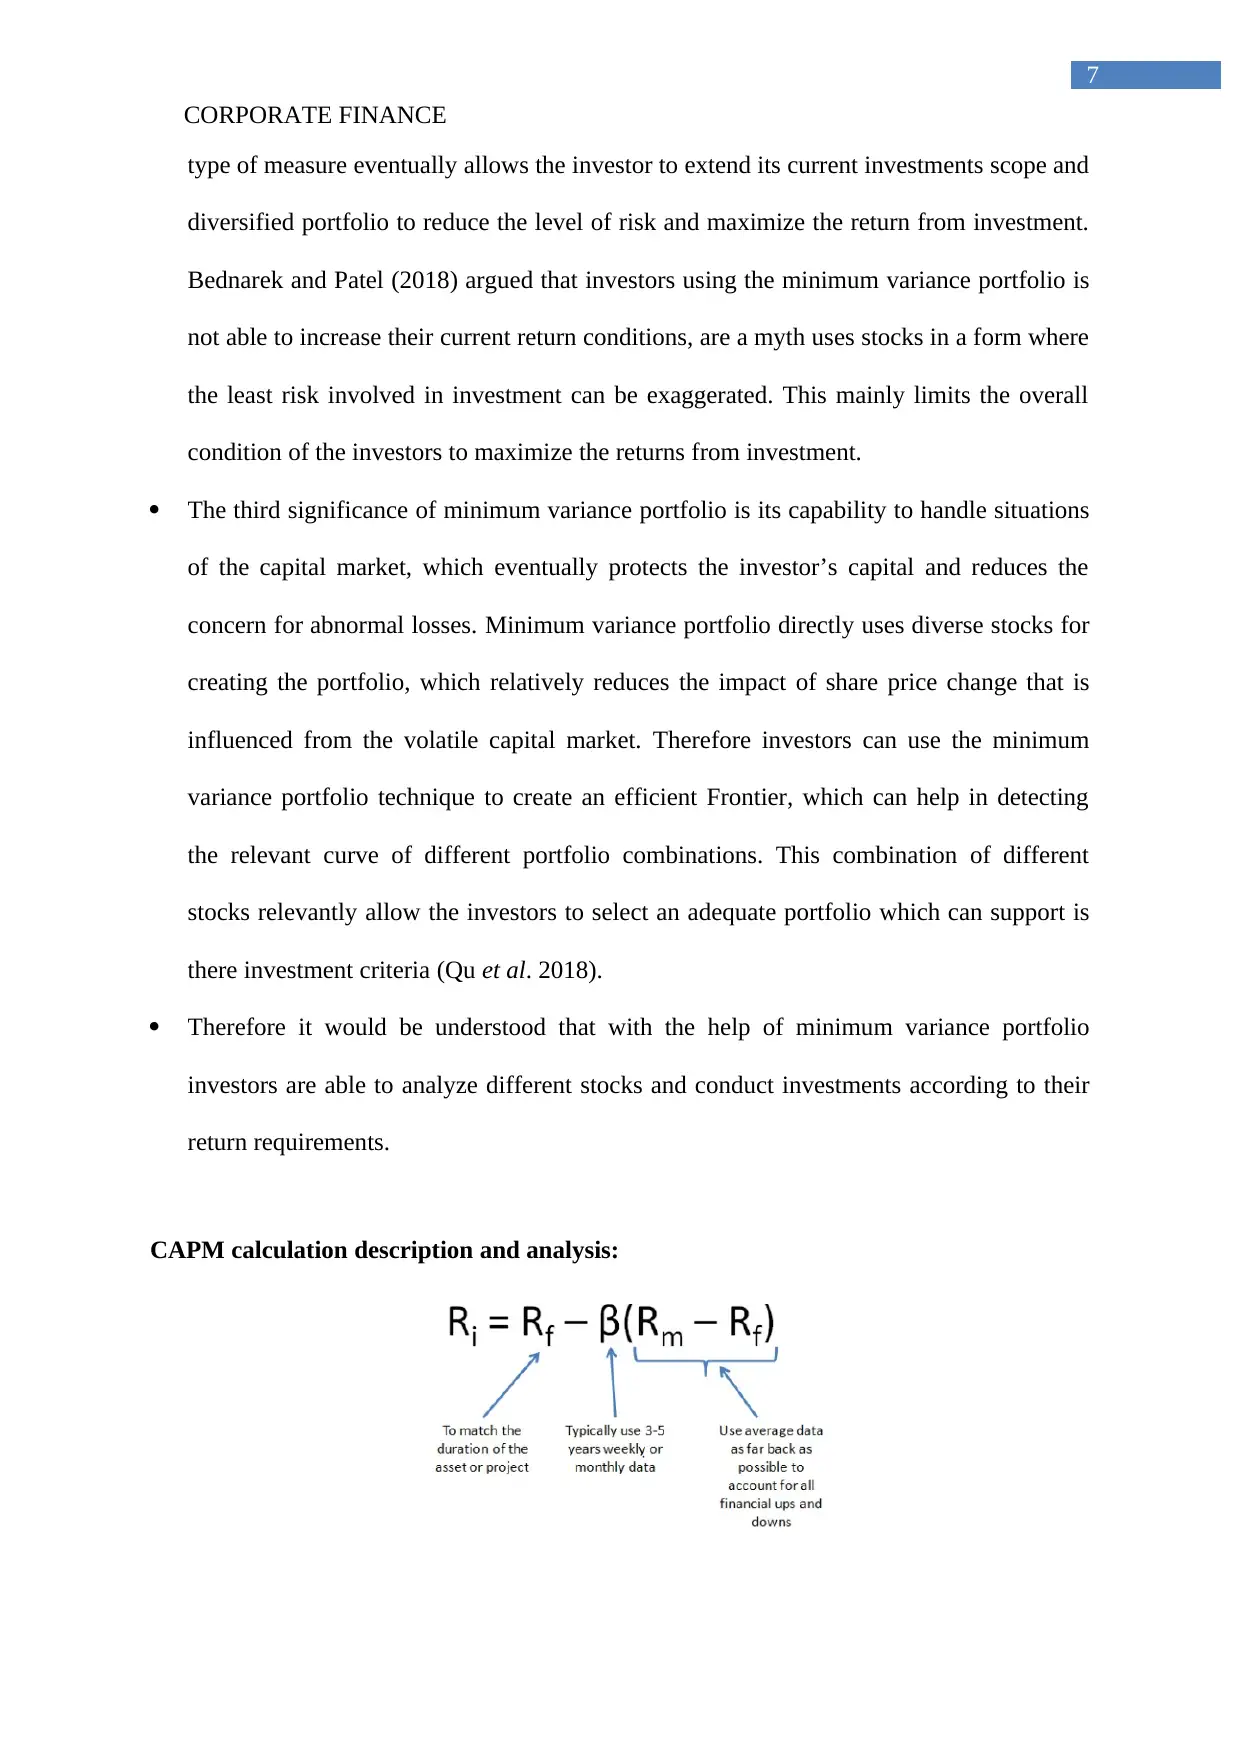
The figure relatively indicates the formula for Capital Asset pricing model, which
eventually allows investor to identify the level of expected returns of a particular stock. The
formula directly indicates that we need to have a relevant risk free rate, beta, and market
premium to analyses the level of return that needs to be presented by the particular stock. The
calculation also indicates that Capital Asset pricing model eventually allows investor to
understand the capability of the stock and its investment opportunity. The detection of Beta is
relatively conducted from a reliable internet sources, which is extensively used for
identifying the level of risk attributes of an investment. The calculation is fairly simple and
can be used by maximum the investors with a little assumptions and requirement (Jarrow
2018).
There have been many instances where the different level of methods has been
proposed, as an alternative to the Capital Asset pricing model. However, the proposed
method is not extensively utilized by all the investors, due to its complexity and high-end
calculations needed for deriving the results. The alternative methods that has been proposed
for Capital Asset pricing model are market price based models, arbitrage pricing model,
accounting information based models, and market price base model. The above mentioned
methods are relatively helpful for the investors to identify the exact expected return of a
particular stock or investment. However, the measures directly require additional calculations
and extensive use of statistical methods to derive the relevant expected return of the
investment scope. This relatively reduces the level of usage that can be conducted among
different in western. The above-mentioned models can only be used by large hedge fund
managers and big investors, while the normal investors cannot use the method due to its
complexity. This can be considered as one of the major components, which has allowed the
8
Figure 4: Capital Asset Pricing Model
(Source: Bellalah and Zhang 2018)
The figure relatively indicates the formula for Capital Asset pricing model, which
eventually allows investor to identify the level of expected returns of a particular stock. The
formula directly indicates that we need to have a relevant risk free rate, beta, and market
premium to analyses the level of return that needs to be presented by the particular stock. The
calculation also indicates that Capital Asset pricing model eventually allows investor to
understand the capability of the stock and its investment opportunity. The detection of Beta is
relatively conducted from a reliable internet sources, which is extensively used for
identifying the level of risk attributes of an investment. The calculation is fairly simple and
can be used by maximum the investors with a little assumptions and requirement (Jarrow
2018).
There have been many instances where the different level of methods has been
proposed, as an alternative to the Capital Asset pricing model. However, the proposed
method is not extensively utilized by all the investors, due to its complexity and high-end
calculations needed for deriving the results. The alternative methods that has been proposed
for Capital Asset pricing model are market price based models, arbitrage pricing model,
accounting information based models, and market price base model. The above mentioned
methods are relatively helpful for the investors to identify the exact expected return of a
particular stock or investment. However, the measures directly require additional calculations
and extensive use of statistical methods to derive the relevant expected return of the
investment scope. This relatively reduces the level of usage that can be conducted among
different in western. The above-mentioned models can only be used by large hedge fund
managers and big investors, while the normal investors cannot use the method due to its
complexity. This can be considered as one of the major components, which has allowed the
⊘ This is a preview!⊘
Do you want full access?
Subscribe today to unlock all pages.
Trusted by 1+ million students worldwide
CORPORATE FINANCE
9
Capital Asset pricing model to survive amidst different methods or models (Barillas and
Shanken 2018).
The Capital Asset pricing model has both significance and limitations which a
relatively influence the use of the model by different investors. The major significance of the
Capital Asset pricing model is the reduced complexity which provides to the investors in
deriving the expected returns. In addition, it also supports the weighted average cost of
capital formula, which is used by investors to identify the Minimum requirements that need
to be obtained by the organization to survive in the competitive market. However there are
certain limitation of the Capital Asset pricing model, which directly relates to the
assumptions that is need for calculating the expected returns of the stock. The method is
based on one Factor Model, which does not comprehend the different level of risk and return
attributes that can be provided from a particular investment (Siddiqi 2018). This relatively
reduces the reliability of the output that is generated by Capital Asset pricing model.
Furthermore, the assumptions such as risk premium and market return is relatively assumed
by the investors for analyzing the level of returns that could be generated from a stock.
Conclusion:
The analysis conducted in the above assessment directly sheds light on the
requirements of investors for identifying the level of portfolio that could minimize the risk
and maximize returns from investment. The evaluation conducted on capital market line and
security market line allows the investor to identify different risk and return capability of a
particular investment opportunity. The further evaluations are relatively depicted on
minimum variance portfolio and Capital Asset pricing model, which can help in
understanding return generation capability of different investment scope. The assessment
Paraphrase This Document
Need a fresh take? Get an instant paraphrase of this document with our AI Paraphraser
CORPORATE FINANCE
10
further evaluates different level of the relevant significance of minimum variance portfolio
investors to maximize the return and minimize the risk involved in investment.
References:
Barillas, F. and Shanken, J., 2018. Comparing asset pricing models. The Journal of
Finance, 73(2), pp.715-754.
Bednarek, Z. and Patel, P., 2018. Understanding the outperformance of the minimum
variance portfolio. Finance Research Letters, 24, pp.175-178.
Bellalah, M. and Zhang, D., 2018. An intertemporal capital asset pricing model under
incomplete information and short sales. Annals of Operations Research, pp.1-17.
Bodnar, T., Parolya, N. and Schmid, W., 2018. Estimation of the global minimum variance
portfolio in high dimensions. European Journal of Operational Research, 266(1), pp.371-
390.
Bothfeld, S. and Rosenthal, P., 2018. The End of Social Security as we know it–The Erosion
of Status Protection in German Labour Market Policy. Journal of Social Policy, 47(2),
pp.275-294.
Jarrow, R., 2018. An equilibrium capital asset pricing model in markets with price jumps and
price bubbles. Quarterly Journal of Finance, 8(02), p.1850005.
Kensinger, J.W. ed., 2018. Global Tensions in Financial Markets. Emerald Publishing
Limited.
CORPORATE FINANCE
11
Kim, H.S. and Shin, D.W., 2018. Forecast of realized covariance matrix based on asymptotic
distribution of the LU decomposition with an application for balancing minimum variance
portfolio. Applied Economics Letters, pp.1-8.
King, M., 2018. Due diligence in capital markets. Journal of Capital Markets Studies, 2(1),
pp.6-8.
Korinek, A., 2018. Regulating capital flows to emerging markets: An externality
view. Journal of International Economics, 111, pp.61-80.
Milosevic, M., 2018. Skills or networks? Success and fundraising determinants in a low
performing venture capital market. Research Policy, 47(1), pp.49-60.
Qu, H., Wang, T., Zhang, Y. and Sun, P., 2018. Dynamic hedging using the realized
minimum-variance hedge ratio approach–Examination of the CSI 300 index futures. Pacific-
Basin Finance Journal.
Siddiqi, H., 2018. Anchoring-Adjusted Capital Asset Pricing Model. Journal of Behavioral
Finance, 19(3), pp.249-270.
Sweeney, R.J., 2018. The Information Costs of Capital Controls. In Capital Controls in
Emerging Economies (pp. 45-61). Routledge.
Tejada-Arango, D.A., Sánchez-Martın, P. and Ramos, A., 2018. Security constrained unit
commitment using line outage distribution factors. IEEE Transactions on Power
Systems, 33(1), pp.329-337.
Walter, T. and Kessler, O., 2018. The Public and Its Problems: How the EU's Capital Market
Union Defines the Bounds of Legitimate Knowledge and Redraws the Boundaries of (Public)
Authority. Indiana Journal of Global Legal Studies, 25(1), pp.157-185.
⊘ This is a preview!⊘
Do you want full access?
Subscribe today to unlock all pages.
Trusted by 1+ million students worldwide
1 out of 12
Related Documents


Your All-in-One AI-Powered Toolkit for Academic Success.
+13062052269
info@desklib.com
Available 24*7 on WhatsApp / Email
![[object Object]](/_next/static/media/star-bottom.7253800d.svg)
Unlock your academic potential
Copyright © 2020–2026 A2Z Services. All Rights Reserved. Developed and managed by ZUCOL.