Corporate Financial Management Report: FIN200, Trimester 2 Assignment
VerifiedAdded on 2023/06/07
|16
|2981
|331
Report
AI Summary
This report provides a comprehensive analysis of key concepts in corporate financial management, including the Security Market Line (SML) and Capital Market Line (CML), highlighting their differences through graphical representations. It explores the significance of minimum variance portfolios in minimizing portfolio volatility and optimizing risk-return ratios. The report further delves into the relevance of the Capital Asset Pricing Model (CAPM) over other models when computing the required rate of return, emphasizing its advantages in considering systematic risk and facilitating sound investment decisions. The report covers the differences between SML and CML, the importance of minimum variance portfolios, and the relevance of CAPM. The analysis provides insights into investment strategies and portfolio optimization.
Running head: CORPORATE FINANCIAL MANAGEMENT
Corporate Financial Management
Name of the Student:
Name of the University:
Author’s Note:
Course ID:
Corporate Financial Management
Name of the Student:
Name of the University:
Author’s Note:
Course ID:
Paraphrase This Document
Need a fresh take? Get an instant paraphrase of this document with our AI Paraphraser

1CORPORATE FINANCIAL MANAGEMENT
Table of Contents
1. Introduction:................................................................................................................................2
2. Explanation of the differences between Security Market Line (SML) and Capital Market Line
(CML) by graphical representation:................................................................................................2
3. Significance of minimum variance portfolios:............................................................................7
4. Relevance of CAPM over other equations at the time of computing required rate of return:.....9
5. Conclusion:................................................................................................................................13
References:....................................................................................................................................14
2CORPORATE FINANCIAL MANAGEMENT
1. Introduction:
The paper would focus on the various corporate finance aspects that take into
consideration capital market line (CML), security market line (SML), minimum variance
portfolios and capital asset pricing model (CAPM). The investors use these models for creating a
portfolio containing various stocks depending on which they would undertake their investment
decisions (Aliu, Pavelkova and Dehning, 2017). Firstly, the paper would concentrate on
analysing the key points of distinction between CML and SML through graphs. The next
segment would lay stress on explaining the use of minimum variance portfolios so that the
investors could evaluate the risk and return associated with investment decisions. Lastly, the
assignment would focus on describing the CAPM relevance over other models for computing
required rate of return on a particular investment.
2. Explanation of the differences between Security Market Line (SML) and Capital Market
Line (CML) by graphical representation:
In order to highlight the differences between SML and CML, graphical illustrations are
taken into consideration.
⊘ This is a preview!⊘
Do you want full access?
Subscribe today to unlock all pages.
Trusted by 1+ million students worldwide

3CORPORATE FINANCIAL MANAGEMENT
Figure 1: Efficient frontier
(Source: Chandra, 2017)
From the above figure, it is evident that the investor has the option of investing either in
points B and C or in points A and B. Moreover, with the help of this figure, it is possible to
identify the investor preference so that the individual could invest in securities between B and C.
Even though the risk level of the two options is identical, the return on stock C would be greater
than the return on stock A would be higher than the return on stock C. Therefore, the investor
would prefer investing on C rather than A.
Paraphrase This Document
Need a fresh take? Get an instant paraphrase of this document with our AI Paraphraser
4CORPORATE FINANCIAL MANAGEMENT
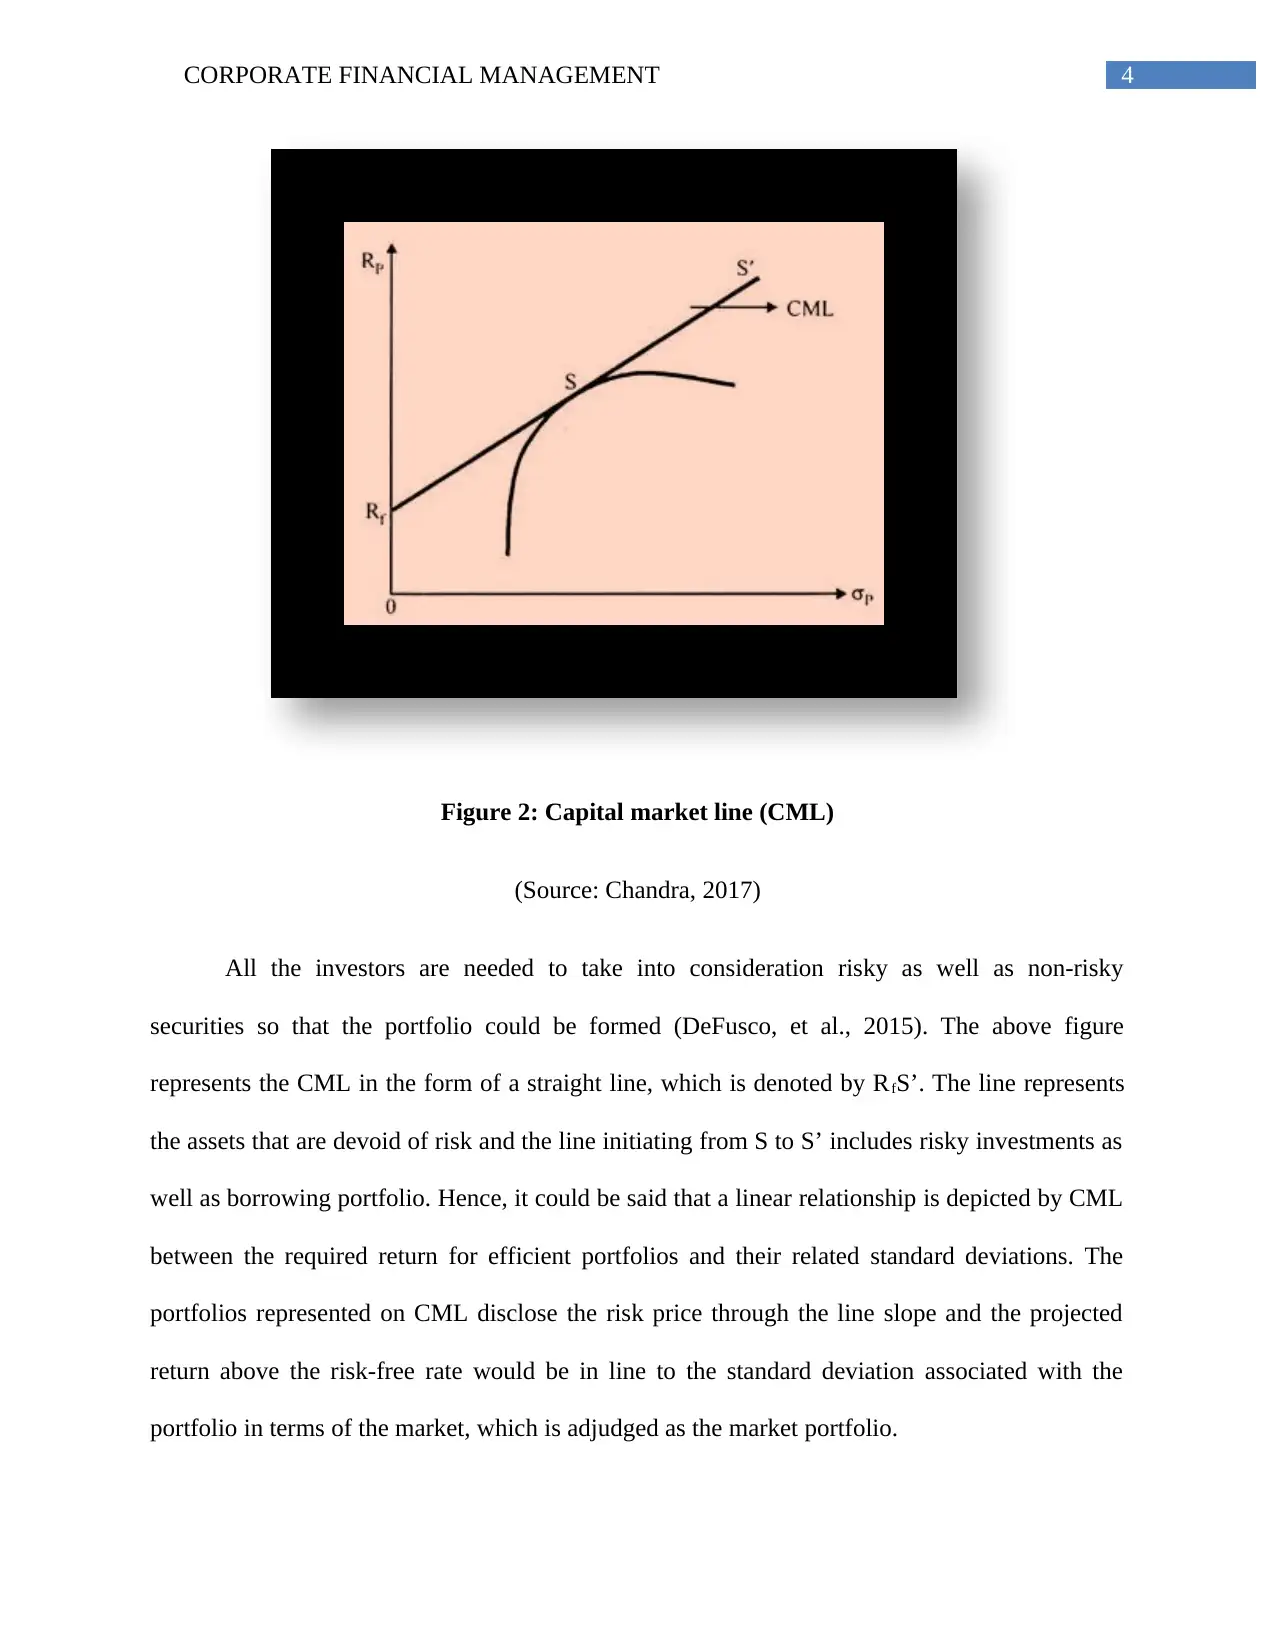
Figure 2: Capital market line (CML)
(Source: Chandra, 2017)
All the investors are needed to take into consideration risky as well as non-risky
securities so that the portfolio could be formed (DeFusco, et al., 2015). The above figure
represents the CML in the form of a straight line, which is denoted by RfS’. The line represents
the assets that are devoid of risk and the line initiating from S to S’ includes risky investments as
well as borrowing portfolio. Hence, it could be said that a linear relationship is depicted by CML
between the required return for efficient portfolios and their related standard deviations. The
portfolios represented on CML disclose the risk price through the line slope and the projected
return above the risk-free rate would be in line to the standard deviation associated with the
portfolio in terms of the market, which is adjudged as the market portfolio.
5CORPORATE FINANCIAL MANAGEMENT
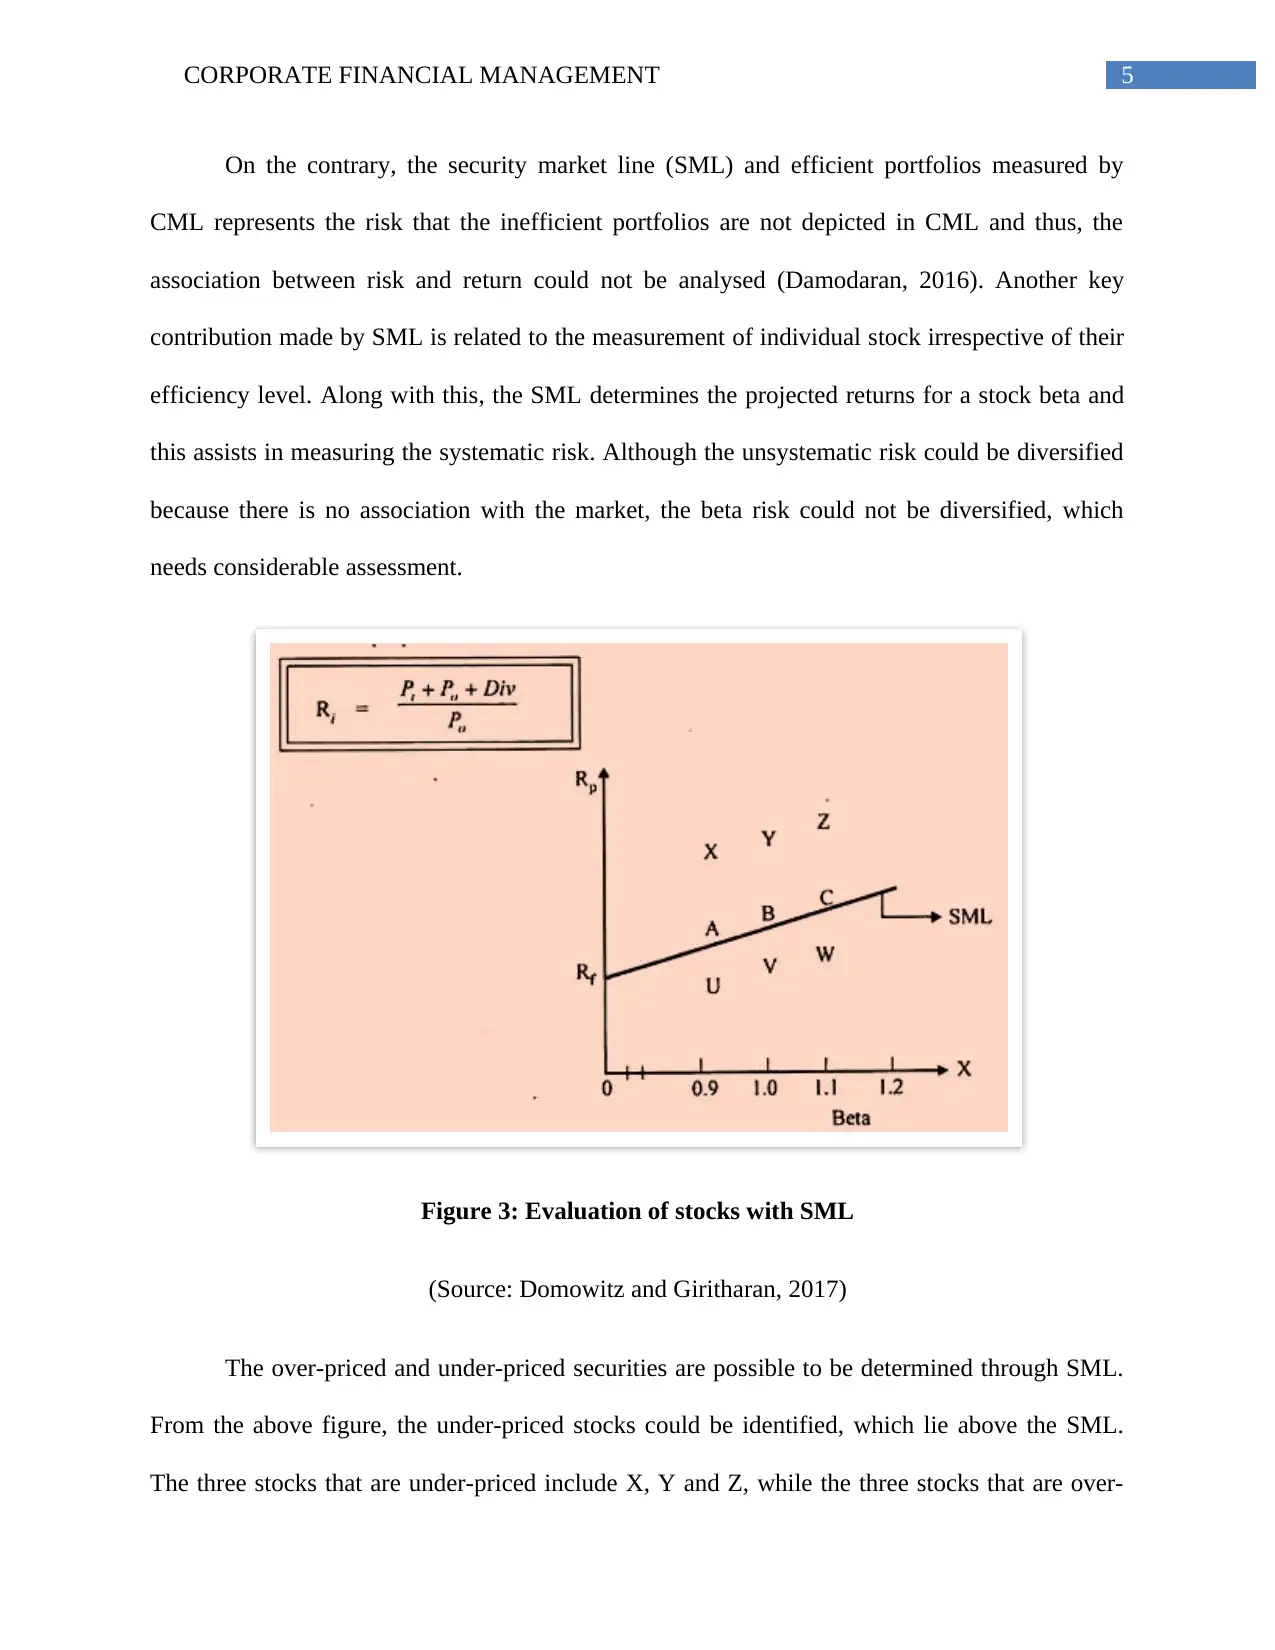
On the contrary, the security market line (SML) and efficient portfolios measured by
CML represents the risk that the inefficient portfolios are not depicted in CML and thus, the
association between risk and return could not be analysed (Damodaran, 2016). Another key
contribution made by SML is related to the measurement of individual stock irrespective of their
efficiency level. Along with this, the SML determines the projected returns for a stock beta and
this assists in measuring the systematic risk. Although the unsystematic risk could be diversified
because there is no association with the market, the beta risk could not be diversified, which
needs considerable assessment.
Figure 3: Evaluation of stocks with SML
(Source: Domowitz and Giritharan, 2017)
The over-priced and under-priced securities are possible to be determined through SML.
From the above figure, the under-priced stocks could be identified, which lie above the SML.
The three stocks that are under-priced include X, Y and Z, while the three stocks that are over-
⊘ This is a preview!⊘
Do you want full access?
Subscribe today to unlock all pages.
Trusted by 1+ million students worldwide
6CORPORATE FINANCIAL MANAGEMENT
priced include U, V and W, as they are below the SML. However, dissimilarity could be
observed between the two classes of stocks despite the fact that they carry same risk level. This
is because the under-priced stocks provide greater returns compared to over-priced stocks. In
order to prove that the stocks X, Y and Z are under-priced, the formula seen in the above figure
could be applied. As per the formula, the current price is P1, the purchase price is P0 and dividend
is represented by Div. There are three stocks A, B and C lying on the SML and hence, their stock
price is accurate and they contain same levels of risk and return.
Figure 4: SML in imperfect market
(Source: Gandhi, 2015)
If perfect information is not available, there would be direct impact on stocks. The reason
is that full information is available in a perfect market and the stock lie exactly on the SML.
However, the SML takes the form of a band in an imperfect market, instead of a single line,
which is represented in the above figure.
By taking into consideration all the above-mentioned aspects, the key differences
between SML and CML are summarised as follows:
Paraphrase This Document
Need a fresh take? Get an instant paraphrase of this document with our AI Paraphraser
7CORPORATE FINANCIAL MANAGEMENT
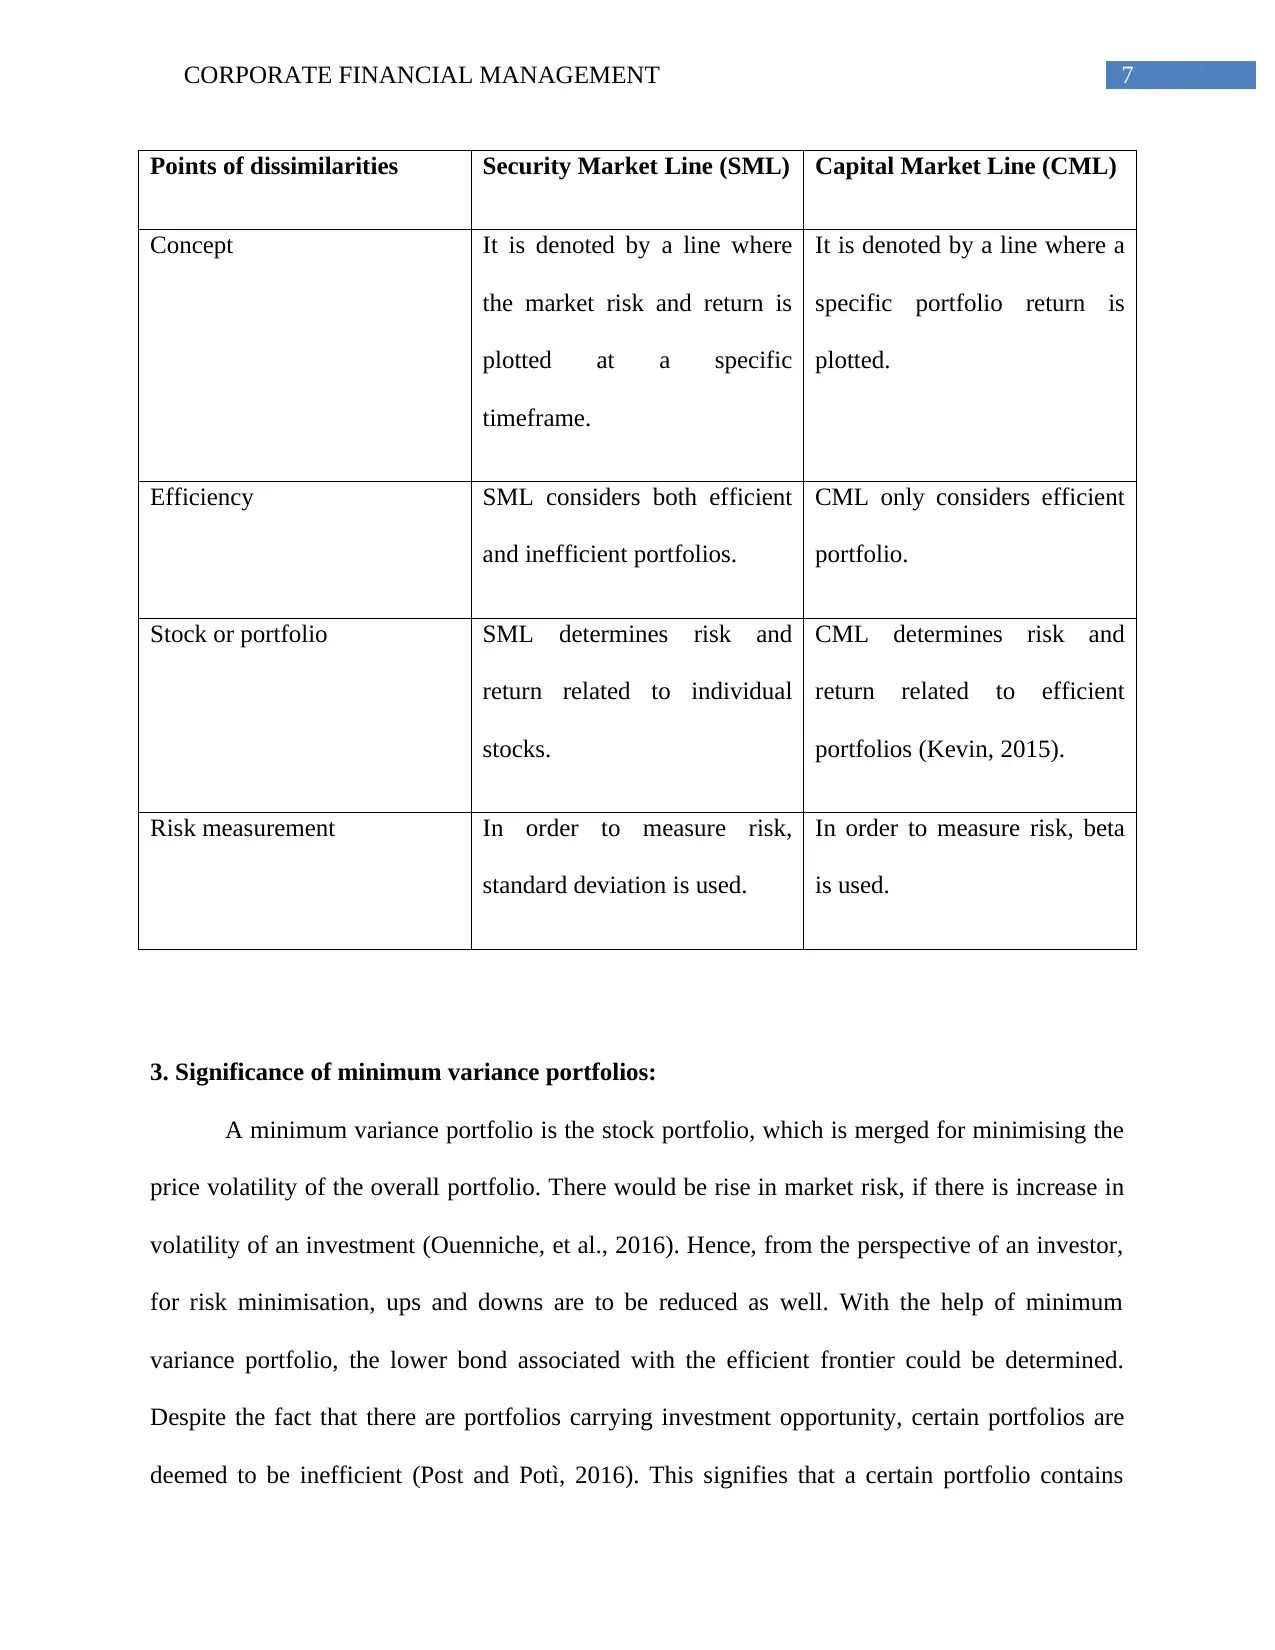
Points of dissimilarities Security Market Line (SML) Capital Market Line (CML)
Concept It is denoted by a line where
the market risk and return is
plotted at a specific
timeframe.
It is denoted by a line where a
specific portfolio return is
plotted.
Efficiency SML considers both efficient
and inefficient portfolios.
CML only considers efficient
portfolio.
Stock or portfolio SML determines risk and
return related to individual
stocks.
CML determines risk and
return related to efficient
portfolios (Kevin, 2015).
Risk measurement In order to measure risk,
standard deviation is used.
In order to measure risk, beta
is used.
3. Significance of minimum variance portfolios:
A minimum variance portfolio is the stock portfolio, which is merged for minimising the
price volatility of the overall portfolio. There would be rise in market risk, if there is increase in
volatility of an investment (Ouenniche, et al., 2016). Hence, from the perspective of an investor,
for risk minimisation, ups and downs are to be reduced as well. With the help of minimum
variance portfolio, the lower bond associated with the efficient frontier could be determined.
Despite the fact that there are portfolios carrying investment opportunity, certain portfolios are
deemed to be inefficient (Post and Potì, 2016). This signifies that a certain portfolio contains
8CORPORATE FINANCIAL MANAGEMENT
equal risk; however, the returns of some stocks are higher than the others. Therefore, there would
not be any investor willing to invest in portfolio lying beneath the minimum variance portfolio.
With the help of systematic portfolio optimisation, diversification and efficiency could be
improved. The minimum variance portfolio is extremely important for the investors due to the
following reasons:
Low risk:
As efficient frontier is close to the minimum variance portfolio, there could be better
comparison of risk-return ratio (Sharpe ratio) with the index. Thus, with the help of optimised
diversification, there would be minimisation in portfolio volatility and losses at the time of
correcting the market (Render, et al., 2017).
Higher return and volatility premium:
In the words of Satyanarayana, Sidhu and Chary (2017), the securities with lower price
fluctuations achieve average returns and they are higher than the projected returns. For the last
40 years, the low volatility premium has been documented. The minimum variance portfolio
helps in effective implementation of the same due to the consideration of associations between
individual investments.
Projections of minimum variance portfolio:
As the minimum variance portfolio is the only portfolio on the efficient frontier
dependent on risk parameters, it is possible to model the same. Hence, it becomes possible to
make projections over time through econometric methods. Moreover, there is no need for the
return projections.
⊘ This is a preview!⊘
Do you want full access?
Subscribe today to unlock all pages.
Trusted by 1+ million students worldwide
9CORPORATE FINANCIAL MANAGEMENT
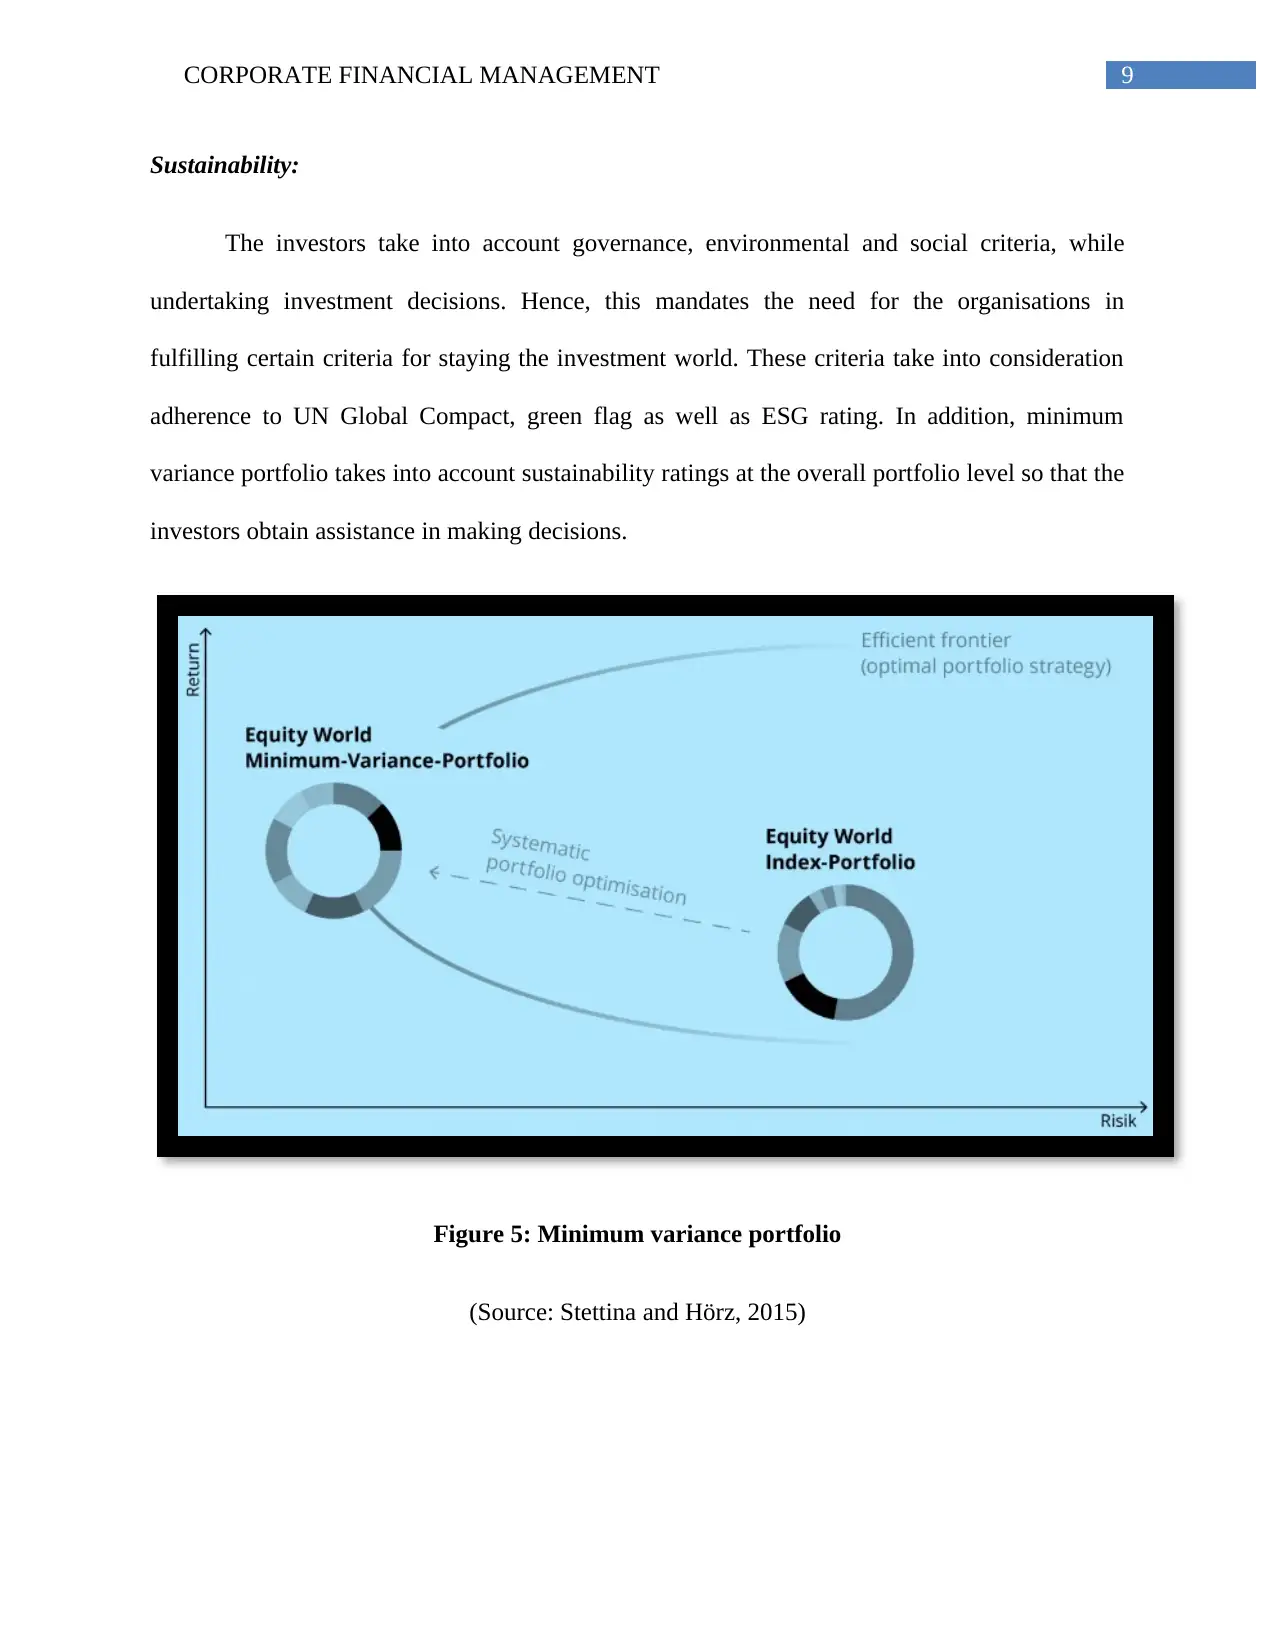
Sustainability:
The investors take into account governance, environmental and social criteria, while
undertaking investment decisions. Hence, this mandates the need for the organisations in
fulfilling certain criteria for staying the investment world. These criteria take into consideration
adherence to UN Global Compact, green flag as well as ESG rating. In addition, minimum
variance portfolio takes into account sustainability ratings at the overall portfolio level so that the
investors obtain assistance in making decisions.
Figure 5: Minimum variance portfolio
(Source: Stettina and Hörz, 2015)
Paraphrase This Document
Need a fresh take? Get an instant paraphrase of this document with our AI Paraphraser
10CORPORATE FINANCIAL MANAGEMENT
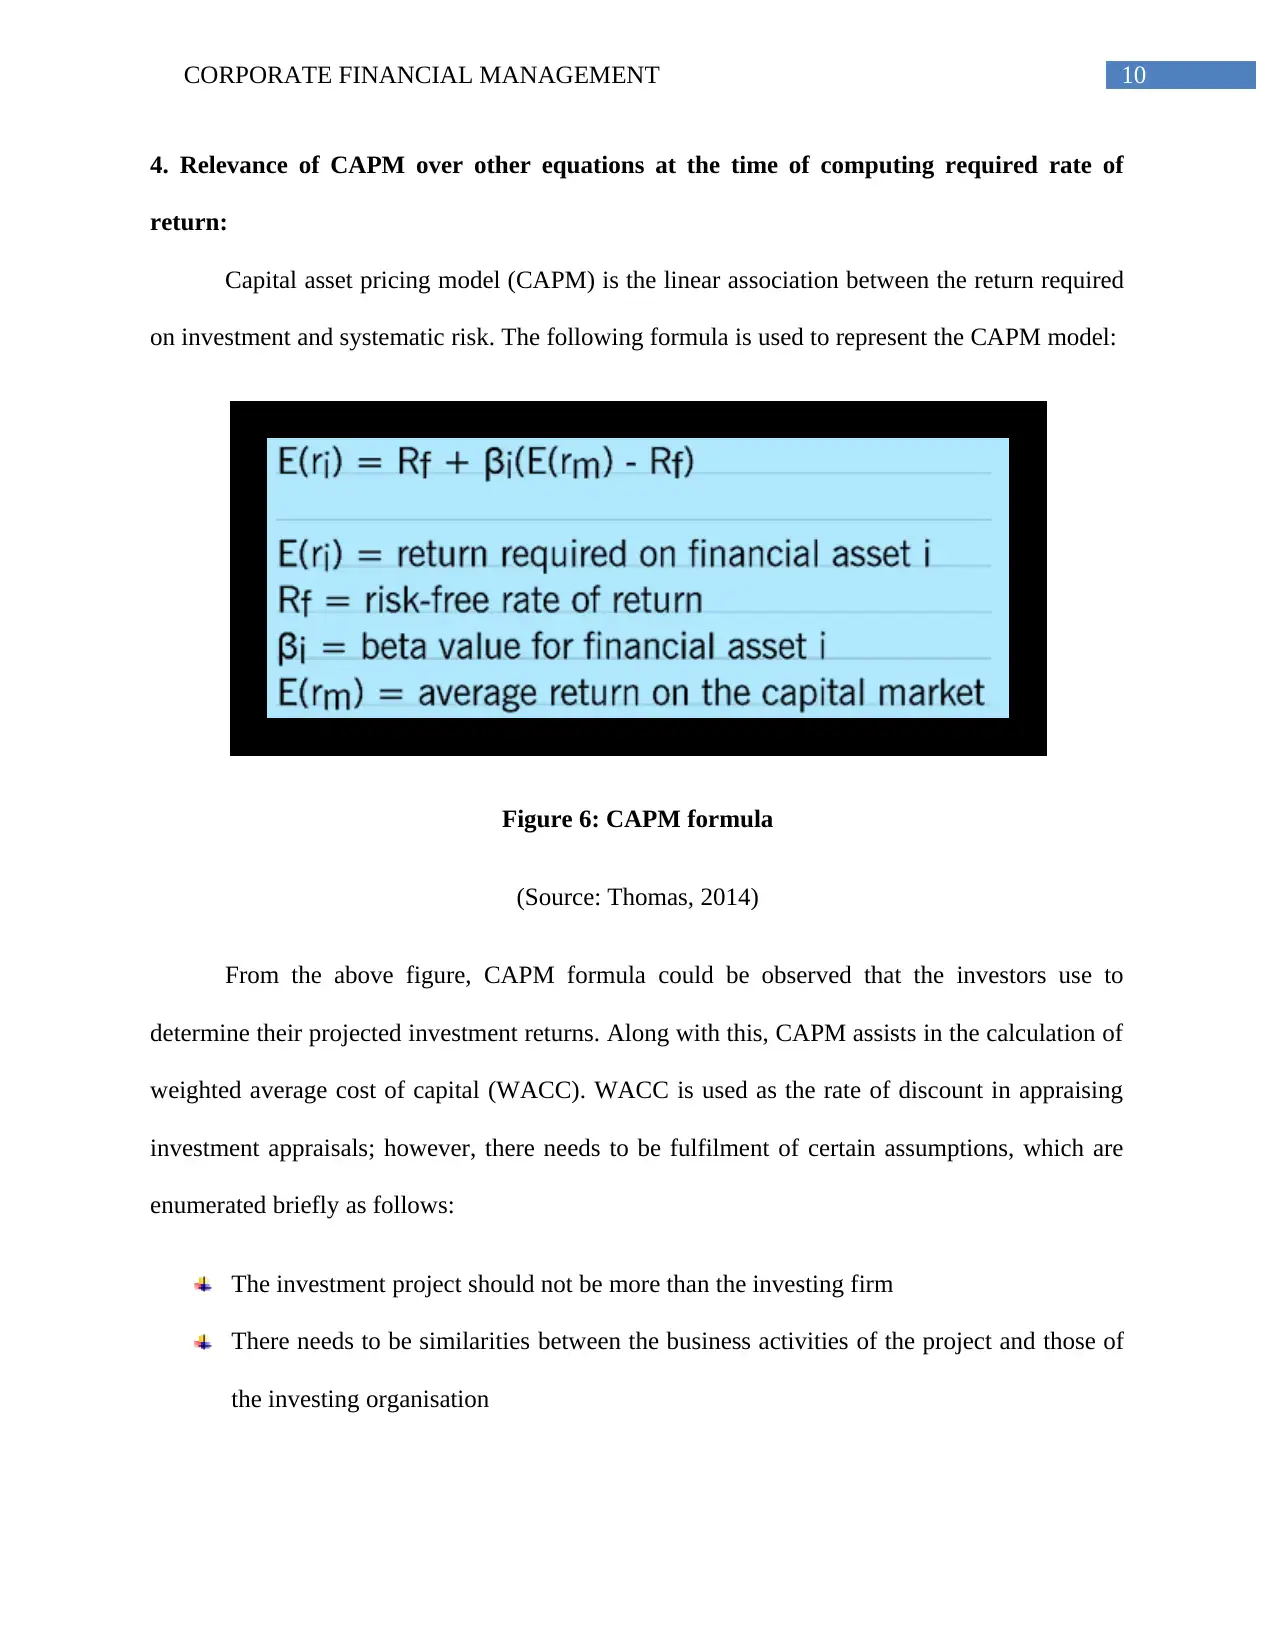
4. Relevance of CAPM over other equations at the time of computing required rate of
return:
Capital asset pricing model (CAPM) is the linear association between the return required
on investment and systematic risk. The following formula is used to represent the CAPM model:
Figure 6: CAPM formula
(Source: Thomas, 2014)
From the above figure, CAPM formula could be observed that the investors use to
determine their projected investment returns. Along with this, CAPM assists in the calculation of
weighted average cost of capital (WACC). WACC is used as the rate of discount in appraising
investment appraisals; however, there needs to be fulfilment of certain assumptions, which are
enumerated briefly as follows:
The investment project should not be more than the investing firm
There needs to be similarities between the business activities of the project and those of
the investing organisation
11CORPORATE FINANCIAL MANAGEMENT
There needs to be similarities in the financing mix utilised in the project and the capital
structure of the investing company.
The existing fund providers of the organisation should maintain the same rates of return
after the project has been undertaken.
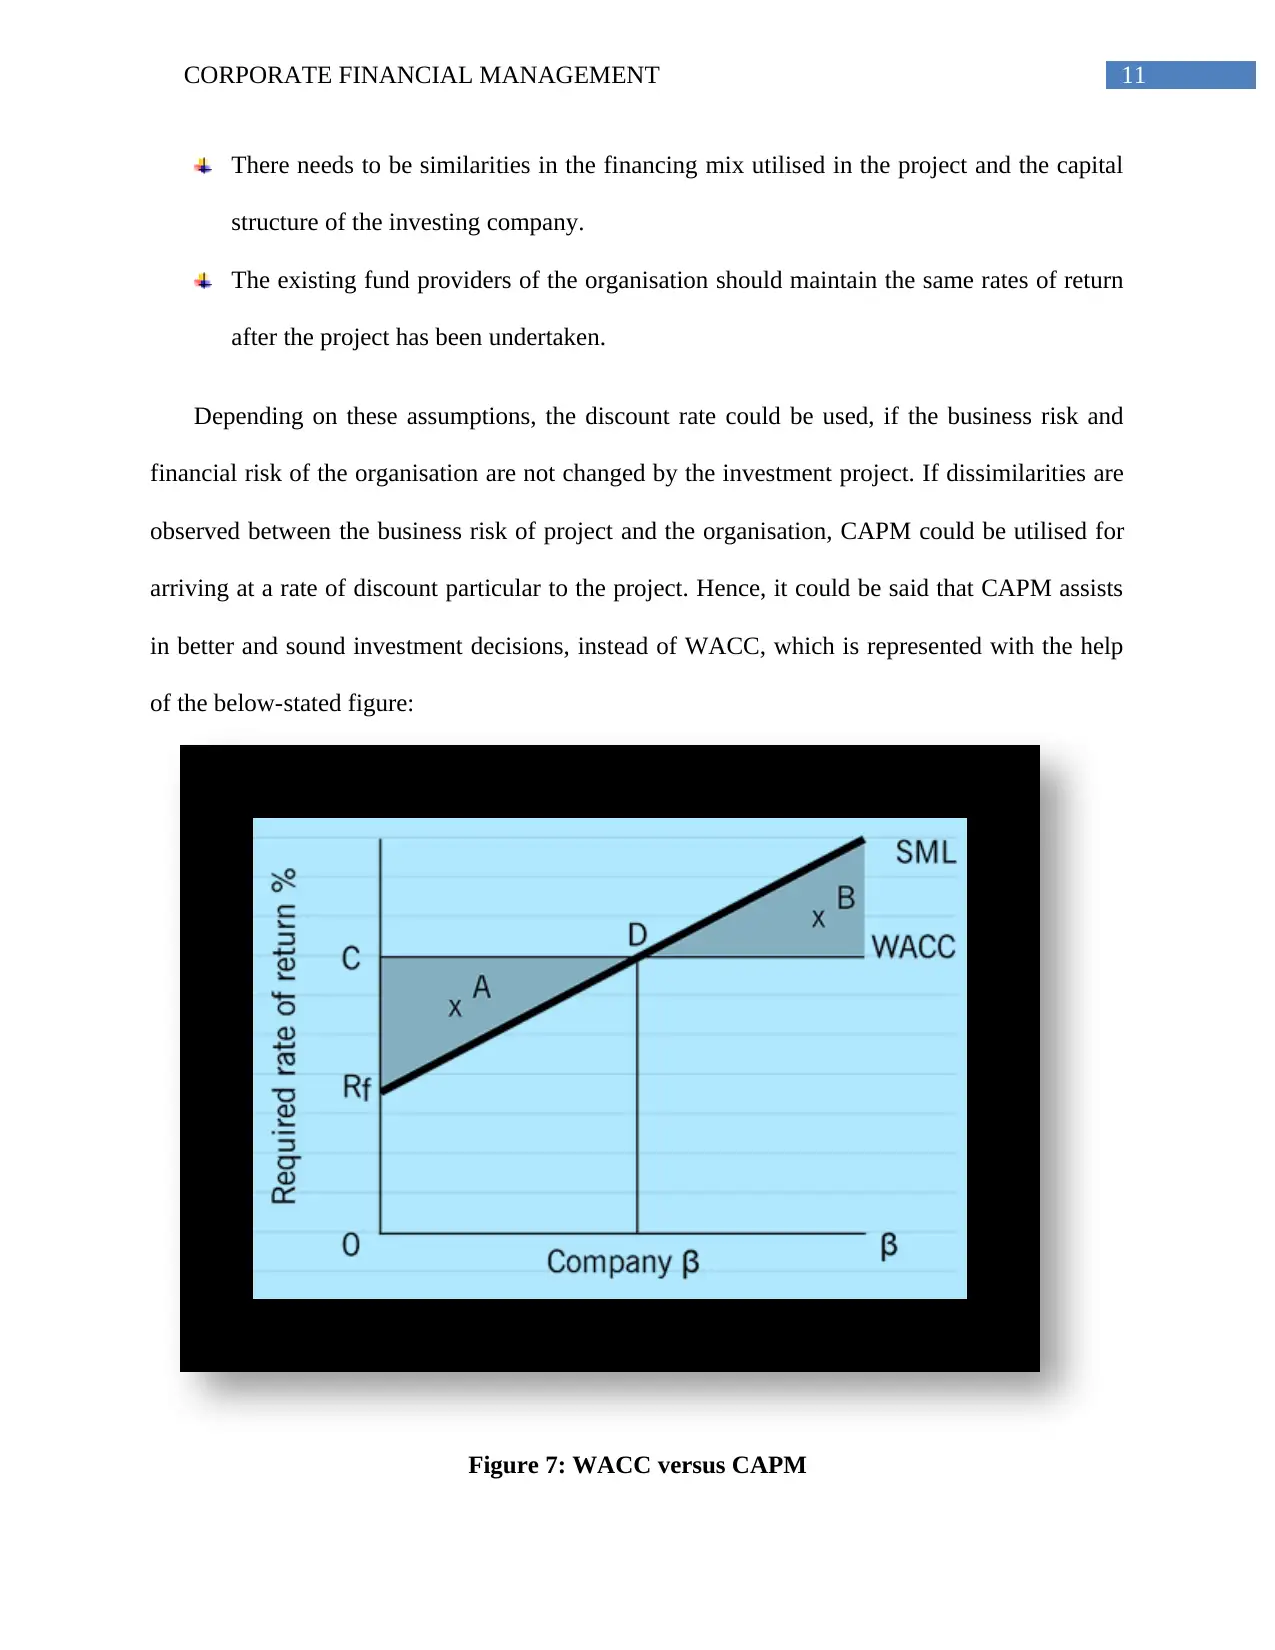
Depending on these assumptions, the discount rate could be used, if the business risk and
financial risk of the organisation are not changed by the investment project. If dissimilarities are
observed between the business risk of project and the organisation, CAPM could be utilised for
arriving at a rate of discount particular to the project. Hence, it could be said that CAPM assists
in better and sound investment decisions, instead of WACC, which is represented with the help
of the below-stated figure:
Figure 7: WACC versus CAPM
There needs to be similarities in the financing mix utilised in the project and the capital
structure of the investing company.
The existing fund providers of the organisation should maintain the same rates of return
after the project has been undertaken.
Depending on these assumptions, the discount rate could be used, if the business risk and
financial risk of the organisation are not changed by the investment project. If dissimilarities are
observed between the business risk of project and the organisation, CAPM could be utilised for
arriving at a rate of discount particular to the project. Hence, it could be said that CAPM assists
in better and sound investment decisions, instead of WACC, which is represented with the help
of the below-stated figure:
Figure 7: WACC versus CAPM
⊘ This is a preview!⊘
Do you want full access?
Subscribe today to unlock all pages.
Trusted by 1+ million students worldwide
1 out of 16
Related Documents


Your All-in-One AI-Powered Toolkit for Academic Success.
+13062052269
info@desklib.com
Available 24*7 on WhatsApp / Email
![[object Object]](/_next/static/media/star-bottom.7253800d.svg)
Unlock your academic potential
Copyright © 2020–2026 A2Z Services. All Rights Reserved. Developed and managed by ZUCOL.