FIN20014 - Financial Management: ALLCURE Inc. Project Report
VerifiedAdded on 2023/06/03
|16
|2933
|429
Report
AI Summary
This report presents a financial feasibility analysis of a drug product under consideration by ALLCURE Inc. It employs capital budgeting techniques, including Net Present Value (NPV) and payback period, to assess the project's viability. The analysis considers both qualitative and quantitative factors, such as management expertise and market conditions. The findings indicate that the production of P-REC is beneficial at an 18% discount rate, yielding a positive NPV and a payback period of 5.51 years. However, if the discount rate increases to 24%, the alternative product T-REC becomes more attractive. The report recommends that the management consider the risks and uncertainties associated with capital budgeting decisions before making a final choice, emphasizing the importance of accurate cash flow forecasting and sensitivity analysis to changes in the discount rate.

Accounting and Financial Analysis Report
1
1
Paraphrase This Document
Need a fresh take? Get an instant paraphrase of this document with our AI Paraphraser
Executive Summary
The report presented here deals with the financial feasibility analysis of a drug product
being considered for development by ALLCURE Inc. The results of the analysis depicts that the
production of P-REC would be beneficial for the company if the discount rate happens to be
18%. The NPV of the product at this rate is $972,011.71 with the payback period of 5.51 years.
However, if the discount rate increases to 24%, then it would be more beneficial for the company
to go for alternative product T-REC in place of P-REC. T-REC would produce an NPV of
$410,070.19 with the payback period of 5.34 years which is better than P-REC. Further, there are
many risks and uncertainties associated with the capital budgeting decisions which should be
taken into account by the management of the company before making the final choice.
2
Contents
Introduction.................................................................................................................................................4
Findings.......................................................................................................................................................4
Qualitative...............................................................................................................................................4
Quantitative.............................................................................................................................................4
Recommendations and Justifications..........................................................................................................6
Detailed Comparison and Recommendations.............................................................................................7
Conclusion...................................................................................................................................................8
References...................................................................................................................................................9
Appendix...................................................................................................................................................10
3
⊘ This is a preview!⊘
Do you want full access?
Subscribe today to unlock all pages.
Trusted by 1+ million students worldwide
Introduction
The role of financial feasibility is crucial in deciding as to whether a project should be
accepted and implemented or not. Financial feasibility means assessing the project from finance
view point. The capital budgeting technique is applied to assess the financial feasibility of a
project which involves computation of net present value, payback period, or IRR (Andor,
Mohanty, and Toth, 2015). In this context, a report has been presented here that provide analysis
of financial feasibility of a project being considered by ALLCURE Inc. ALLCURE Inc is
considering bringing a pre-version of a drug named P-REC.
Findings
Qualitative
It is not only the quantitative analysis which is to be focused by an analyst in analyzing a
project’s financial feasibility. The qualitative analysis also equally plays significant role in such
analysis and decisions. The qualitative analysis covers factors which are not quantifiable such as
management expertise of a firm, industry cycle, research and development, labor relations etc
(Ragin, 2014). In the current case of ALLCURE Inc, the company is considering an option of
establishing production line for P-REC. There are various qualitative factors which require
consideration in this decision. For instance, the management will have to sacrifice the use of
facilities and factory site being made for the current purposes. The company stands at the danger
of losing clients of the existing product or services. On the other hand, the company may also
enjoy added advantages due to implementation of the new project. The new project might help
the company to increase sales of the existing products. P-REC which is a pre-version of a drug
could help the company in enhancing the sale of its existing drugs. So, it would be advantageous
for the company to accept and go along with the project (Ragin, 2014).
Quantitative
The second method which is applied in assessing the financial feasibility of a project is
quantitative analysis. Quantitative analysis involves mathematical base being used in the analysis
(Hopkinson, 2017). There are various capital budgeting techniques which are applied in
conducting the quantitative analysis. In the current case the question in front of the management
of ALLCURE Inc is that whether they should accept the investment in establishing production
4
Paraphrase This Document
Need a fresh take? Get an instant paraphrase of this document with our AI Paraphraser
line for P-REC or not. For this purpose, the net present value technique and payback period
technique have been used.
The net present value technique involves computation of initial cash outflows, operating
cash inflows and outflows, and terminal cash inflows. The cash flows being computed in this
manner are then discounted to their present value by using an appropriate discount rate (Rossi,
2015). Then the present value of the cash outflows is deducted from the present value of cash
inflows to compute net present value. The decision to accept or reject the project lies on the fact
that whether the NPV is positive or negative. If the NPV is positive, the project is accepted and if
it is negative, the project is rejected. Further, the payback period is computed to determine the
time period to be taken in the recovery of the initial investment. The lower the time period higher
are the chances of project being selected (Hopkinson, 2017).
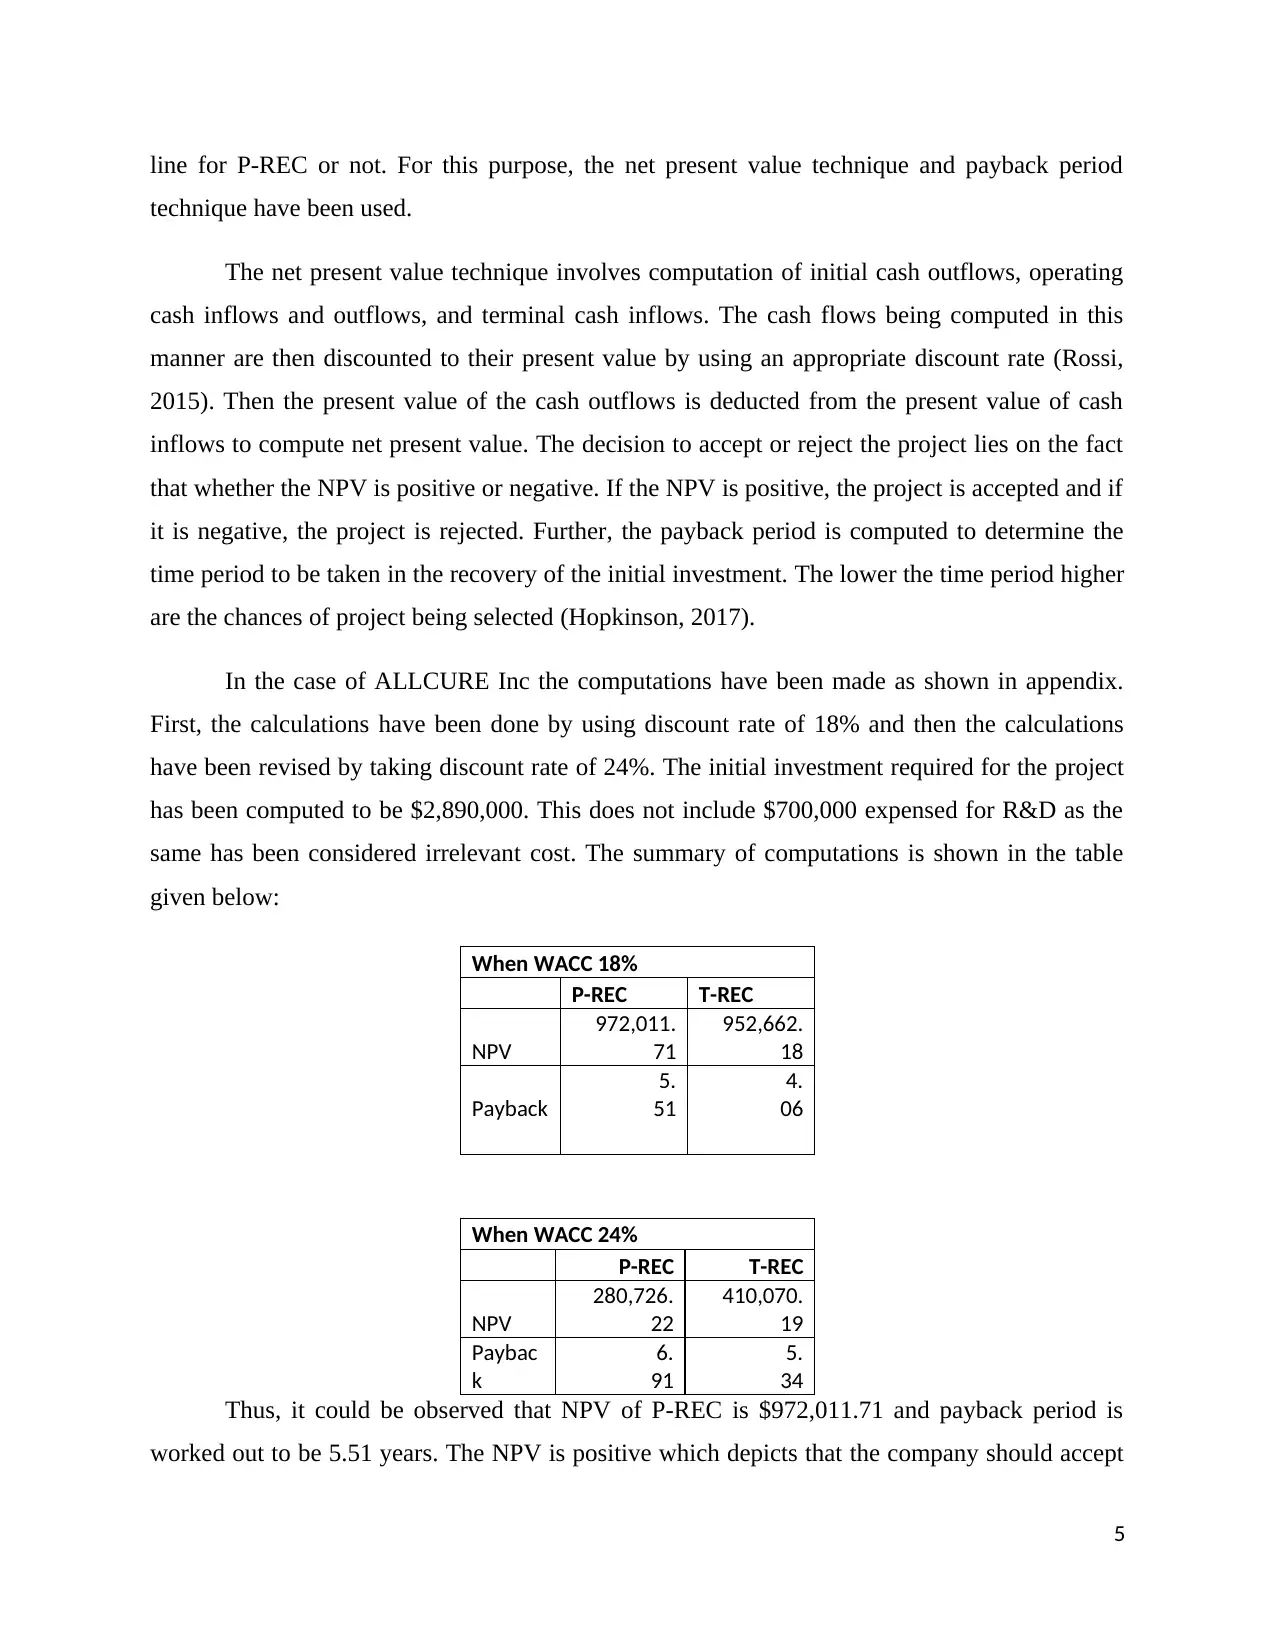
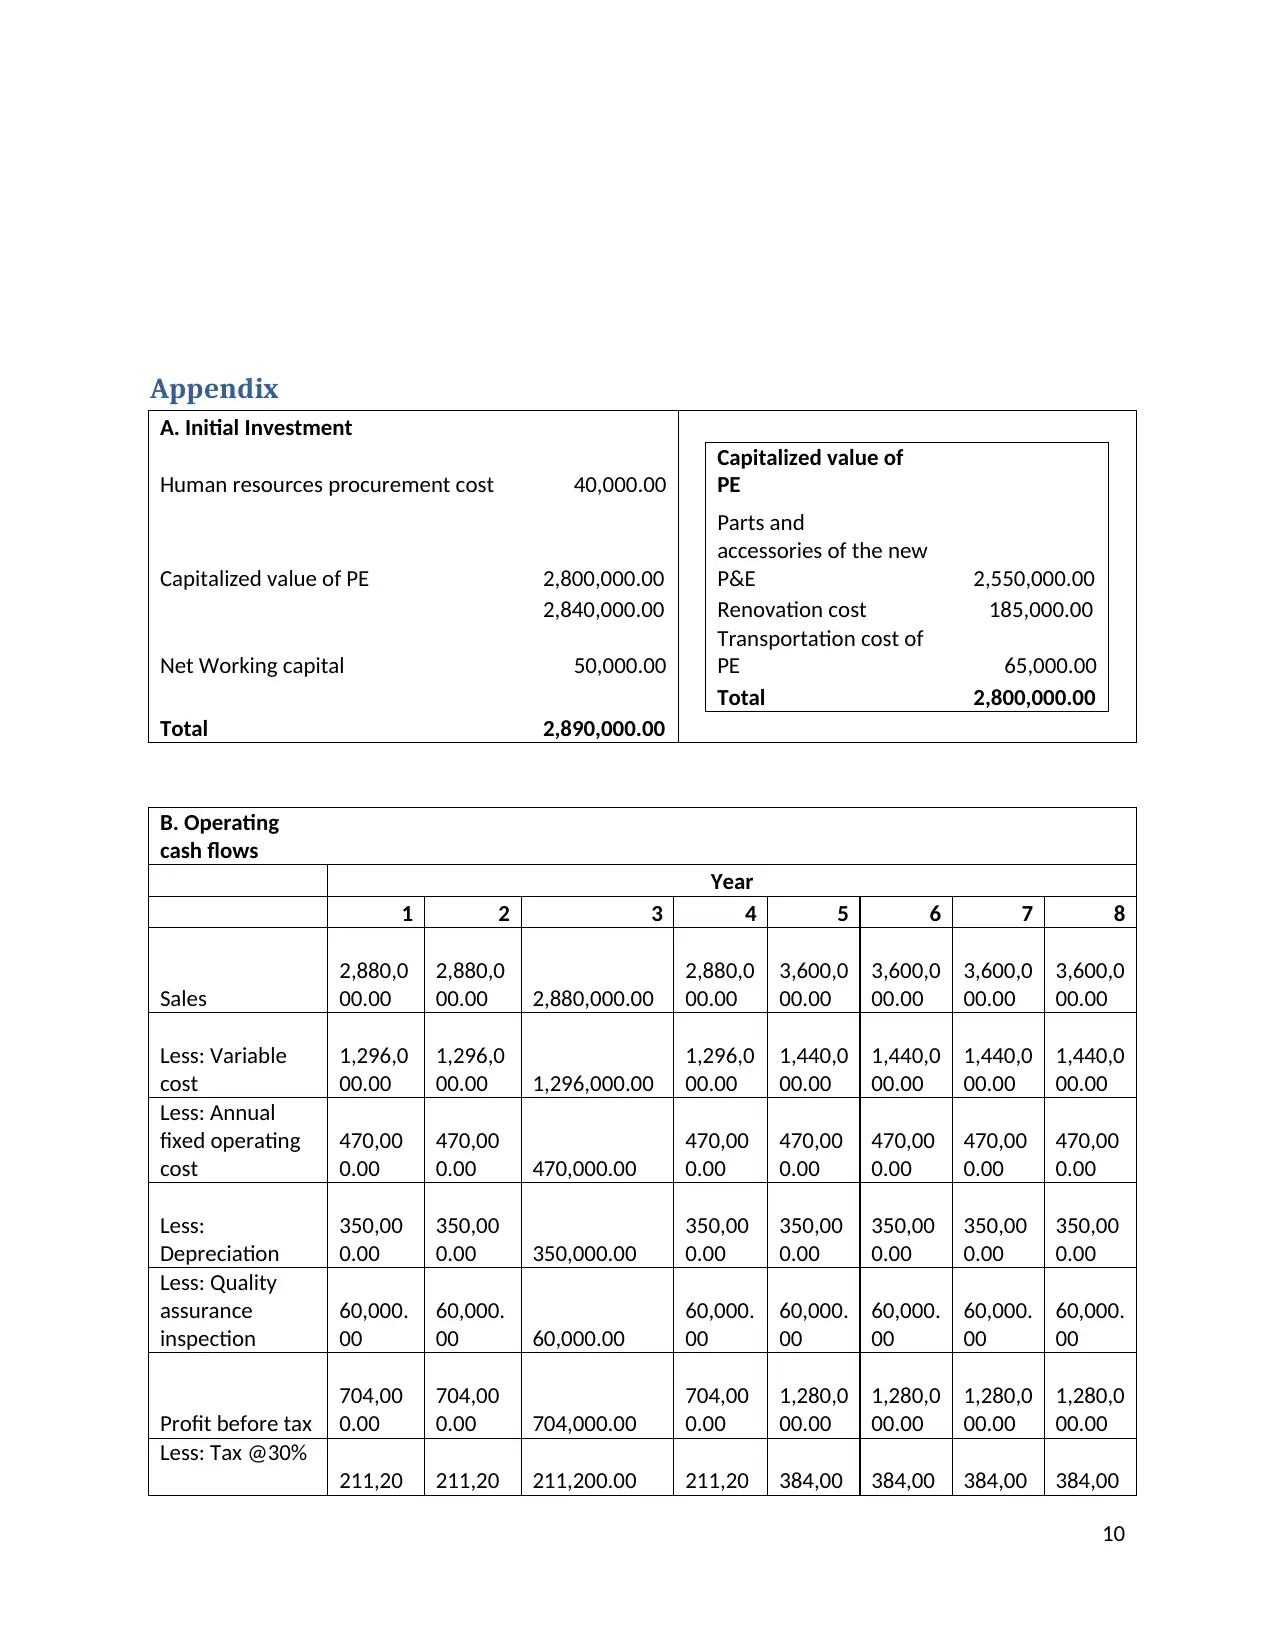
In the case of ALLCURE Inc the computations have been made as shown in appendix.
First, the calculations have been done by using discount rate of 18% and then the calculations
have been revised by taking discount rate of 24%. The initial investment required for the project
has been computed to be $2,890,000. This does not include $700,000 expensed for R&D as the
same has been considered irrelevant cost. The summary of computations is shown in the table
given below:
When WACC 18%
P-REC T-REC
NPV
972,011.
71
952,662.
18
Payback
5.
51
4.
06
When WACC 24%
P-REC T-REC
NPV
280,726.
22
410,070.
19
Paybac
k
6.
91
5.
34
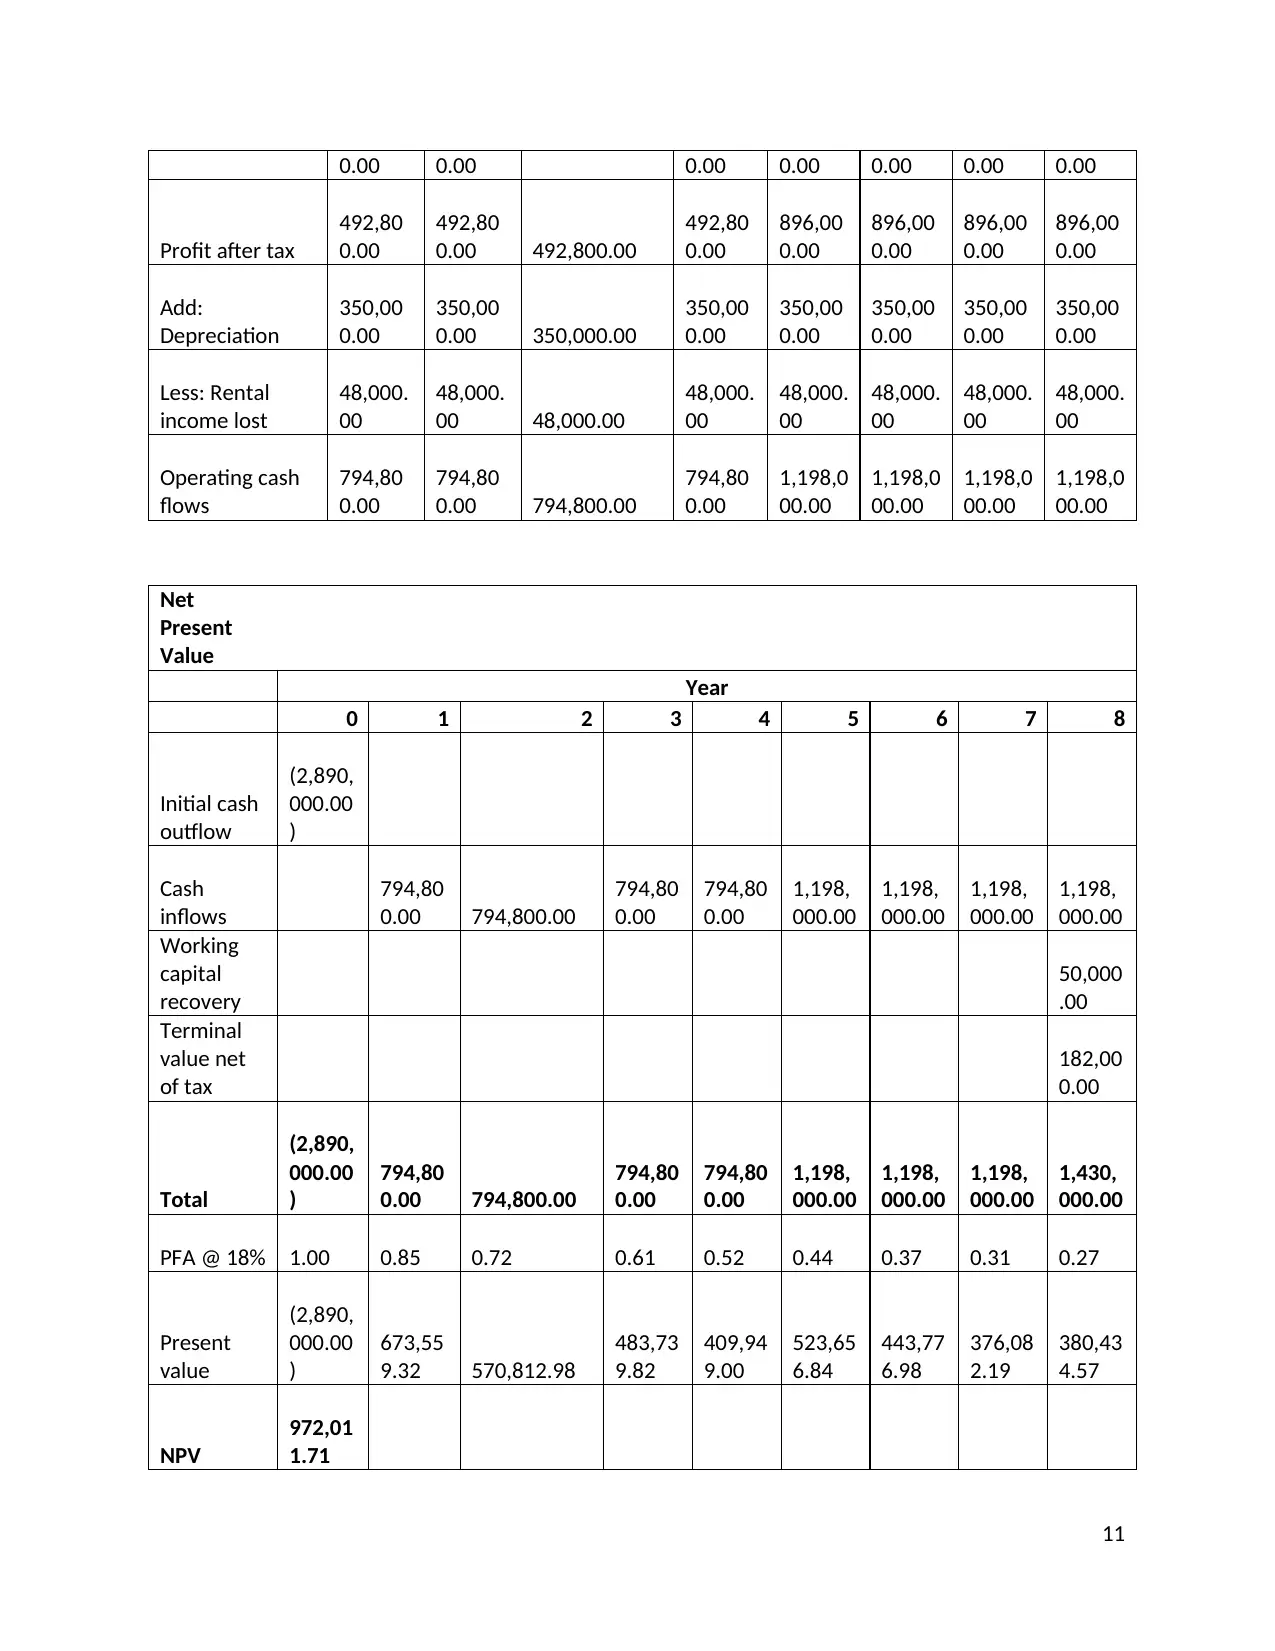
Thus, it could be observed that NPV of P-REC is $972,011.71 and payback period is
worked out to be 5.51 years. The NPV is positive which depicts that the company should accept
5
technique have been used.
The net present value technique involves computation of initial cash outflows, operating
cash inflows and outflows, and terminal cash inflows. The cash flows being computed in this
manner are then discounted to their present value by using an appropriate discount rate (Rossi,
2015). Then the present value of the cash outflows is deducted from the present value of cash
inflows to compute net present value. The decision to accept or reject the project lies on the fact
that whether the NPV is positive or negative. If the NPV is positive, the project is accepted and if
it is negative, the project is rejected. Further, the payback period is computed to determine the
time period to be taken in the recovery of the initial investment. The lower the time period higher
are the chances of project being selected (Hopkinson, 2017).
In the case of ALLCURE Inc the computations have been made as shown in appendix.
First, the calculations have been done by using discount rate of 18% and then the calculations
have been revised by taking discount rate of 24%. The initial investment required for the project
has been computed to be $2,890,000. This does not include $700,000 expensed for R&D as the
same has been considered irrelevant cost. The summary of computations is shown in the table
given below:
When WACC 18%
P-REC T-REC
NPV
972,011.
71
952,662.
18
Payback
5.
51
4.
06
When WACC 24%
P-REC T-REC
NPV
280,726.
22
410,070.
19
Paybac
k
6.
91
5.
34
Thus, it could be observed that NPV of P-REC is $972,011.71 and payback period is
worked out to be 5.51 years. The NPV is positive which depicts that the company should accept
5
the project. Further, the management apprehends that the payback period of the project should be
5 years or less. The payback of P-REC is 5.51 years which is higher than what the management
apprehends. Thus, if the decision is purely based on payback period, the management would
reject the project, however, if the decision is based on NPV, the management would accept the
project.
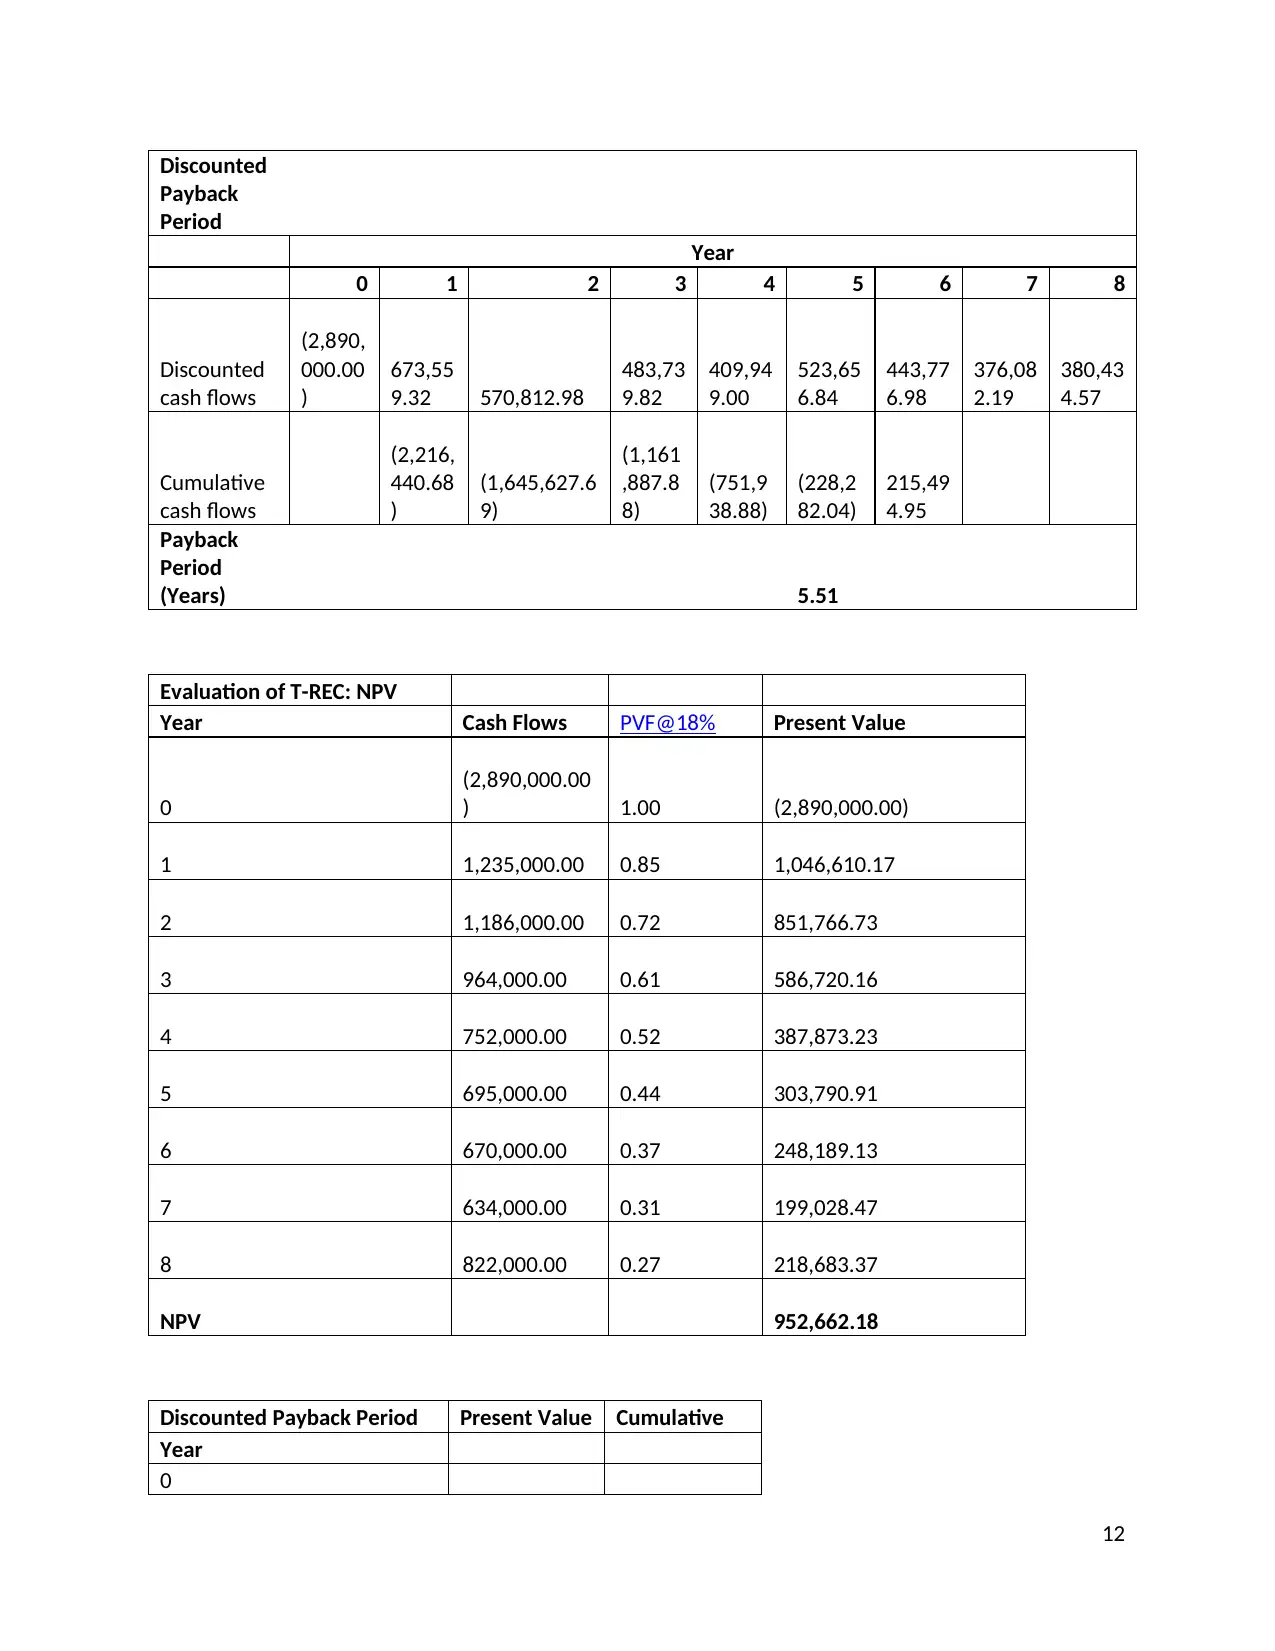
The NPV of alternative product T-REC is worked out to be $952,662.18 and its payback
period is 4.06 years. The NPV is lower as compared to P-REC and the payback period is also
lower. The lower NPV put the alternative less desirable but lower payback period makes it
preferable for the management. If the decision is based on payback period, the management
would prefer T-REC over P-REC.
The scenario changes when the discount rate is changed from 18% to 24%. It could be
observed that the NPV of P-REC declines drastically and payback period increases to 6.91 years
from 5.51 years. The same effect is perceived on T-REC but with less intensity. The NPV of T-
REC still stands at $410,070.19 which is higher than that of P-REC. Further, the payback period
is also 5.34 years which is better as compared to P-REC. Therefore, T-REC completely
outperforms P-REC at discount rate of 24%.
The capital budgeting decisions are surrounded by risk and uncertainties. There are many
risks and uncertainties associated with the current project. The biggest uncertainty is associated
with the discount rate. Further, the operating cash flows have also been worked out based on
different assumptions. There is a possibility of assumptions being going wrong. If it happens, the
operating cash flows would change and it might turn negatively for the company (Chadha, 2018).
Recommendations and Justifications
The management has two primary parameters of deciding the project. The first is payback
period and the second is profitability. The management sets the target for payback period as 5
years or less and profitability should be enough to cover R&D expenses of $24,000 per year. If
the project meets these two criteria, the project becomes acceptable. In the case of ALLCURE
Inc, the management first analyzed P-REC which is a pre-version of a drug. The analysis was
made at two different discount rates i.e. 18% and 24%.
6
5 years or less. The payback of P-REC is 5.51 years which is higher than what the management
apprehends. Thus, if the decision is purely based on payback period, the management would
reject the project, however, if the decision is based on NPV, the management would accept the
project.
The NPV of alternative product T-REC is worked out to be $952,662.18 and its payback
period is 4.06 years. The NPV is lower as compared to P-REC and the payback period is also
lower. The lower NPV put the alternative less desirable but lower payback period makes it
preferable for the management. If the decision is based on payback period, the management
would prefer T-REC over P-REC.
The scenario changes when the discount rate is changed from 18% to 24%. It could be
observed that the NPV of P-REC declines drastically and payback period increases to 6.91 years
from 5.51 years. The same effect is perceived on T-REC but with less intensity. The NPV of T-
REC still stands at $410,070.19 which is higher than that of P-REC. Further, the payback period
is also 5.34 years which is better as compared to P-REC. Therefore, T-REC completely
outperforms P-REC at discount rate of 24%.
The capital budgeting decisions are surrounded by risk and uncertainties. There are many
risks and uncertainties associated with the current project. The biggest uncertainty is associated
with the discount rate. Further, the operating cash flows have also been worked out based on
different assumptions. There is a possibility of assumptions being going wrong. If it happens, the
operating cash flows would change and it might turn negatively for the company (Chadha, 2018).
Recommendations and Justifications
The management has two primary parameters of deciding the project. The first is payback
period and the second is profitability. The management sets the target for payback period as 5
years or less and profitability should be enough to cover R&D expenses of $24,000 per year. If
the project meets these two criteria, the project becomes acceptable. In the case of ALLCURE
Inc, the management first analyzed P-REC which is a pre-version of a drug. The analysis was
made at two different discount rates i.e. 18% and 24%.
6
⊘ This is a preview!⊘
Do you want full access?
Subscribe today to unlock all pages.
Trusted by 1+ million students worldwide
At the discount rate of 18%, it is recommended to the management to accept the project
of developing P-REC. The products NPV is lucrative at $972,011.71 and its payback period is
nearly equal to the management apprehensions. The apprehensions are 5 years payback period
and the product is giving 5.51 years payback period. Therefore, it is strongly recommended to
establish production line for P-REC.
Further, if the discount rate changes from 18% to 24%, the recommendation would
change. In that case, P-REC is not recommended as its NPV falls down severely and payback
period increases significantly. The NPV drops down to $280,726.22 from $972,011.71 and
payback period increases from 5.51 years to 6.91 years. Now, in this situation, the alternative
product T-REC becomes acceptable. T-REC stands with NPV of $410,070.19 and payback of
5.34 years. Thus, the management is recommended to go for the alternative product T-REC.
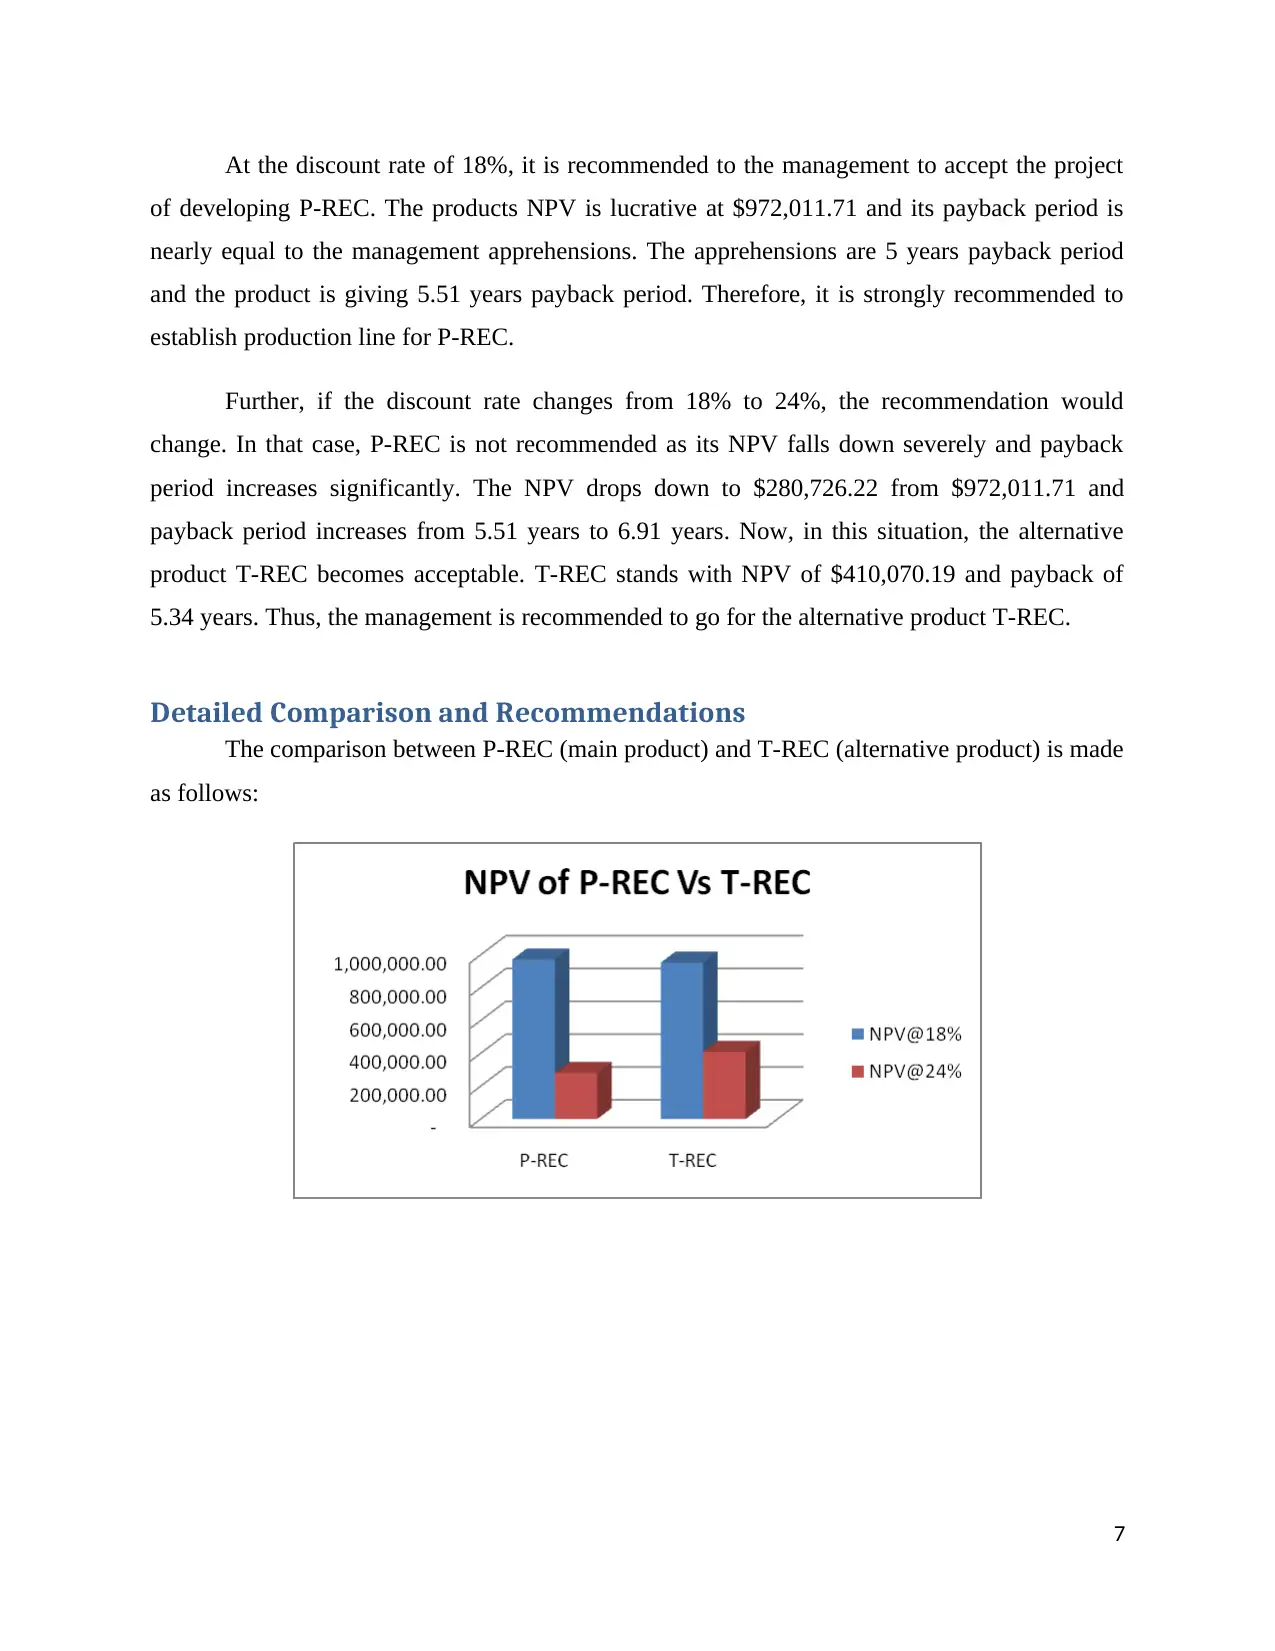
Detailed Comparison and Recommendations
The comparison between P-REC (main product) and T-REC (alternative product) is made
as follows:
7
of developing P-REC. The products NPV is lucrative at $972,011.71 and its payback period is
nearly equal to the management apprehensions. The apprehensions are 5 years payback period
and the product is giving 5.51 years payback period. Therefore, it is strongly recommended to
establish production line for P-REC.
Further, if the discount rate changes from 18% to 24%, the recommendation would
change. In that case, P-REC is not recommended as its NPV falls down severely and payback
period increases significantly. The NPV drops down to $280,726.22 from $972,011.71 and
payback period increases from 5.51 years to 6.91 years. Now, in this situation, the alternative
product T-REC becomes acceptable. T-REC stands with NPV of $410,070.19 and payback of
5.34 years. Thus, the management is recommended to go for the alternative product T-REC.
Detailed Comparison and Recommendations
The comparison between P-REC (main product) and T-REC (alternative product) is made
as follows:
7
Paraphrase This Document
Need a fresh take? Get an instant paraphrase of this document with our AI Paraphraser
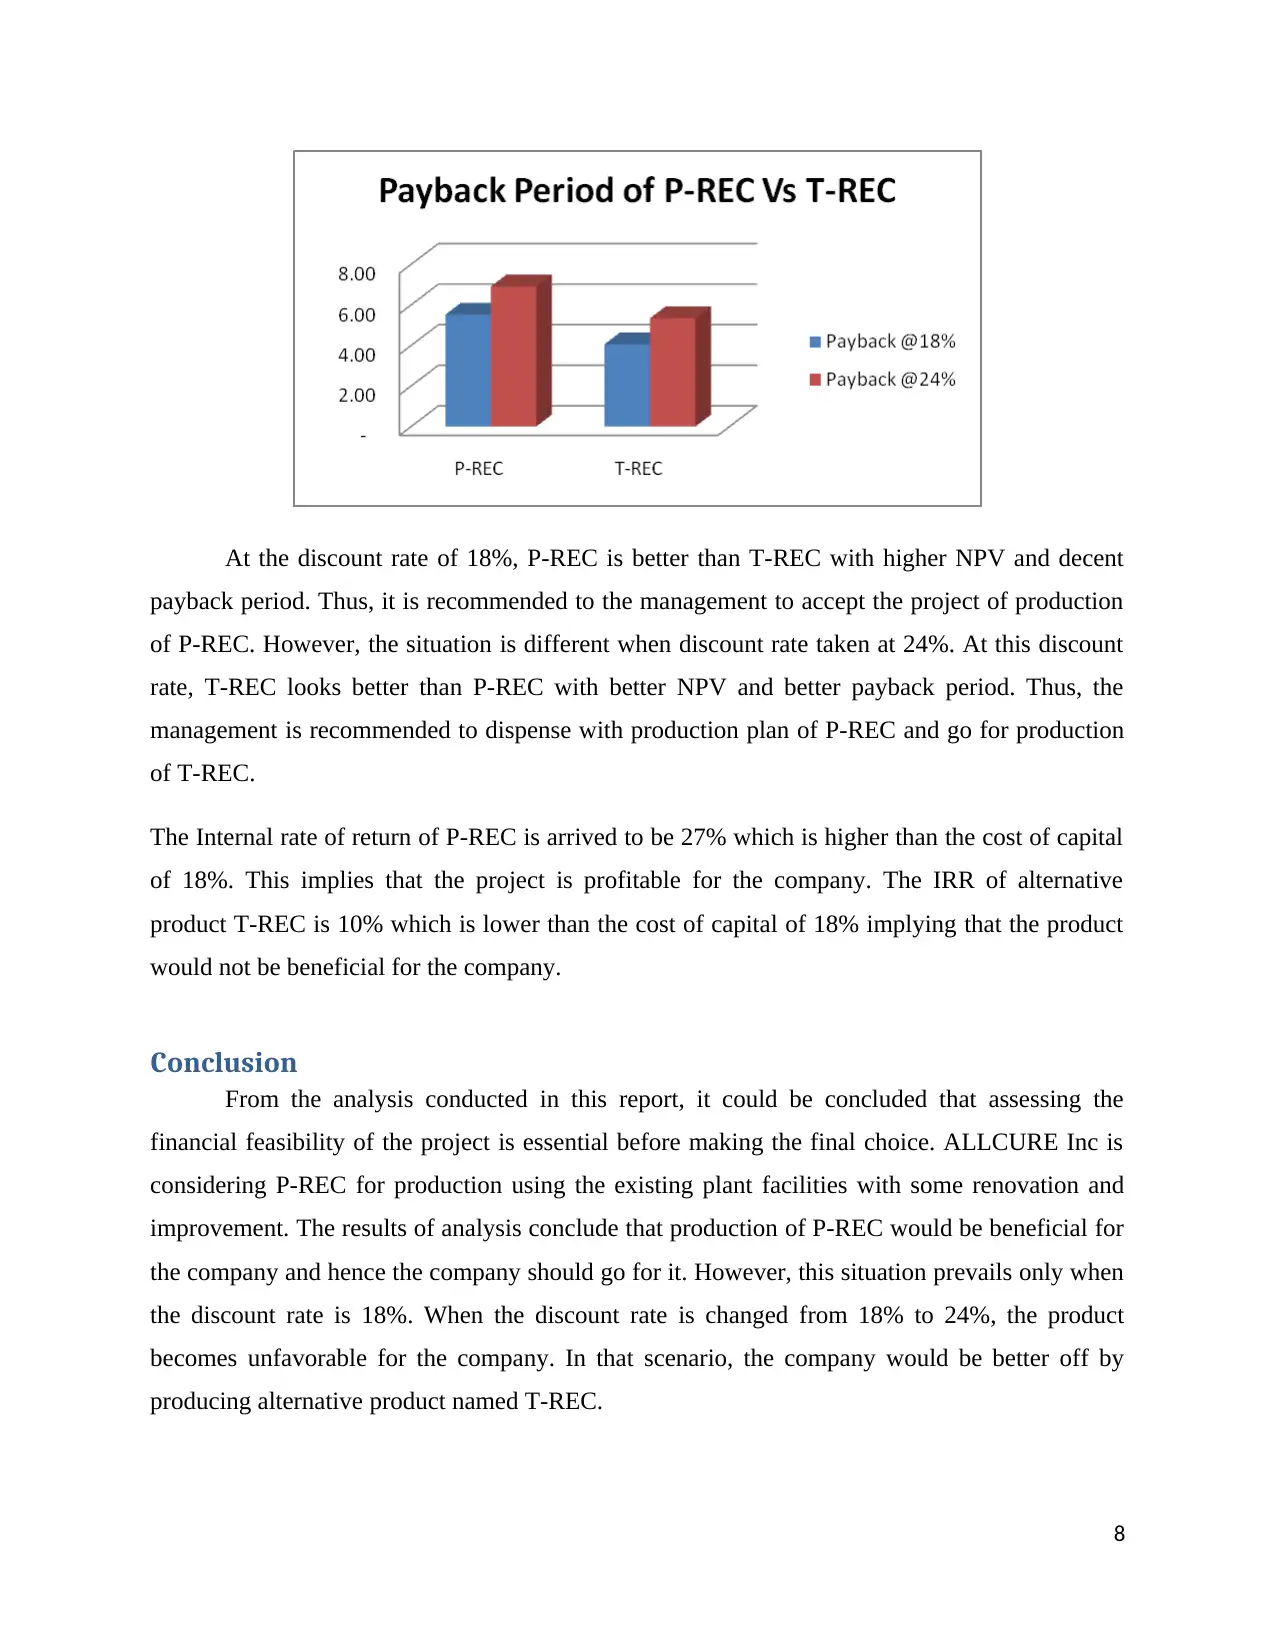
At the discount rate of 18%, P-REC is better than T-REC with higher NPV and decent
payback period. Thus, it is recommended to the management to accept the project of production
of P-REC. However, the situation is different when discount rate taken at 24%. At this discount
rate, T-REC looks better than P-REC with better NPV and better payback period. Thus, the
management is recommended to dispense with production plan of P-REC and go for production
of T-REC.
The Internal rate of return of P-REC is arrived to be 27% which is higher than the cost of capital
of 18%. This implies that the project is profitable for the company. The IRR of alternative
product T-REC is 10% which is lower than the cost of capital of 18% implying that the product
would not be beneficial for the company.
Conclusion
From the analysis conducted in this report, it could be concluded that assessing the
financial feasibility of the project is essential before making the final choice. ALLCURE Inc is
considering P-REC for production using the existing plant facilities with some renovation and
improvement. The results of analysis conclude that production of P-REC would be beneficial for
the company and hence the company should go for it. However, this situation prevails only when
the discount rate is 18%. When the discount rate is changed from 18% to 24%, the product
becomes unfavorable for the company. In that scenario, the company would be better off by
producing alternative product named T-REC.
8
References
Andor, G., Mohanty, S.K. and Toth, T., 2015. Capital budgeting practices: A survey of Central
and Eastern European firms. Emerging Markets Review, 23, pp.148-172.
Chadha, S., 2018, March. CAPITAL BUDGETING TECHNIQUES: EVIDENCE FROM
INDIAN MANUFACTURING SECTOR. In Proceedings of NIDA International Business
Conference 2018–Dealing with Disruption (p. 356).
Hopkinson, M., 2017. Net Present value and risk modelling for projects. Routledge.
Ragin, C.C., 2014. The comparative method: Moving beyond qualitative and quantitative
strategies. Univ of California Press.
Rossi, M., 2015. The use of capital budgeting techniques: an outlook from Italy. International
Journal of Management Practice, 8(1), pp.43-56.
9
⊘ This is a preview!⊘
Do you want full access?
Subscribe today to unlock all pages.
Trusted by 1+ million students worldwide
Appendix
A. Initial Investment
Human resources procurement cost 40,000.00
Capitalized value of
PE
Capitalized value of PE 2,800,000.00
Parts and
accessories of the new
P&E 2,550,000.00
2,840,000.00 Renovation cost 185,000.00
Net Working capital 50,000.00
Transportation cost of
PE 65,000.00
Total 2,800,000.00
Total 2,890,000.00
B. Operating
cash flows
Year
1 2 3 4 5 6 7 8
Sales
2,880,0
00.00
2,880,0
00.00 2,880,000.00
2,880,0
00.00
3,600,0
00.00
3,600,0
00.00
3,600,0
00.00
3,600,0
00.00
Less: Variable
cost
1,296,0
00.00
1,296,0
00.00 1,296,000.00
1,296,0
00.00
1,440,0
00.00
1,440,0
00.00
1,440,0
00.00
1,440,0
00.00
Less: Annual
fixed operating
cost
470,00
0.00
470,00
0.00 470,000.00
470,00
0.00
470,00
0.00
470,00
0.00
470,00
0.00
470,00
0.00
Less:
Depreciation
350,00
0.00
350,00
0.00 350,000.00
350,00
0.00
350,00
0.00
350,00
0.00
350,00
0.00
350,00
0.00
Less: Quality
assurance
inspection
60,000.
00
60,000.
00 60,000.00
60,000.
00
60,000.
00
60,000.
00
60,000.
00
60,000.
00
Profit before tax
704,00
0.00
704,00
0.00 704,000.00
704,00
0.00
1,280,0
00.00
1,280,0
00.00
1,280,0
00.00
1,280,0
00.00
Less: Tax @30%
211,20 211,20 211,200.00 211,20 384,00 384,00 384,00 384,00
10
Paraphrase This Document
Need a fresh take? Get an instant paraphrase of this document with our AI Paraphraser
0.00 0.00 0.00 0.00 0.00 0.00 0.00
Profit after tax
492,80
0.00
492,80
0.00 492,800.00
492,80
0.00
896,00
0.00
896,00
0.00
896,00
0.00
896,00
0.00
Add:
Depreciation
350,00
0.00
350,00
0.00 350,000.00
350,00
0.00
350,00
0.00
350,00
0.00
350,00
0.00
350,00
0.00
Less: Rental
income lost
48,000.
00
48,000.
00 48,000.00
48,000.
00
48,000.
00
48,000.
00
48,000.
00
48,000.
00
Operating cash
flows
794,80
0.00
794,80
0.00 794,800.00
794,80
0.00
1,198,0
00.00
1,198,0
00.00
1,198,0
00.00
1,198,0
00.00
Net
Present
Value
Year
0 1 2 3 4 5 6 7 8
Initial cash
outflow
(2,890,
000.00
)
Cash
inflows
794,80
0.00 794,800.00
794,80
0.00
794,80
0.00
1,198,
000.00
1,198,
000.00
1,198,
000.00
1,198,
000.00
Working
capital
recovery
50,000
.00
Terminal
value net
of tax
182,00
0.00
Total
(2,890,
000.00
)
794,80
0.00 794,800.00
794,80
0.00
794,80
0.00
1,198,
000.00
1,198,
000.00
1,198,
000.00
1,430,
000.00
PFA @ 18% 1.00 0.85 0.72 0.61 0.52 0.44 0.37 0.31 0.27
Present
value
(2,890,
000.00
)
673,55
9.32 570,812.98
483,73
9.82
409,94
9.00
523,65
6.84
443,77
6.98
376,08
2.19
380,43
4.57
NPV
972,01
1.71
11
Discounted
Payback
Period
Year
0 1 2 3 4 5 6 7 8
Discounted
cash flows
(2,890,
000.00
)
673,55
9.32 570,812.98
483,73
9.82
409,94
9.00
523,65
6.84
443,77
6.98
376,08
2.19
380,43
4.57
Cumulative
cash flows
(2,216,
440.68
)
(1,645,627.6
9)
(1,161
,887.8
8)
(751,9
38.88)
(228,2
82.04)
215,49
4.95
Payback
Period
(Years) 5.51
Evaluation of T-REC: NPV
Year Cash Flows PVF@18% Present Value
0
(2,890,000.00
) 1.00 (2,890,000.00)
1 1,235,000.00 0.85 1,046,610.17
2 1,186,000.00 0.72 851,766.73
3 964,000.00 0.61 586,720.16
4 752,000.00 0.52 387,873.23
5 695,000.00 0.44 303,790.91
6 670,000.00 0.37 248,189.13
7 634,000.00 0.31 199,028.47
8 822,000.00 0.27 218,683.37
NPV 952,662.18
Discounted Payback Period Present Value Cumulative
Year
0
12
Payback
Period
Year
0 1 2 3 4 5 6 7 8
Discounted
cash flows
(2,890,
000.00
)
673,55
9.32 570,812.98
483,73
9.82
409,94
9.00
523,65
6.84
443,77
6.98
376,08
2.19
380,43
4.57
Cumulative
cash flows
(2,216,
440.68
)
(1,645,627.6
9)
(1,161
,887.8
8)
(751,9
38.88)
(228,2
82.04)
215,49
4.95
Payback
Period
(Years) 5.51
Evaluation of T-REC: NPV
Year Cash Flows PVF@18% Present Value
0
(2,890,000.00
) 1.00 (2,890,000.00)
1 1,235,000.00 0.85 1,046,610.17
2 1,186,000.00 0.72 851,766.73
3 964,000.00 0.61 586,720.16
4 752,000.00 0.52 387,873.23
5 695,000.00 0.44 303,790.91
6 670,000.00 0.37 248,189.13
7 634,000.00 0.31 199,028.47
8 822,000.00 0.27 218,683.37
NPV 952,662.18
Discounted Payback Period Present Value Cumulative
Year
0
12
⊘ This is a preview!⊘
Do you want full access?
Subscribe today to unlock all pages.
Trusted by 1+ million students worldwide
1 out of 16
Related Documents


Your All-in-One AI-Powered Toolkit for Academic Success.
+13062052269
info@desklib.com
Available 24*7 on WhatsApp / Email
![[object Object]](/_next/static/media/star-bottom.7253800d.svg)
Unlock your academic potential
Copyright © 2020–2026 A2Z Services. All Rights Reserved. Developed and managed by ZUCOL.