FIN20014 Financial Analysis: Investment Appraisal for ALLCURE
VerifiedAdded on 2023/04/23
|22
|6231
|249
Report
AI Summary
This report assesses the financial viability of two product lines proposed by ALLCURE Inc. using investment appraisal techniques, including Net Present Value (NPV), Discounted Payback Period, and Internal Rate of Return (IRR). A qualitative analysis is also conducted to evaluate the social impact of the projects, considering ALLCURE Inc.'s involvement in pharmaceuticals. The analysis suggests that investing in the T-REC project is more beneficial due to its higher NPV at a 24% discount rate, acceptable IRR and discounted payback period. The qualitative analysis supports T-REC due to the potential health hazards associated with P-REC. The report recommends immediate investment in T-REC, with a reassessment of P-REC after further research and development.
Running head: FINANCIAL ANALYSIS
Financial Analysis
Name of the Student:
Name of the University:
Authors Note:
Financial Analysis
Name of the Student:
Name of the University:
Authors Note:
Paraphrase This Document
Need a fresh take? Get an instant paraphrase of this document with our AI Paraphraser
FINANCIAL ANALYSIS
1
Executive Summary:
The assessment aims in evaluating the two-product line that is aimed by ALLCURE Inc. to
produce in future, for increasing its revenue generation capability. The analysis is based on
Investment appraisal techniques, which is used for detecting the financial viability of the
proposed projects. In addition, adequate evaluation of the qualitative analysis has been
conducted in the assessment for identifying social viability in approving the project.
ALLCURE Inc. deals with medicines, which can have negative and positive impact on the
health of the consumer that directly raises the social concerns of the CFO, while making any
kind of investment decisions. However, after evaluating all the relevant information
regarding the qualitative and quantitative analysis, it can be detected that investment T-REC
is highly beneficial for the organization. Therefore, ALLCURE Inc. can start the project with
T-REC and after getting the report from R&D about P-REC, the next project can be started.
FINANCIAL ANALYSIS
2
Table of Contents
1. Introduction:...........................................................................................................................3
2. Findings:.................................................................................................................................3
2.1 Quantitative Analysis:..........................................................................................................3
2.2 Qualitative Analysis:............................................................................................................5
3. Recommendation and Justifications:......................................................................................6
4. Detailed comparison and Further Recommendations:...........................................................6
5. Conclusion:............................................................................................................................7
Reference and Bibliography:......................................................................................................9
Appendix:.................................................................................................................................11
⊘ This is a preview!⊘
Do you want full access?
Subscribe today to unlock all pages.
Trusted by 1+ million students worldwide
FINANCIAL ANALYSIS
3
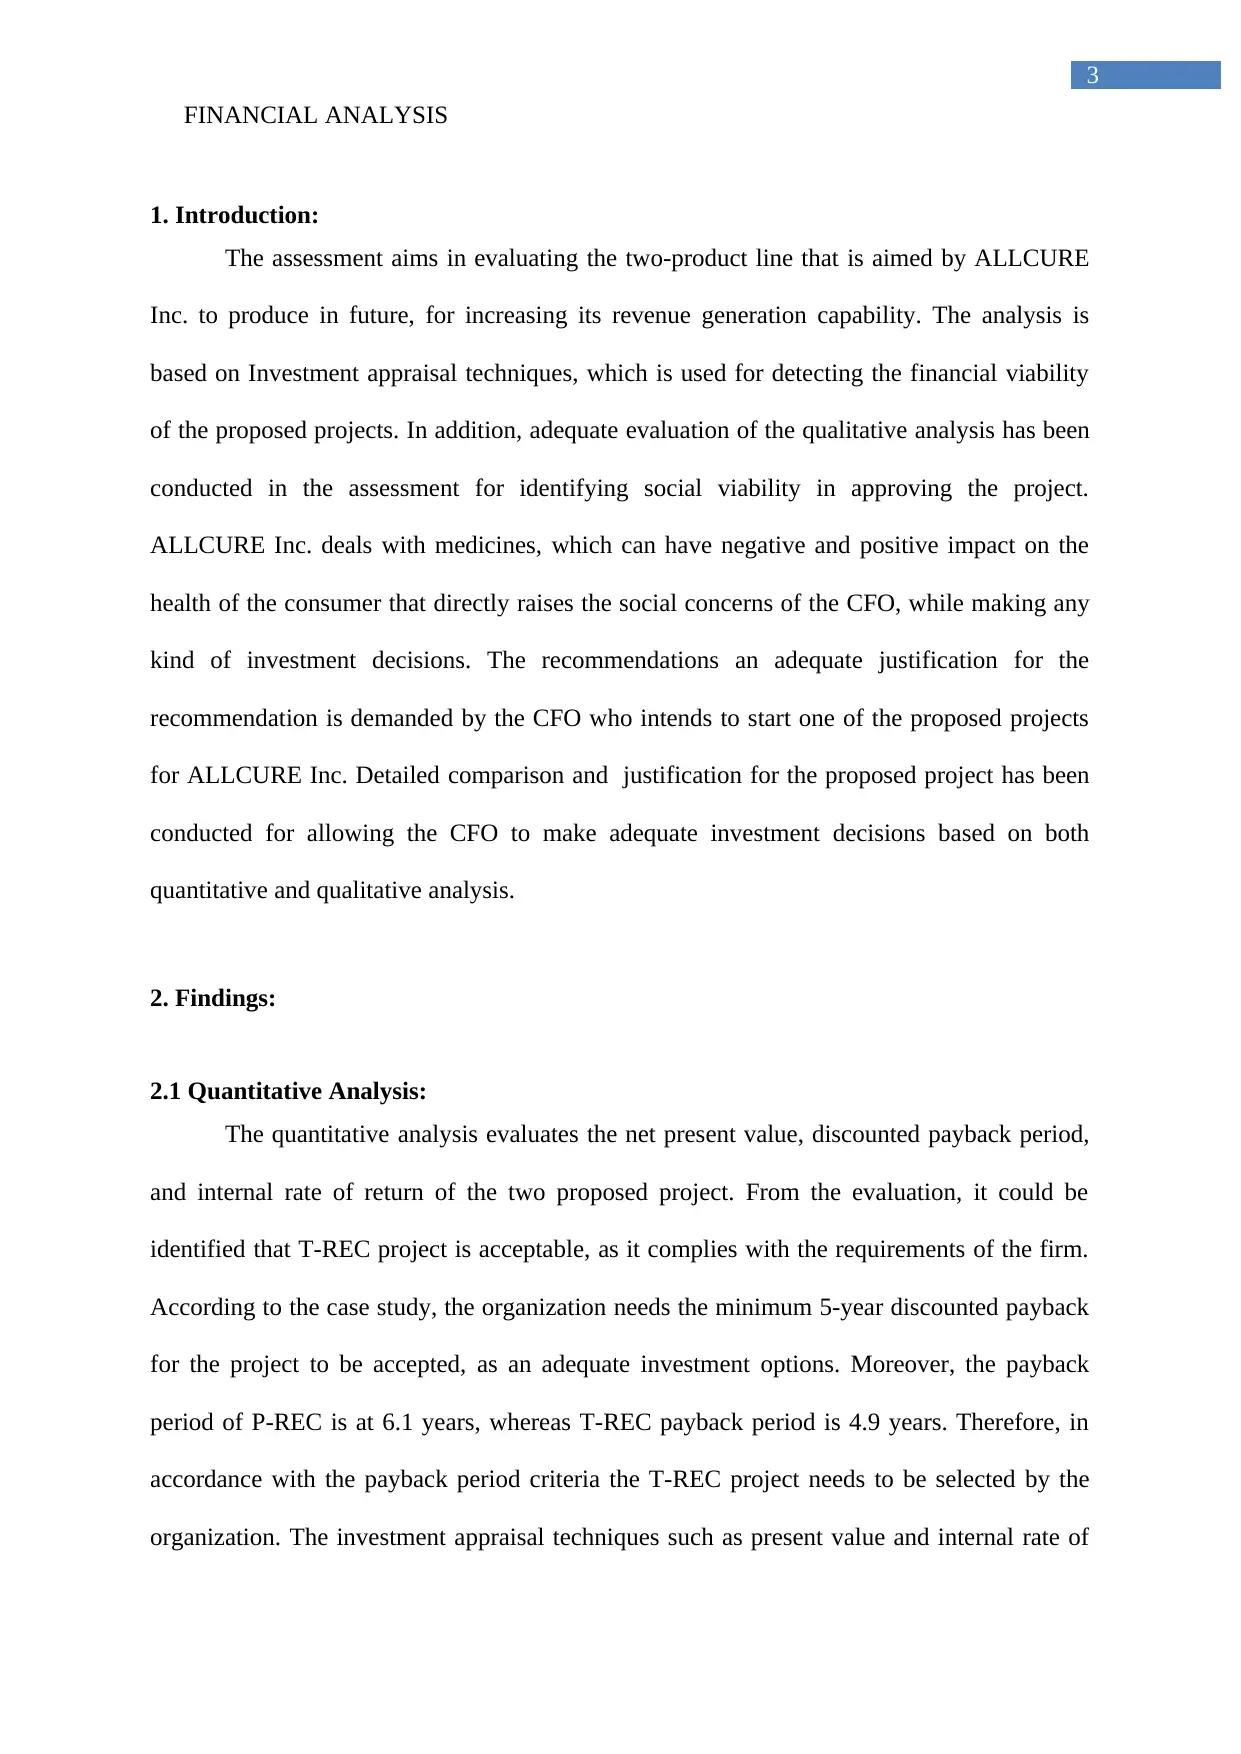
1. Introduction:
The assessment aims in evaluating the two-product line that is aimed by ALLCURE
Inc. to produce in future, for increasing its revenue generation capability. The analysis is
based on Investment appraisal techniques, which is used for detecting the financial viability
of the proposed projects. In addition, adequate evaluation of the qualitative analysis has been
conducted in the assessment for identifying social viability in approving the project.
ALLCURE Inc. deals with medicines, which can have negative and positive impact on the
health of the consumer that directly raises the social concerns of the CFO, while making any
kind of investment decisions. The recommendations an adequate justification for the
recommendation is demanded by the CFO who intends to start one of the proposed projects
for ALLCURE Inc. Detailed comparison and justification for the proposed project has been
conducted for allowing the CFO to make adequate investment decisions based on both
quantitative and qualitative analysis.
2. Findings:
2.1 Quantitative Analysis:
The quantitative analysis evaluates the net present value, discounted payback period,
and internal rate of return of the two proposed project. From the evaluation, it could be
identified that T-REC project is acceptable, as it complies with the requirements of the firm.
According to the case study, the organization needs the minimum 5-year discounted payback
for the project to be accepted, as an adequate investment options. Moreover, the payback
period of P-REC is at 6.1 years, whereas T-REC payback period is 4.9 years. Therefore, in
accordance with the payback period criteria the T-REC project needs to be selected by the
organization. The investment appraisal techniques such as present value and internal rate of
3
1. Introduction:
The assessment aims in evaluating the two-product line that is aimed by ALLCURE
Inc. to produce in future, for increasing its revenue generation capability. The analysis is
based on Investment appraisal techniques, which is used for detecting the financial viability
of the proposed projects. In addition, adequate evaluation of the qualitative analysis has been
conducted in the assessment for identifying social viability in approving the project.
ALLCURE Inc. deals with medicines, which can have negative and positive impact on the
health of the consumer that directly raises the social concerns of the CFO, while making any
kind of investment decisions. The recommendations an adequate justification for the
recommendation is demanded by the CFO who intends to start one of the proposed projects
for ALLCURE Inc. Detailed comparison and justification for the proposed project has been
conducted for allowing the CFO to make adequate investment decisions based on both
quantitative and qualitative analysis.
2. Findings:
2.1 Quantitative Analysis:
The quantitative analysis evaluates the net present value, discounted payback period,
and internal rate of return of the two proposed project. From the evaluation, it could be
identified that T-REC project is acceptable, as it complies with the requirements of the firm.
According to the case study, the organization needs the minimum 5-year discounted payback
for the project to be accepted, as an adequate investment options. Moreover, the payback
period of P-REC is at 6.1 years, whereas T-REC payback period is 4.9 years. Therefore, in
accordance with the payback period criteria the T-REC project needs to be selected by the
organization. The investment appraisal techniques such as present value and internal rate of
Paraphrase This Document
Need a fresh take? Get an instant paraphrase of this document with our AI Paraphraser
FINANCIAL ANALYSIS
4
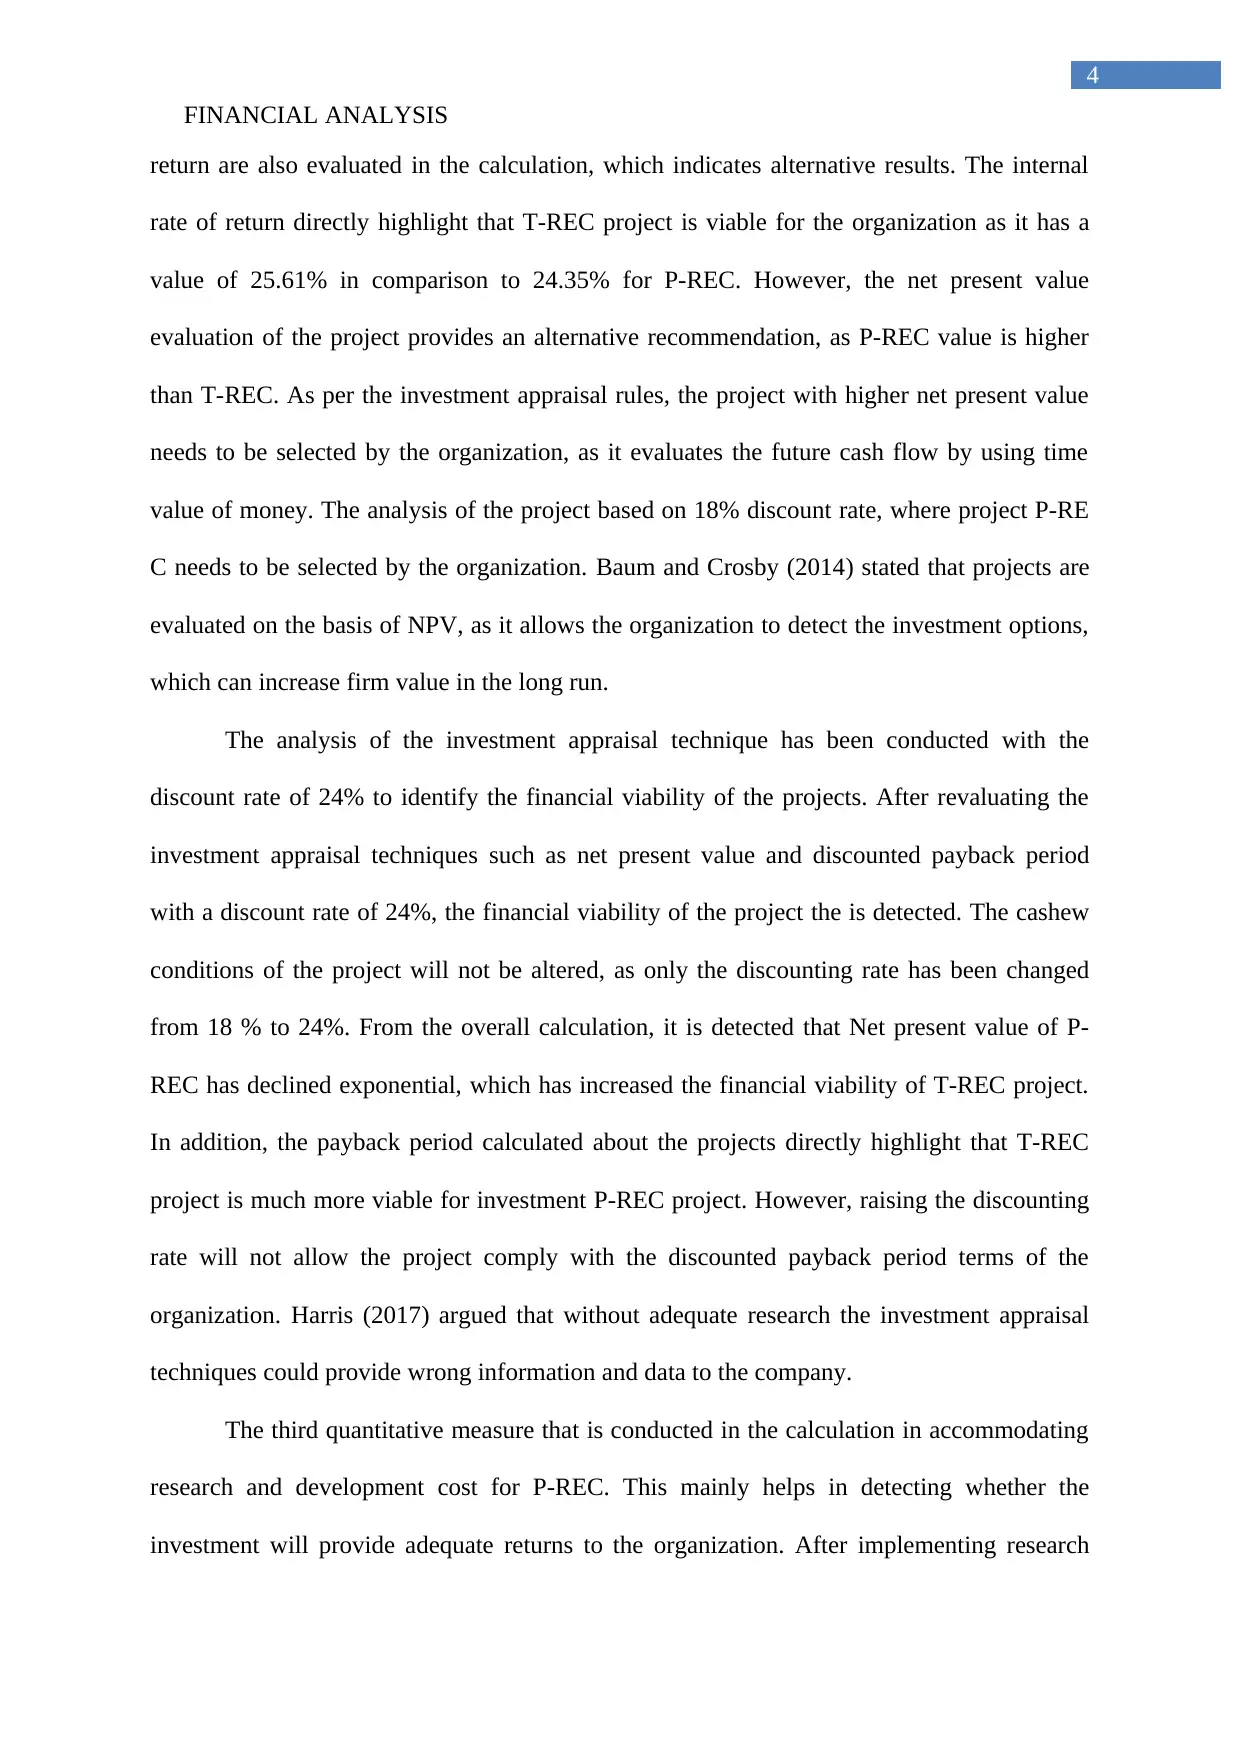
return are also evaluated in the calculation, which indicates alternative results. The internal
rate of return directly highlight that T-REC project is viable for the organization as it has a
value of 25.61% in comparison to 24.35% for P-REC. However, the net present value
evaluation of the project provides an alternative recommendation, as P-REC value is higher
than T-REC. As per the investment appraisal rules, the project with higher net present value
needs to be selected by the organization, as it evaluates the future cash flow by using time
value of money. The analysis of the project based on 18% discount rate, where project P-RE
C needs to be selected by the organization. Baum and Crosby (2014) stated that projects are
evaluated on the basis of NPV, as it allows the organization to detect the investment options,
which can increase firm value in the long run.
The analysis of the investment appraisal technique has been conducted with the
discount rate of 24% to identify the financial viability of the projects. After revaluating the
investment appraisal techniques such as net present value and discounted payback period
with a discount rate of 24%, the financial viability of the project the is detected. The cashew
conditions of the project will not be altered, as only the discounting rate has been changed
from 18 % to 24%. From the overall calculation, it is detected that Net present value of P-
REC has declined exponential, which has increased the financial viability of T-REC project.
In addition, the payback period calculated about the projects directly highlight that T-REC
project is much more viable for investment P-REC project. However, raising the discounting
rate will not allow the project comply with the discounted payback period terms of the
organization. Harris (2017) argued that without adequate research the investment appraisal
techniques could provide wrong information and data to the company.
The third quantitative measure that is conducted in the calculation in accommodating
research and development cost for P-REC. This mainly helps in detecting whether the
investment will provide adequate returns to the organization. After implementing research
4
return are also evaluated in the calculation, which indicates alternative results. The internal
rate of return directly highlight that T-REC project is viable for the organization as it has a
value of 25.61% in comparison to 24.35% for P-REC. However, the net present value
evaluation of the project provides an alternative recommendation, as P-REC value is higher
than T-REC. As per the investment appraisal rules, the project with higher net present value
needs to be selected by the organization, as it evaluates the future cash flow by using time
value of money. The analysis of the project based on 18% discount rate, where project P-RE
C needs to be selected by the organization. Baum and Crosby (2014) stated that projects are
evaluated on the basis of NPV, as it allows the organization to detect the investment options,
which can increase firm value in the long run.
The analysis of the investment appraisal technique has been conducted with the
discount rate of 24% to identify the financial viability of the projects. After revaluating the
investment appraisal techniques such as net present value and discounted payback period
with a discount rate of 24%, the financial viability of the project the is detected. The cashew
conditions of the project will not be altered, as only the discounting rate has been changed
from 18 % to 24%. From the overall calculation, it is detected that Net present value of P-
REC has declined exponential, which has increased the financial viability of T-REC project.
In addition, the payback period calculated about the projects directly highlight that T-REC
project is much more viable for investment P-REC project. However, raising the discounting
rate will not allow the project comply with the discounted payback period terms of the
organization. Harris (2017) argued that without adequate research the investment appraisal
techniques could provide wrong information and data to the company.
The third quantitative measure that is conducted in the calculation in accommodating
research and development cost for P-REC. This mainly helps in detecting whether the
investment will provide adequate returns to the organization. After implementing research
FINANCIAL ANALYSIS
5
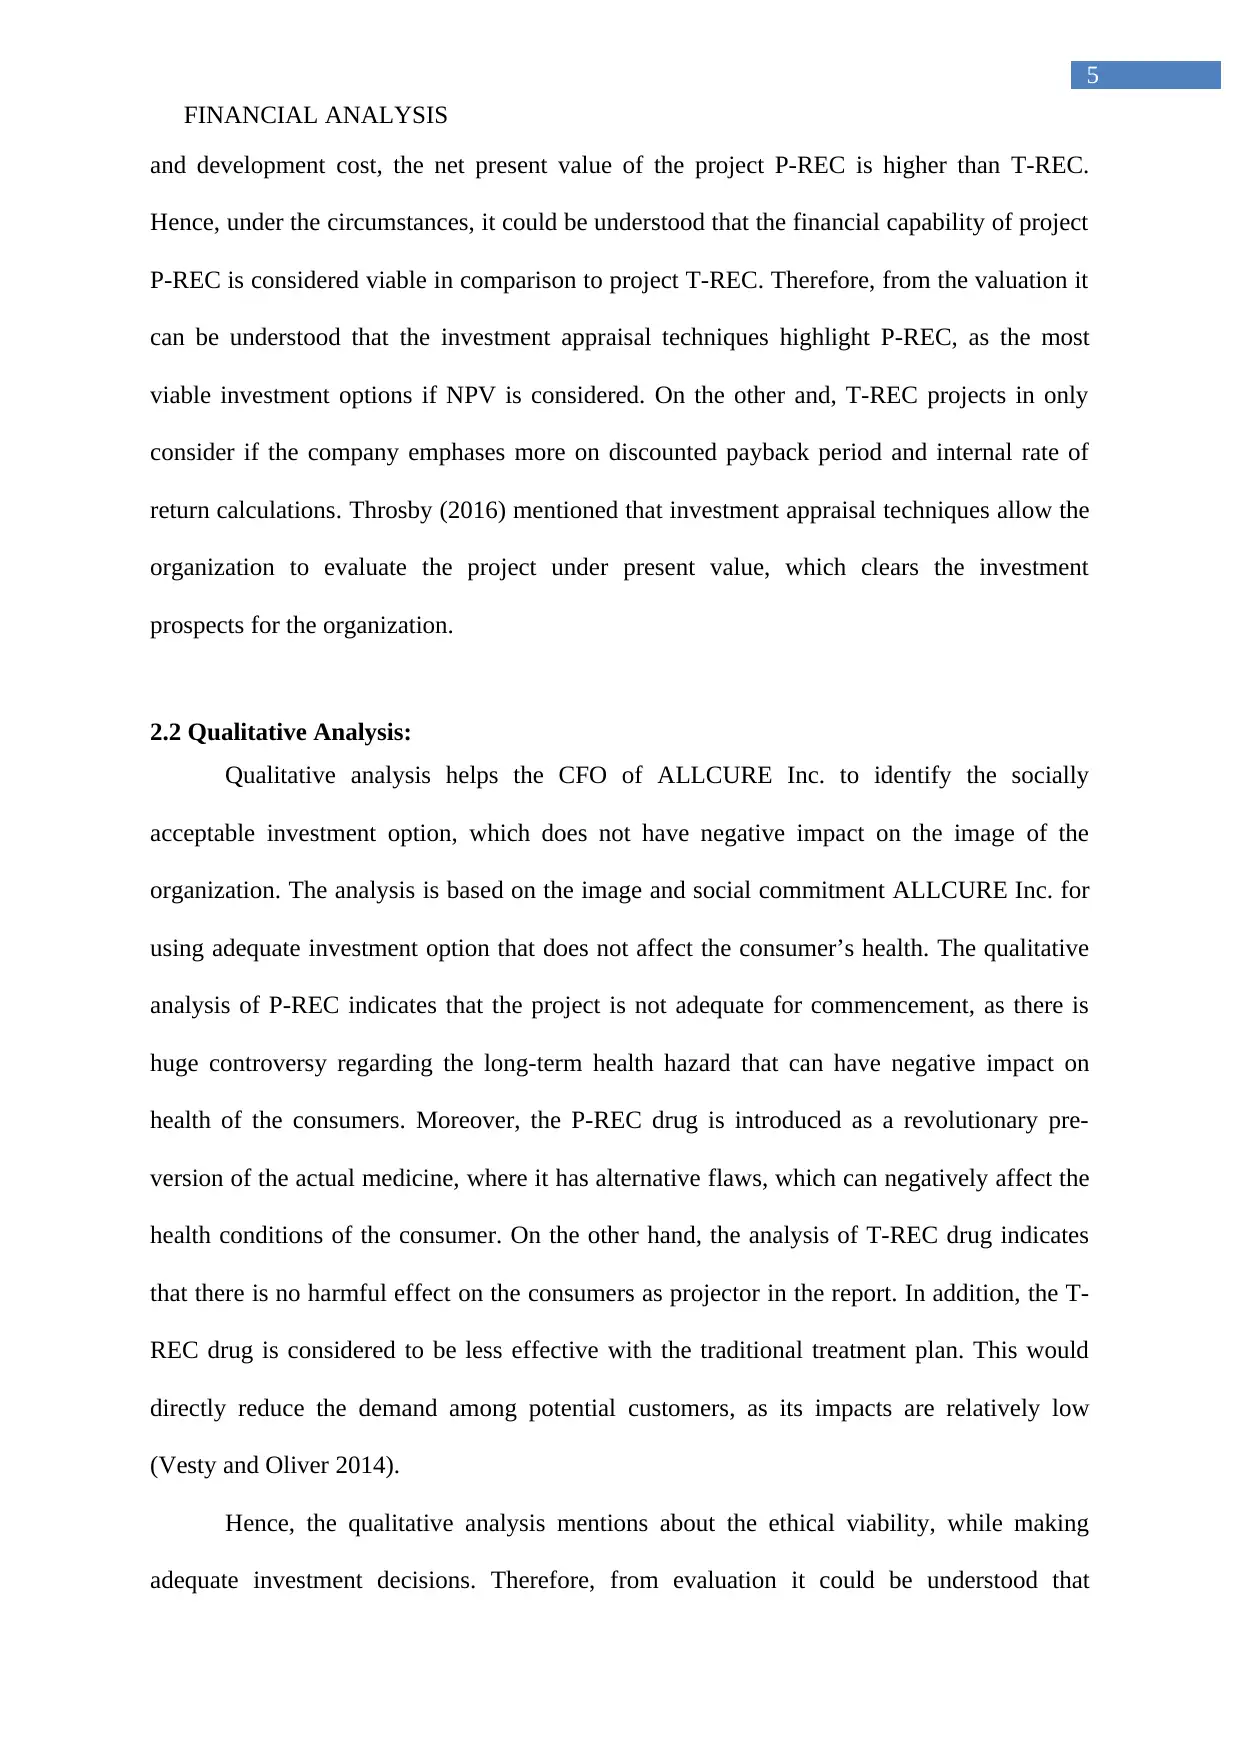
and development cost, the net present value of the project P-REC is higher than T-REC.
Hence, under the circumstances, it could be understood that the financial capability of project
P-REC is considered viable in comparison to project T-REC. Therefore, from the valuation it
can be understood that the investment appraisal techniques highlight P-REC, as the most
viable investment options if NPV is considered. On the other and, T-REC projects in only
consider if the company emphases more on discounted payback period and internal rate of
return calculations. Throsby (2016) mentioned that investment appraisal techniques allow the
organization to evaluate the project under present value, which clears the investment
prospects for the organization.
2.2 Qualitative Analysis:
Qualitative analysis helps the CFO of ALLCURE Inc. to identify the socially
acceptable investment option, which does not have negative impact on the image of the
organization. The analysis is based on the image and social commitment ALLCURE Inc. for
using adequate investment option that does not affect the consumer’s health. The qualitative
analysis of P-REC indicates that the project is not adequate for commencement, as there is
huge controversy regarding the long-term health hazard that can have negative impact on
health of the consumers. Moreover, the P-REC drug is introduced as a revolutionary pre-
version of the actual medicine, where it has alternative flaws, which can negatively affect the
health conditions of the consumer. On the other hand, the analysis of T-REC drug indicates
that there is no harmful effect on the consumers as projector in the report. In addition, the T-
REC drug is considered to be less effective with the traditional treatment plan. This would
directly reduce the demand among potential customers, as its impacts are relatively low
(Vesty and Oliver 2014).
Hence, the qualitative analysis mentions about the ethical viability, while making
adequate investment decisions. Therefore, from evaluation it could be understood that
5
and development cost, the net present value of the project P-REC is higher than T-REC.
Hence, under the circumstances, it could be understood that the financial capability of project
P-REC is considered viable in comparison to project T-REC. Therefore, from the valuation it
can be understood that the investment appraisal techniques highlight P-REC, as the most
viable investment options if NPV is considered. On the other and, T-REC projects in only
consider if the company emphases more on discounted payback period and internal rate of
return calculations. Throsby (2016) mentioned that investment appraisal techniques allow the
organization to evaluate the project under present value, which clears the investment
prospects for the organization.
2.2 Qualitative Analysis:
Qualitative analysis helps the CFO of ALLCURE Inc. to identify the socially
acceptable investment option, which does not have negative impact on the image of the
organization. The analysis is based on the image and social commitment ALLCURE Inc. for
using adequate investment option that does not affect the consumer’s health. The qualitative
analysis of P-REC indicates that the project is not adequate for commencement, as there is
huge controversy regarding the long-term health hazard that can have negative impact on
health of the consumers. Moreover, the P-REC drug is introduced as a revolutionary pre-
version of the actual medicine, where it has alternative flaws, which can negatively affect the
health conditions of the consumer. On the other hand, the analysis of T-REC drug indicates
that there is no harmful effect on the consumers as projector in the report. In addition, the T-
REC drug is considered to be less effective with the traditional treatment plan. This would
directly reduce the demand among potential customers, as its impacts are relatively low
(Vesty and Oliver 2014).
Hence, the qualitative analysis mentions about the ethical viability, while making
adequate investment decisions. Therefore, from evaluation it could be understood that
⊘ This is a preview!⊘
Do you want full access?
Subscribe today to unlock all pages.
Trusted by 1+ million students worldwide
FINANCIAL ANALYSIS
6
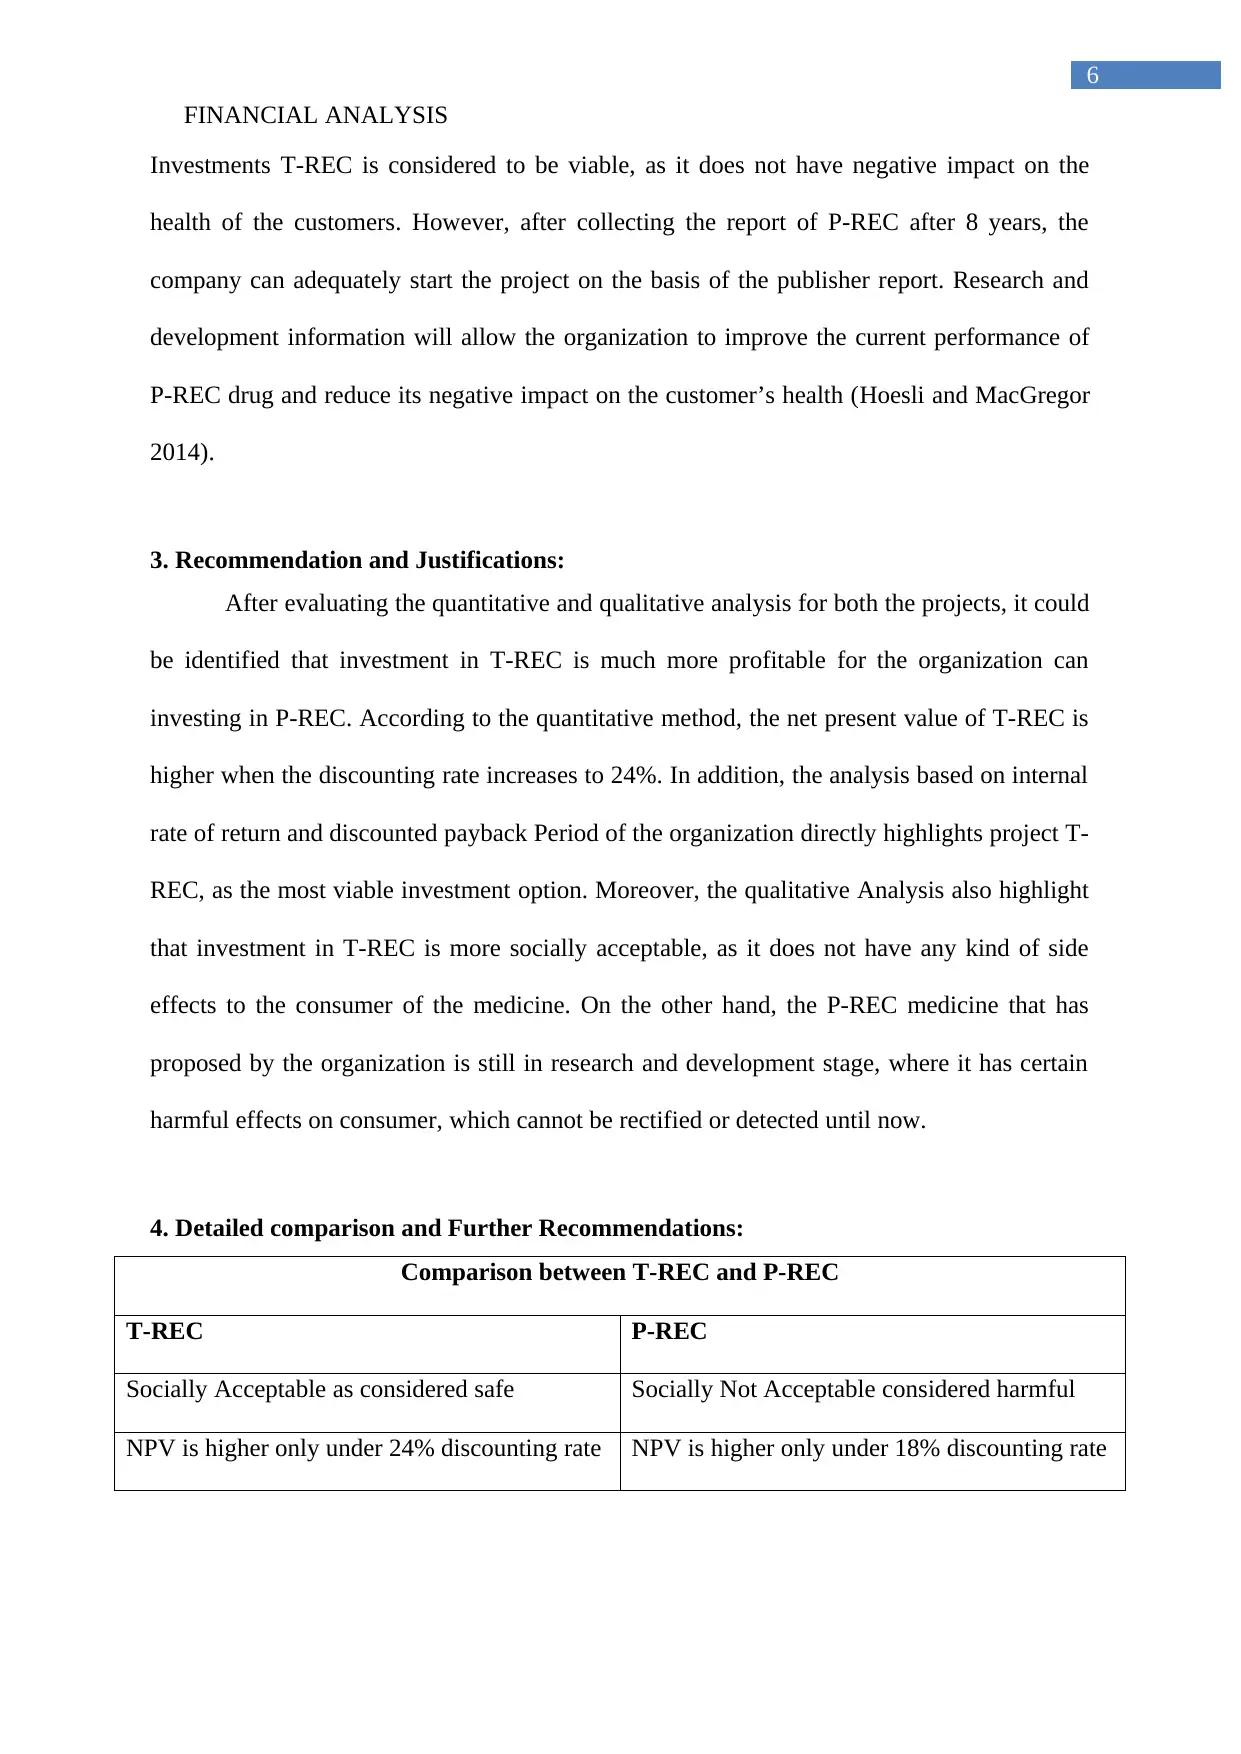
Investments T-REC is considered to be viable, as it does not have negative impact on the
health of the customers. However, after collecting the report of P-REC after 8 years, the
company can adequately start the project on the basis of the publisher report. Research and
development information will allow the organization to improve the current performance of
P-REC drug and reduce its negative impact on the customer’s health (Hoesli and MacGregor
2014).
3. Recommendation and Justifications:
After evaluating the quantitative and qualitative analysis for both the projects, it could
be identified that investment in T-REC is much more profitable for the organization can
investing in P-REC. According to the quantitative method, the net present value of T-REC is
higher when the discounting rate increases to 24%. In addition, the analysis based on internal
rate of return and discounted payback Period of the organization directly highlights project T-
REC, as the most viable investment option. Moreover, the qualitative Analysis also highlight
that investment in T-REC is more socially acceptable, as it does not have any kind of side
effects to the consumer of the medicine. On the other hand, the P-REC medicine that has
proposed by the organization is still in research and development stage, where it has certain
harmful effects on consumer, which cannot be rectified or detected until now.
4. Detailed comparison and Further Recommendations:
Comparison between T-REC and P-REC
T-REC P-REC
Socially Acceptable as considered safe Socially Not Acceptable considered harmful
NPV is higher only under 24% discounting rate NPV is higher only under 18% discounting rate
6
Investments T-REC is considered to be viable, as it does not have negative impact on the
health of the customers. However, after collecting the report of P-REC after 8 years, the
company can adequately start the project on the basis of the publisher report. Research and
development information will allow the organization to improve the current performance of
P-REC drug and reduce its negative impact on the customer’s health (Hoesli and MacGregor
2014).
3. Recommendation and Justifications:
After evaluating the quantitative and qualitative analysis for both the projects, it could
be identified that investment in T-REC is much more profitable for the organization can
investing in P-REC. According to the quantitative method, the net present value of T-REC is
higher when the discounting rate increases to 24%. In addition, the analysis based on internal
rate of return and discounted payback Period of the organization directly highlights project T-
REC, as the most viable investment option. Moreover, the qualitative Analysis also highlight
that investment in T-REC is more socially acceptable, as it does not have any kind of side
effects to the consumer of the medicine. On the other hand, the P-REC medicine that has
proposed by the organization is still in research and development stage, where it has certain
harmful effects on consumer, which cannot be rectified or detected until now.
4. Detailed comparison and Further Recommendations:
Comparison between T-REC and P-REC
T-REC P-REC
Socially Acceptable as considered safe Socially Not Acceptable considered harmful
NPV is higher only under 24% discounting rate NPV is higher only under 18% discounting rate
Paraphrase This Document
Need a fresh take? Get an instant paraphrase of this document with our AI Paraphraser
FINANCIAL ANALYSIS
7
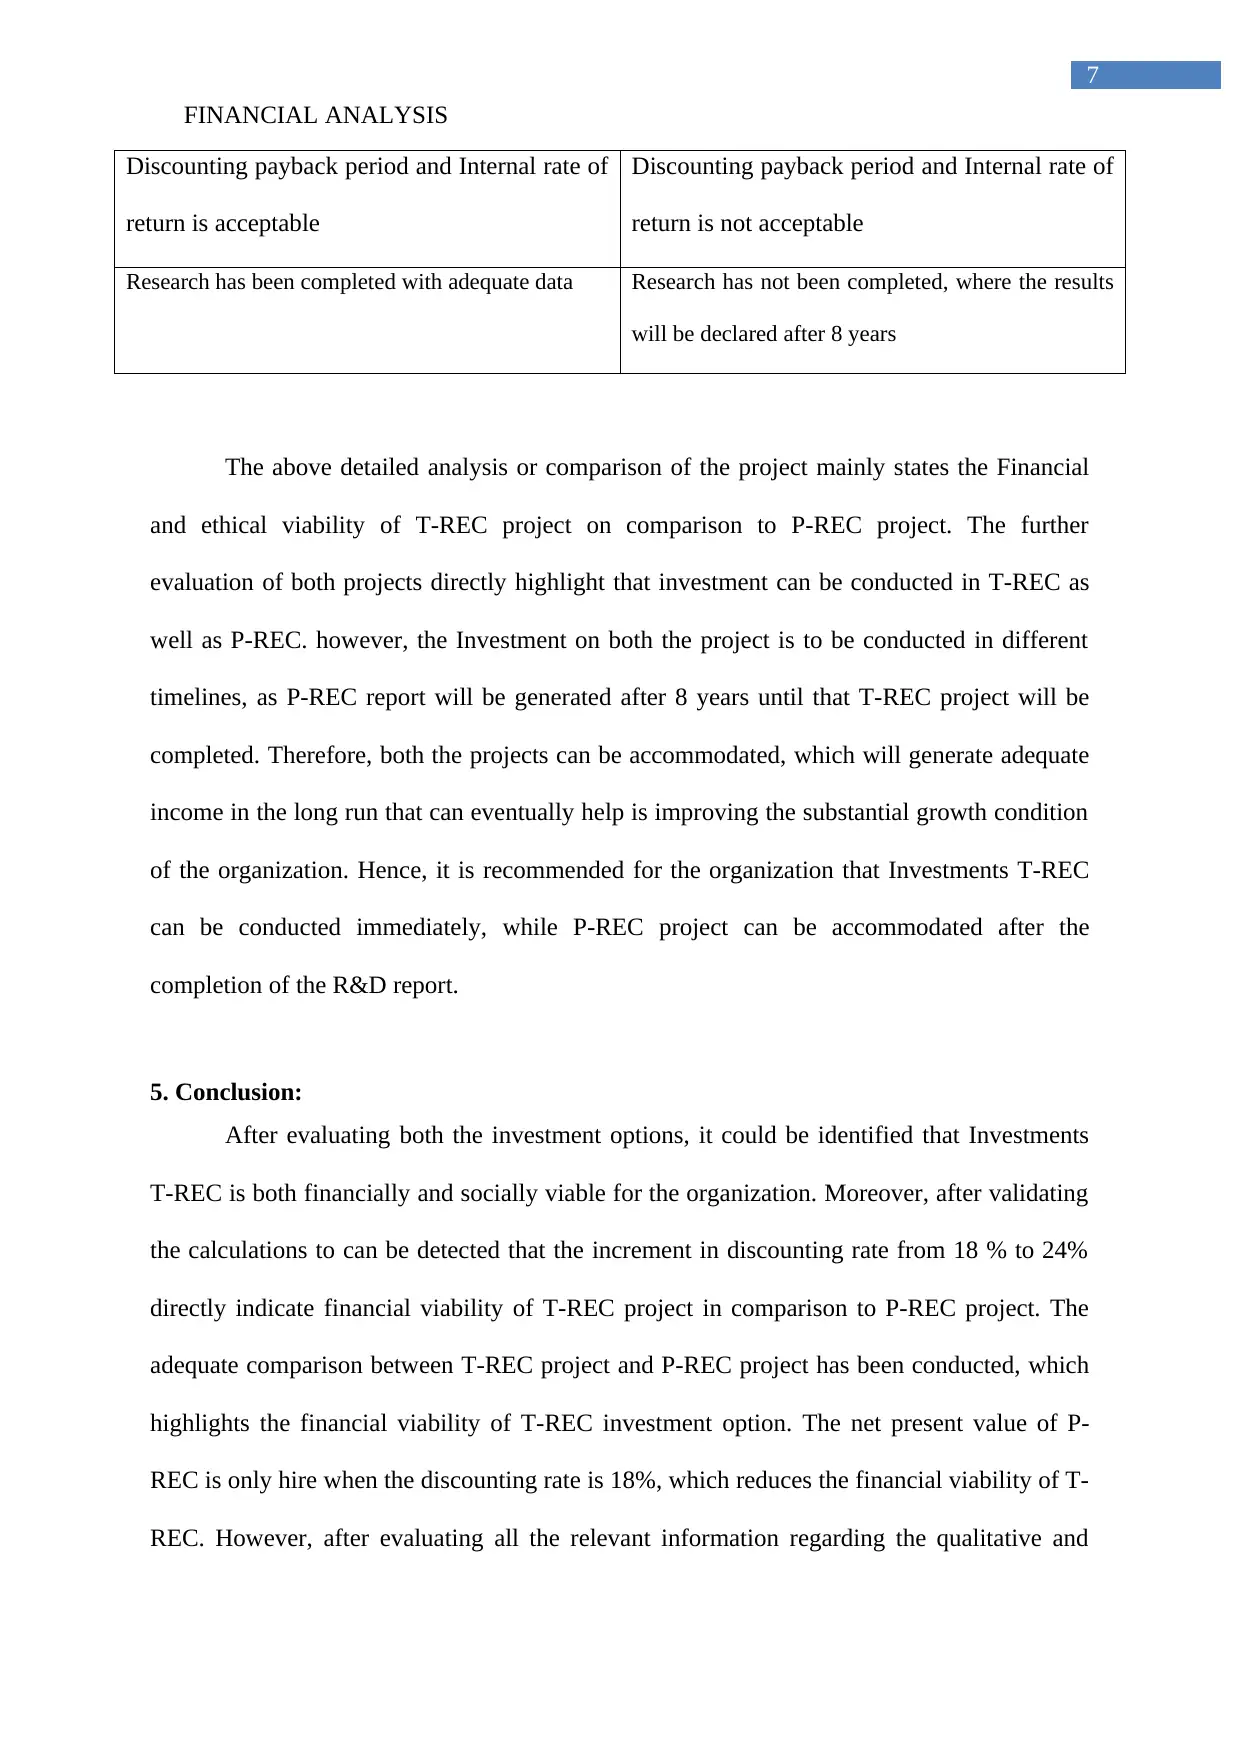
Discounting payback period and Internal rate of
return is acceptable
Discounting payback period and Internal rate of
return is not acceptable
Research has been completed with adequate data Research has not been completed, where the results
will be declared after 8 years
The above detailed analysis or comparison of the project mainly states the Financial
and ethical viability of T-REC project on comparison to P-REC project. The further
evaluation of both projects directly highlight that investment can be conducted in T-REC as
well as P-REC. however, the Investment on both the project is to be conducted in different
timelines, as P-REC report will be generated after 8 years until that T-REC project will be
completed. Therefore, both the projects can be accommodated, which will generate adequate
income in the long run that can eventually help is improving the substantial growth condition
of the organization. Hence, it is recommended for the organization that Investments T-REC
can be conducted immediately, while P-REC project can be accommodated after the
completion of the R&D report.
5. Conclusion:
After evaluating both the investment options, it could be identified that Investments
T-REC is both financially and socially viable for the organization. Moreover, after validating
the calculations to can be detected that the increment in discounting rate from 18 % to 24%
directly indicate financial viability of T-REC project in comparison to P-REC project. The
adequate comparison between T-REC project and P-REC project has been conducted, which
highlights the financial viability of T-REC investment option. The net present value of P-
REC is only hire when the discounting rate is 18%, which reduces the financial viability of T-
REC. However, after evaluating all the relevant information regarding the qualitative and
7
Discounting payback period and Internal rate of
return is acceptable
Discounting payback period and Internal rate of
return is not acceptable
Research has been completed with adequate data Research has not been completed, where the results
will be declared after 8 years
The above detailed analysis or comparison of the project mainly states the Financial
and ethical viability of T-REC project on comparison to P-REC project. The further
evaluation of both projects directly highlight that investment can be conducted in T-REC as
well as P-REC. however, the Investment on both the project is to be conducted in different
timelines, as P-REC report will be generated after 8 years until that T-REC project will be
completed. Therefore, both the projects can be accommodated, which will generate adequate
income in the long run that can eventually help is improving the substantial growth condition
of the organization. Hence, it is recommended for the organization that Investments T-REC
can be conducted immediately, while P-REC project can be accommodated after the
completion of the R&D report.
5. Conclusion:
After evaluating both the investment options, it could be identified that Investments
T-REC is both financially and socially viable for the organization. Moreover, after validating
the calculations to can be detected that the increment in discounting rate from 18 % to 24%
directly indicate financial viability of T-REC project in comparison to P-REC project. The
adequate comparison between T-REC project and P-REC project has been conducted, which
highlights the financial viability of T-REC investment option. The net present value of P-
REC is only hire when the discounting rate is 18%, which reduces the financial viability of T-
REC. However, after evaluating all the relevant information regarding the qualitative and
FINANCIAL ANALYSIS
8
quantitative analysis, it can be detected that investment T-REC is highly beneficial for the
organization. Therefore, ALLCURE Inc. can start the project with T-REC and after getting
the report from R&D about P-REC, the next project can be started.
8
quantitative analysis, it can be detected that investment T-REC is highly beneficial for the
organization. Therefore, ALLCURE Inc. can start the project with T-REC and after getting
the report from R&D about P-REC, the next project can be started.
⊘ This is a preview!⊘
Do you want full access?
Subscribe today to unlock all pages.
Trusted by 1+ million students worldwide
FINANCIAL ANALYSIS
9
Reference and Bibliography:
Alkaraan, F., 2016. Strategic investment decision-making–Scanning and screening
investment opportunities: The expansion of Guinness in West Africa. Meditari Accountancy
Research, 24(4), pp.505-526.
Baddeley, M., 2017. Investment: Theories and Analyses. Macmillan International Higher
Education.
Baum, A.E. and Crosby, N., 2014. Property investment appraisal. John Wiley & Sons.
Chaysin, P., Daengdej, J. and Tangjitprom, N., 2016. Survey on Available Methods to
Evaluate IT Investment. Electronic Journal Information Systems Evaluation Volume, 19(1).
Elmassri, M.M., Harris, E.P. and Carter, D.B., 2016. Accounting for strategic investment
decision-making under extreme uncertainty. The British Accounting Review, 48(2), pp.151-
168.
Harris, E., 2017. Strategic project risk appraisal and management. Routledge.
Hoesli, M. and MacGregor, B.D., 2014. Property investment: principles and practice of
portfolio management. Routledge.
Jorge-Calderón, D., 2016. Aviation investment: Economic appraisal for airports, air traffic
management, airlines and aeronautics. Routledge.
Kafuku, J.M., Saman, M.Z.M., Sharif, S. and Zakuan, N., 2015. Investment decision issues
from remanufacturing system perspective: literature review and further research. Procedia
CIRP, 26, pp.589-594.
Paraphrase This Document
Need a fresh take? Get an instant paraphrase of this document with our AI Paraphraser

FINANCIAL ANALYSIS
10
Locatelli, G., Invernizzi, D.C. and Mancini, M., 2016. Investment and risk appraisal in
energy storage systems: A real options approach. Energy, 104, pp.114-131.
Throsby, D., 2016. Investment in urban heritage conservation in developing countries:
Concepts, methods and data. City, Culture and Society, 7(2), pp.81-86.
Vesty, G. and Oliver, J., 2014. Corporate strategy and accounting for sustainability in
investment appraisal. Corporate Ownership and Control, 11(2D), pp.377-388.
FINANCIAL ANALYSIS
11
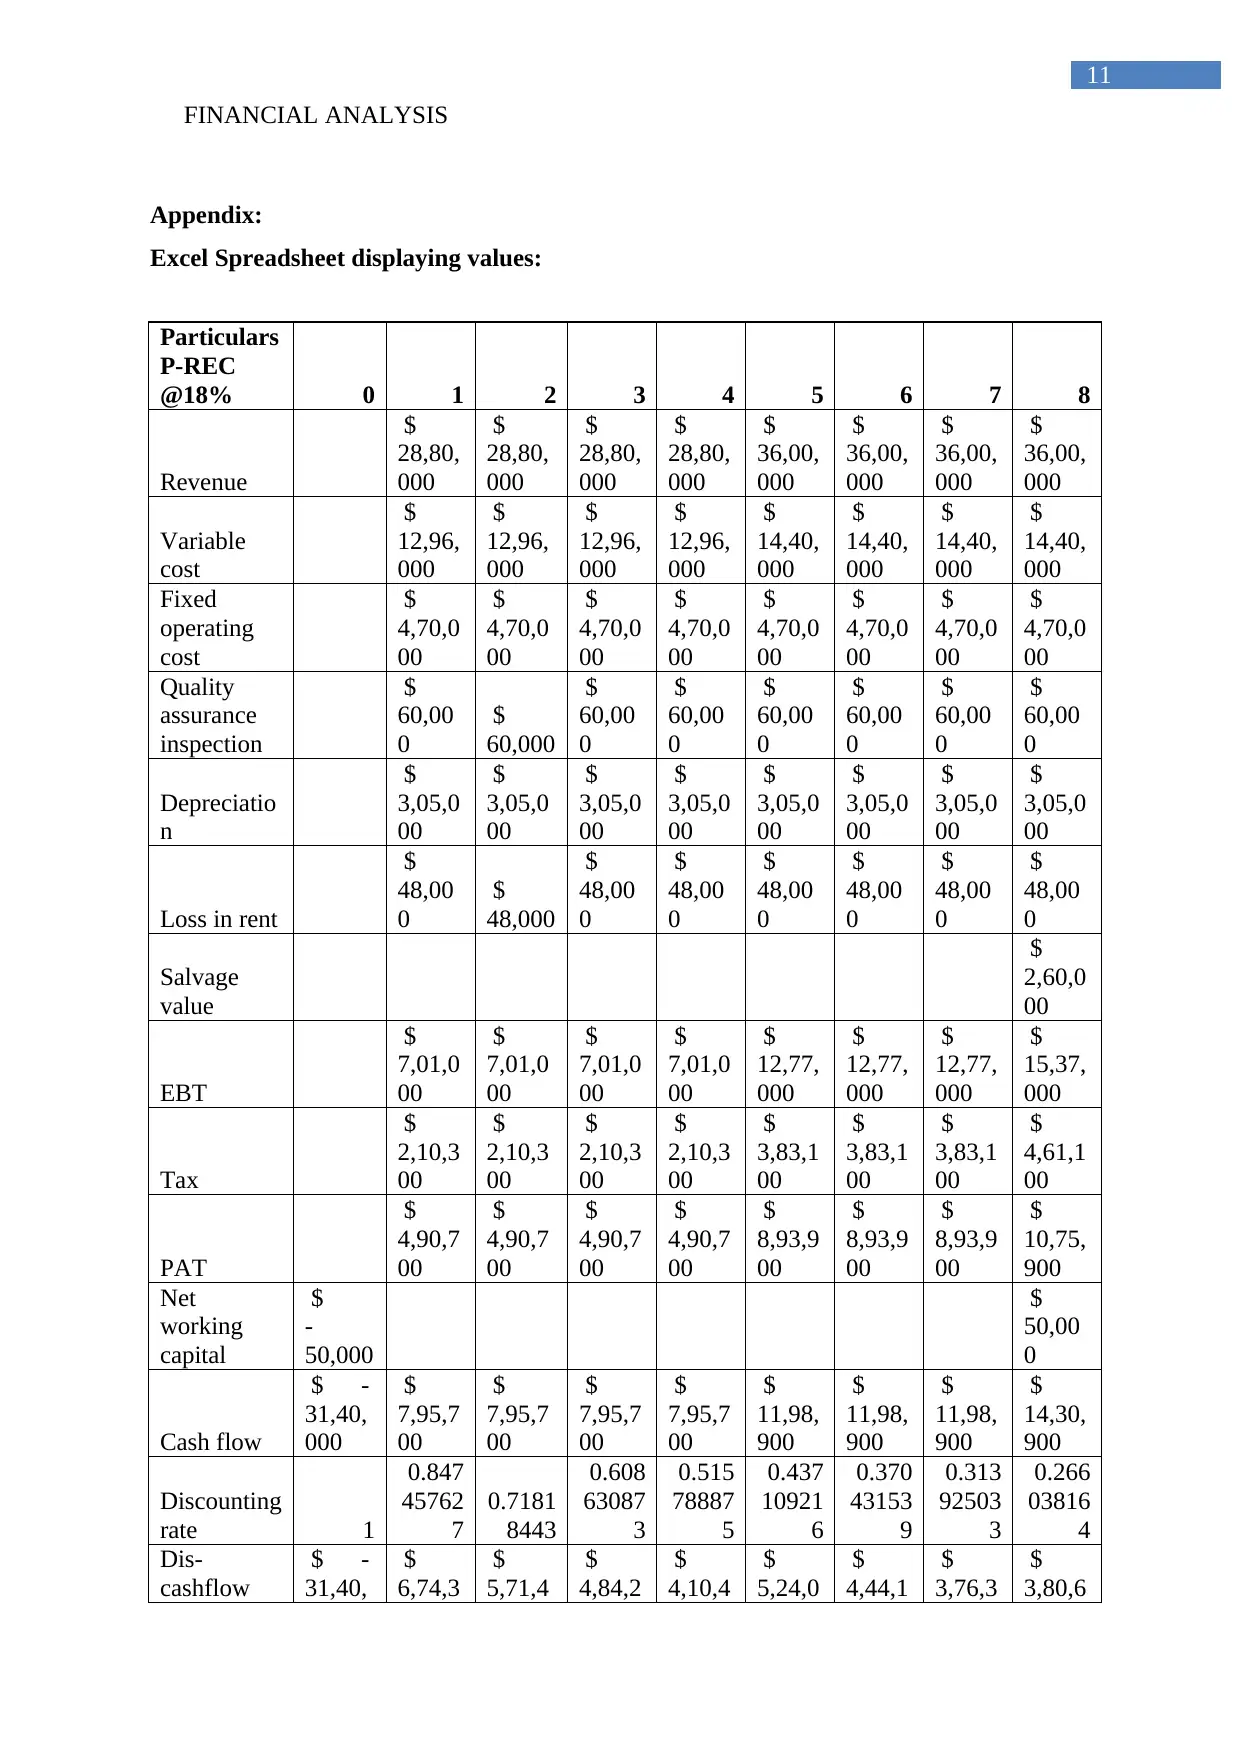
Appendix:
Excel Spreadsheet displaying values:
Particulars
P-REC
@18% 0 1 2 3 4 5 6 7 8
Revenue
$
28,80,
000
$
28,80,
000
$
28,80,
000
$
28,80,
000
$
36,00,
000
$
36,00,
000
$
36,00,
000
$
36,00,
000
Variable
cost
$
12,96,
000
$
12,96,
000
$
12,96,
000
$
12,96,
000
$
14,40,
000
$
14,40,
000
$
14,40,
000
$
14,40,
000
Fixed
operating
cost
$
4,70,0
00
$
4,70,0
00
$
4,70,0
00
$
4,70,0
00
$
4,70,0
00
$
4,70,0
00
$
4,70,0
00
$
4,70,0
00
Quality
assurance
inspection
$
60,00
0
$
60,000
$
60,00
0
$
60,00
0
$
60,00
0
$
60,00
0
$
60,00
0
$
60,00
0
Depreciatio
n
$
3,05,0
00
$
3,05,0
00
$
3,05,0
00
$
3,05,0
00
$
3,05,0
00
$
3,05,0
00
$
3,05,0
00
$
3,05,0
00
Loss in rent
$
48,00
0
$
48,000
$
48,00
0
$
48,00
0
$
48,00
0
$
48,00
0
$
48,00
0
$
48,00
0
Salvage
value
$
2,60,0
00
EBT
$
7,01,0
00
$
7,01,0
00
$
7,01,0
00
$
7,01,0
00
$
12,77,
000
$
12,77,
000
$
12,77,
000
$
15,37,
000
Tax
$
2,10,3
00
$
2,10,3
00
$
2,10,3
00
$
2,10,3
00
$
3,83,1
00
$
3,83,1
00
$
3,83,1
00
$
4,61,1
00
PAT
$
4,90,7
00
$
4,90,7
00
$
4,90,7
00
$
4,90,7
00
$
8,93,9
00
$
8,93,9
00
$
8,93,9
00
$
10,75,
900
Net
working
capital
$
-
50,000
$
50,00
0
Cash flow
$ -
31,40,
000
$
7,95,7
00
$
7,95,7
00
$
7,95,7
00
$
7,95,7
00
$
11,98,
900
$
11,98,
900
$
11,98,
900
$
14,30,
900
Discounting
rate 1
0.847
45762
7
0.7181
8443
0.608
63087
3
0.515
78887
5
0.437
10921
6
0.370
43153
9
0.313
92503
3
0.266
03816
4
Dis-
cashflow
$ -
31,40,
$
6,74,3
$
5,71,4
$
4,84,2
$
4,10,4
$
5,24,0
$
4,44,1
$
3,76,3
$
3,80,6
11
Appendix:
Excel Spreadsheet displaying values:
Particulars
P-REC
@18% 0 1 2 3 4 5 6 7 8
Revenue
$
28,80,
000
$
28,80,
000
$
28,80,
000
$
28,80,
000
$
36,00,
000
$
36,00,
000
$
36,00,
000
$
36,00,
000
Variable
cost
$
12,96,
000
$
12,96,
000
$
12,96,
000
$
12,96,
000
$
14,40,
000
$
14,40,
000
$
14,40,
000
$
14,40,
000
Fixed
operating
cost
$
4,70,0
00
$
4,70,0
00
$
4,70,0
00
$
4,70,0
00
$
4,70,0
00
$
4,70,0
00
$
4,70,0
00
$
4,70,0
00
Quality
assurance
inspection
$
60,00
0
$
60,000
$
60,00
0
$
60,00
0
$
60,00
0
$
60,00
0
$
60,00
0
$
60,00
0
Depreciatio
n
$
3,05,0
00
$
3,05,0
00
$
3,05,0
00
$
3,05,0
00
$
3,05,0
00
$
3,05,0
00
$
3,05,0
00
$
3,05,0
00
Loss in rent
$
48,00
0
$
48,000
$
48,00
0
$
48,00
0
$
48,00
0
$
48,00
0
$
48,00
0
$
48,00
0
Salvage
value
$
2,60,0
00
EBT
$
7,01,0
00
$
7,01,0
00
$
7,01,0
00
$
7,01,0
00
$
12,77,
000
$
12,77,
000
$
12,77,
000
$
15,37,
000
Tax
$
2,10,3
00
$
2,10,3
00
$
2,10,3
00
$
2,10,3
00
$
3,83,1
00
$
3,83,1
00
$
3,83,1
00
$
4,61,1
00
PAT
$
4,90,7
00
$
4,90,7
00
$
4,90,7
00
$
4,90,7
00
$
8,93,9
00
$
8,93,9
00
$
8,93,9
00
$
10,75,
900
Net
working
capital
$
-
50,000
$
50,00
0
Cash flow
$ -
31,40,
000
$
7,95,7
00
$
7,95,7
00
$
7,95,7
00
$
7,95,7
00
$
11,98,
900
$
11,98,
900
$
11,98,
900
$
14,30,
900
Discounting
rate 1
0.847
45762
7
0.7181
8443
0.608
63087
3
0.515
78887
5
0.437
10921
6
0.370
43153
9
0.313
92503
3
0.266
03816
4
Dis-
cashflow
$ -
31,40,
$
6,74,3
$
5,71,4
$
4,84,2
$
4,10,4
$
5,24,0
$
4,44,1
$
3,76,3
$
3,80,6
⊘ This is a preview!⊘
Do you want full access?
Subscribe today to unlock all pages.
Trusted by 1+ million students worldwide
1 out of 22
Related Documents


Your All-in-One AI-Powered Toolkit for Academic Success.
+13062052269
info@desklib.com
Available 24*7 on WhatsApp / Email
![[object Object]](/_next/static/media/star-bottom.7253800d.svg)
Unlock your academic potential
Copyright © 2020–2026 A2Z Services. All Rights Reserved. Developed and managed by ZUCOL.