Investment Management: SML vs CML - A Comparative Analysis (FIN201)
VerifiedAdded on 2023/06/12
|18
|3831
|317
Report
AI Summary
This report provides a detailed analysis of the differences between the Security Market Line (SML) and the Capital Market Line (CML) within the context of investment management. It includes graphical representations of both SML and CML, highlighting their respective limitations and applications. The report also discusses the benefits of minimum variance portfolios and explores potential vulnerabilities in the Capital Asset Pricing Model (CAPM) equations compared to other methods for determining required rates of return. Furthermore, the analysis covers real-world market conditions, the impact of transaction costs, and the role of systematic versus idiosyncratic risk in investment decisions. The report also touches on the limitations of CAPM and the factors influencing the security market line such as market risk premium, interest rates and anticipated inflation.
INVESTMENT MANAGEMENT
KING’S OWN INSTITUTE*
Success in Higher Education
INDIVIDUAL ASSIGNMENT COVERSHEET
Family Name: Given Name:
Student Number: Lecturers Name
Subject Name:
Assignment Title
Declaration
(This declaration must be completed by the student or the assignment will not be marked)
I certify the following:
I have read and understood the Student Academic Policy.
This assignment is my own work based on my personal study and research.
I have acknowledged all material and sources used in the preparation of this
assignment including any material generated in the course of my employment.
The assignment has not previously been submitted for assessment.
I have not copied in part or in whole or otherwise plagiarized the work of other
students.
I have read and I understand the criteria used for assessment.
The assignment is within the word and page limits specified in the unit outline.
The use of any a material in this assignment does not infringe the intellectual
Page 1 of 18
Paraphrase This Document
Need a fresh take? Get an instant paraphrase of this document with our AI Paraphraser

INVESTMENT MANAGEMENT
property or copyright of a third party.
I understand that this assignment may undergo electronic detection for plagiarism,
and an anonymous copy of the assignment may be retained on the database and
used to make comparisons with other assignments in future.
By completing this coversheet in full and submitting this assignment
electronically, I a bound by the conditions of the KOI’s Student Academic
Misconduct Policy and the declaration on this coversheet.
Signature Date
Assignment Receipt
Family Name: Given Name(s):
Student Number: Lecturer’s Name:
Subject Name:
Assignment Title:
Signature: Date:
Page 2 of 18
INVESTMENT MANAGEMENT
DIFFERENCE BETWEEN SECURITY MARKET LINE AND CAPITAL MARKET LINE.
STUDENT NAME
SUBJECT TITLE
SUBJECT CODE
TRIMESTER NUMBER
KOI STUDENT NUMBER
TUTOR’S NAME
WORD COUNT
DATE
Page 3 of 18
DIFFERENCE BETWEEN SECURITY MARKET LINE AND CAPITAL MARKET LINE.
STUDENT NAME
SUBJECT TITLE
SUBJECT CODE
TRIMESTER NUMBER
KOI STUDENT NUMBER
TUTOR’S NAME
WORD COUNT
DATE
Page 3 of 18
⊘ This is a preview!⊘
Do you want full access?
Subscribe today to unlock all pages.
Trusted by 1+ million students worldwide
INVESTMENT MANAGEMENT
Table of Content
s
EXECUTIVE SUMMARY.............................................................................................................5
INTRODUCTION...........................................................................................................................6
DISPLAY OF CML AND SML GRAPHS.....................................................................................7
Capital Market Line Graph..........................................................................................................7
Limitation usage...........................................................................................................................7
Security Market Line Graph........................................................................................................8
Limitations of usage...................................................................................................................10
CONCLUSION..............................................................................................................................12
RECOMMENDATIONS...............................................................................................................13
REFERENCES..............................................................................................................................14
FIN201 – Investment Management – T118 – Individual Assignment – Due Week 10 -
Assessment Marking Rubric..........................................................................................................18
Page 4 of 18
Paraphrase This Document
Need a fresh take? Get an instant paraphrase of this document with our AI Paraphraser
INVESTMENT MANAGEMENT
EXECUTIVE SUMMARY
This work is of my own research and knowledge impacted in me during my lecture
sessions. Therefore, the work explains on the differences on Security Market Line and Capital
Market Line, the benefits of minimum variance portfolios, and why CAPM equations might be
more vulnerable compared to other equations. There is also graphs of Security Market Line and
Capital Market Line that show and elaborate further on the difference between the two lines of
market.
Page 5 of 18
INVESTMENT MANAGEMENT
INVESTMENT MANAGEMENT
Introduction
The capital marketplace is a connect that depicts the rates of return. These rates of return
are influenced by the ranks of peril for a precise collection as well as the risk-free rates of return.
Security market line is thus defined as a distinctive route which is simply a graphical illustration
of market’s peril and return at a certain time. Therefore this paper will critically explain on the
variances between Capital market line and Security market line. Additionally, there is the
presentation of the benefits of the minimum variance portfolios while showing why CAPM
reckoning might be more vulnerable as compared to other reckonings with regards to the
required rate of return (Ahmed & Zlate, 2014).
It’s quite clear that Capital market Line graphs depict the competent collections the
Safety market track graphs show mutually competent and incompetent collections. The
collection for Capital Market Line is exposed laterally on the Y- axis when yields are
manipulated. In this case, it is divergent for Security Market Line. This manipulation also leads
to the reappearance of the securities which are lateral on the Y-axis. Collection deviance is
observed on the X-axis for Capital Market Line. The Beta of safety is displayed laterally on the
X-axis for Security Market Line (Khan et, 2011).
The determination of the market collection and hazard free properties by the Capital
Market Line is a matter of safety which is dogged by the Safety Market Line.
The Security Market Line and the Capital Market Line show the potential yields as indicated by
the properties of individuals. As such, the Capital Market Line displays reoccurrence for the
definitively competent collections. On the other hand, the Security Market Line is a validation of
the reoccurrence for the stocks that belong to individuals. It can be concluded that the Capital
Page 6 of 18
⊘ This is a preview!⊘
Do you want full access?
Subscribe today to unlock all pages.
Trusted by 1+ million students worldwide
INVESTMENT MANAGEMENT
Market Line is the best means for risk issues determination (Anbar & Alper, 2011).
DISPLAY OF CML AND SML GRAPHS
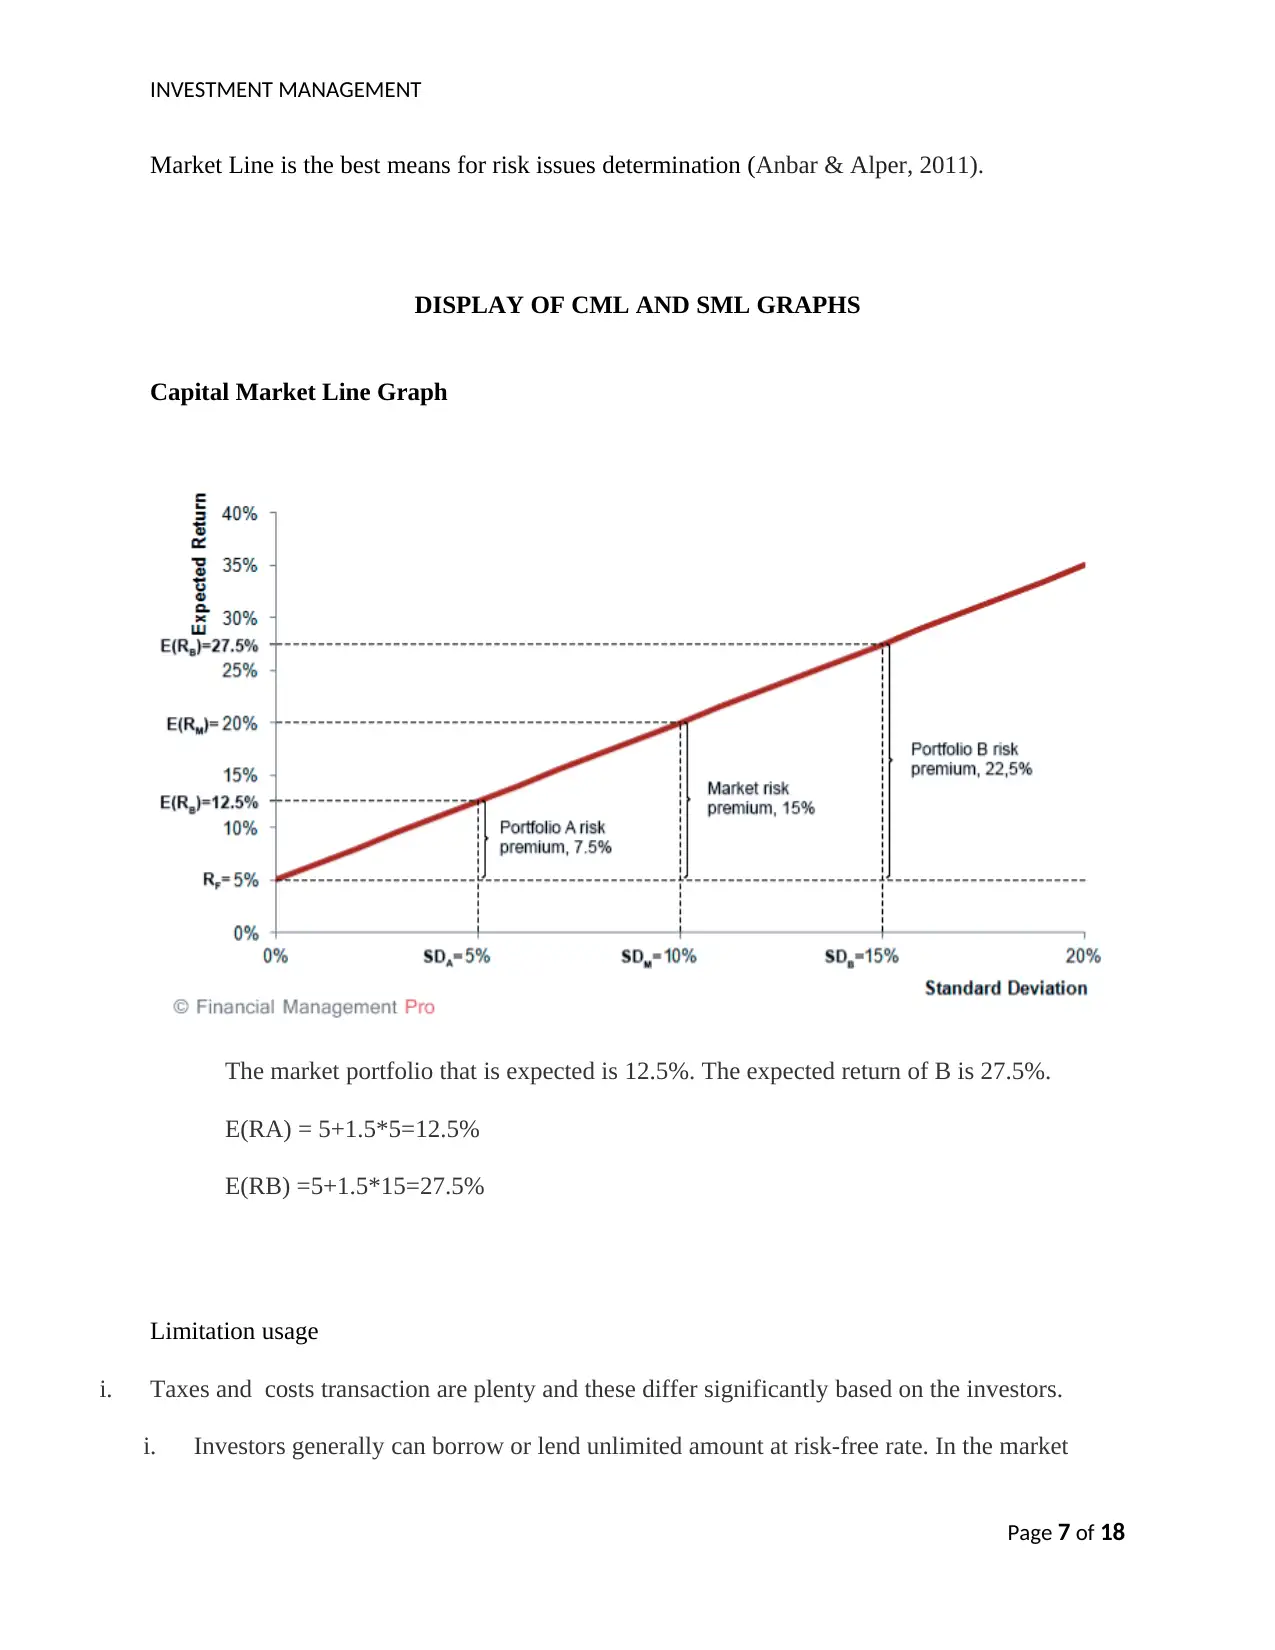
Capital Market Line Graph
The market portfolio that is expected is 12.5%. The expected return of B is 27.5%.
E(RA) = 5+1.5*5=12.5%
E(RB) =5+1.5*15=27.5%
Limitation usage
i. Taxes and costs transaction are plenty and these differ significantly based on the investors.
i. Investors generally can borrow or lend unlimited amount at risk-free rate. In the market
Page 7 of 18
Market Line is the best means for risk issues determination (Anbar & Alper, 2011).
DISPLAY OF CML AND SML GRAPHS
Capital Market Line Graph
The market portfolio that is expected is 12.5%. The expected return of B is 27.5%.
E(RA) = 5+1.5*5=12.5%
E(RB) =5+1.5*15=27.5%
Limitation usage
i. Taxes and costs transaction are plenty and these differ significantly based on the investors.
i. Investors generally can borrow or lend unlimited amount at risk-free rate. In the market
Page 7 of 18
Paraphrase This Document
Need a fresh take? Get an instant paraphrase of this document with our AI Paraphraser
INVESTMENT MANAGEMENT
conditions on the ground investors can lend at substantially lower rates than when
borrowing. This brings a bend of CML. A strong form of efficiency is not evident in real
markets. This means that investors have unequal access to information.
ii. A strong form of efficiency is evident in the real markets. This means that investors have
unequal access to information.
iii. Investors are not necessarily fully rational and risk-averse.
iv. The real markets are impacted by risks of inflation, currency and reinvestment risk.
Standard deviation is one of the risk measurements that are utilized. .
v. Risk-free assets are generally not available.
The end result is a representation of CML in real market is in form of a fuzzy area (Huarng &
Yu, 2006).
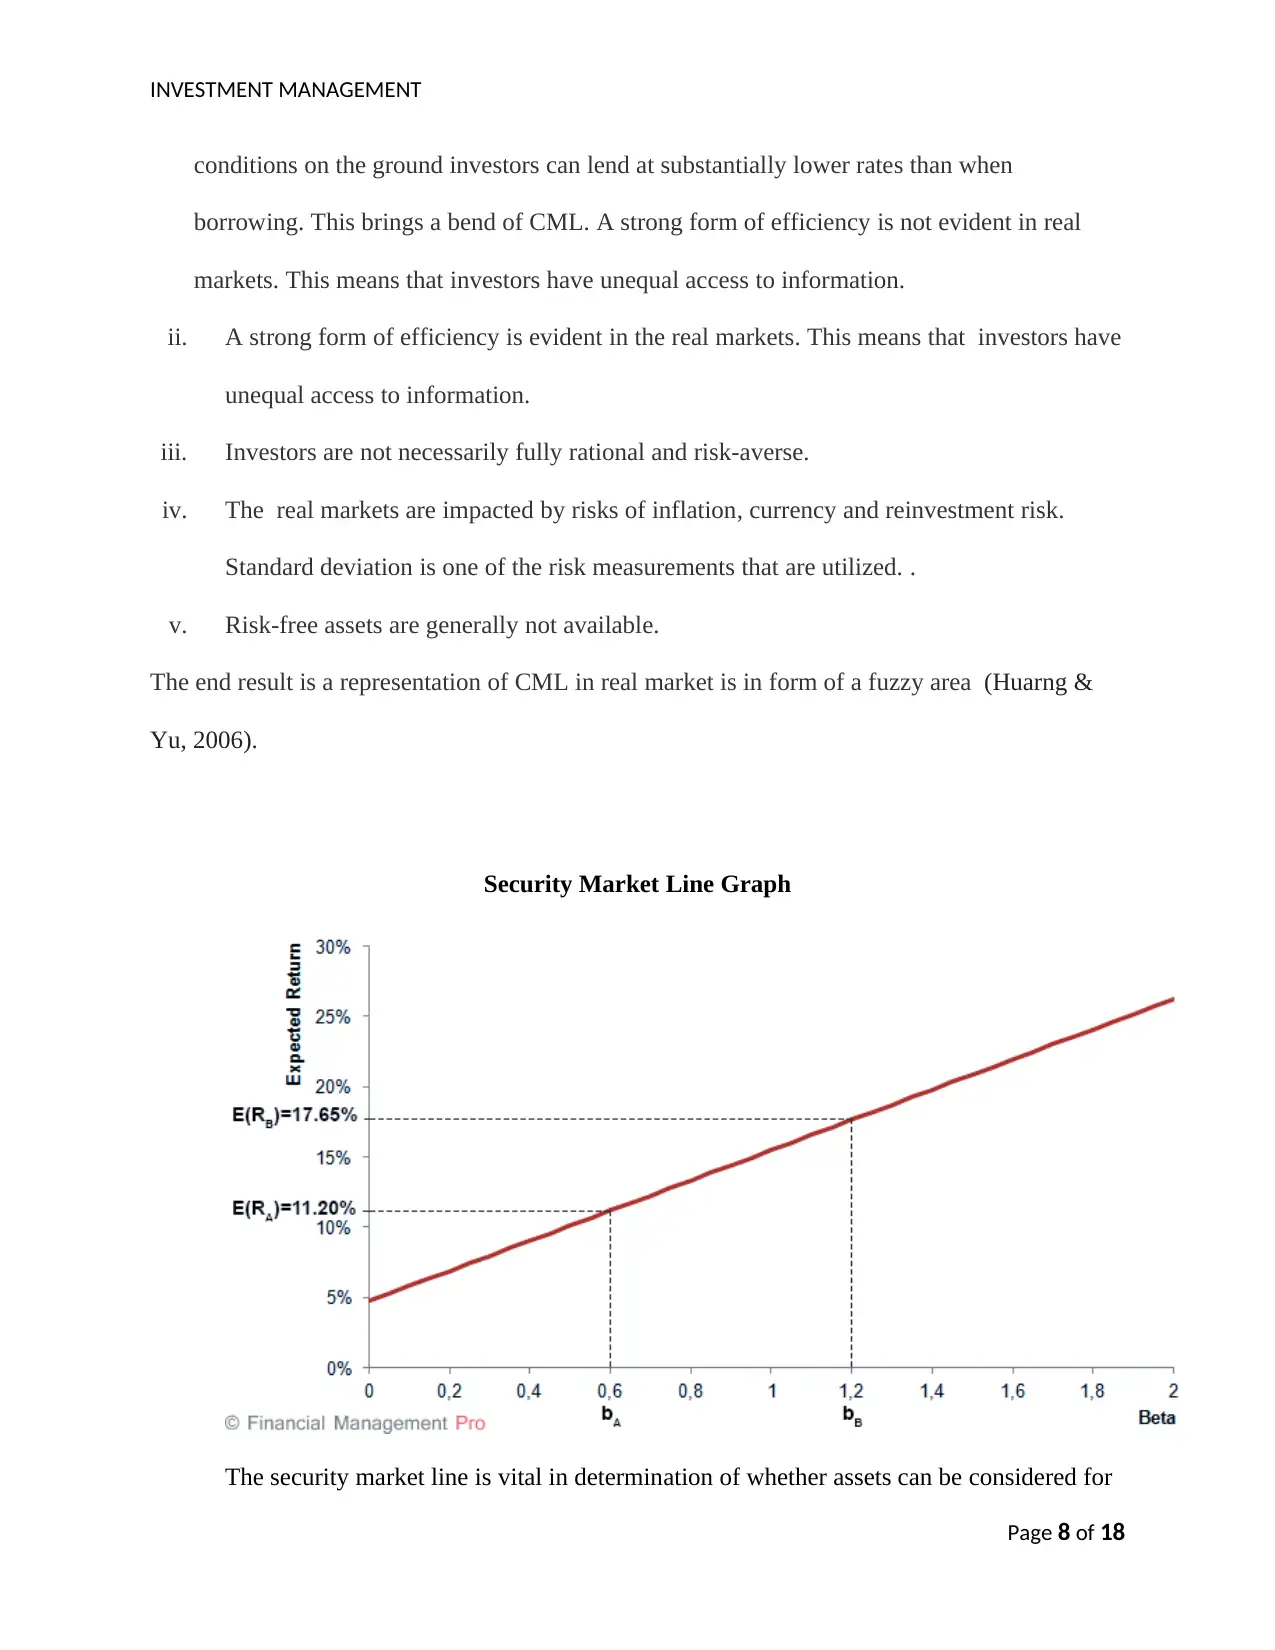
Security Market Line Graph
The security market line is vital in determination of whether assets can be considered for
Page 8 of 18
conditions on the ground investors can lend at substantially lower rates than when
borrowing. This brings a bend of CML. A strong form of efficiency is not evident in real
markets. This means that investors have unequal access to information.
ii. A strong form of efficiency is evident in the real markets. This means that investors have
unequal access to information.
iii. Investors are not necessarily fully rational and risk-averse.
iv. The real markets are impacted by risks of inflation, currency and reinvestment risk.
Standard deviation is one of the risk measurements that are utilized. .
v. Risk-free assets are generally not available.
The end result is a representation of CML in real market is in form of a fuzzy area (Huarng &
Yu, 2006).
Security Market Line Graph
The security market line is vital in determination of whether assets can be considered for
Page 8 of 18
INVESTMENT MANAGEMENT
a portfolio. This offers a basis for the return for risk. Individual securities are indicated on the
SML graph. The plotting of security risk against the expected return above the SML indicates
undervaluing as the investor gets to expect a larger return for the risk which is inherent. A
security below the SML shows overvalue. This is because the investor may be willing to accept a
lesser return for the amount of risk that is assumed (Maringer, 2006). The values expected for the
SML can be calculated with the following equation:
Es = rf + Bs(Emkt - rf)
The sensitive part of the investment to the portfolio is the beta. In isolation, a project can
be considered riskier than the risk situation profile of a company. The risk profile can be
accounted for through use of SML in calculation of the WCCC of a company (Vafeas et al,
2008).
Example:
When a new product line for Newco is considered, the project's beta is 1.5. Assuming the risk-
free rate is 4% and the expected return on the market is 12%, compute the cost of equity for the
new product line.
Answer:
Cost of equity = rf + Bs(Emkt - rf) = 4% + 1.5(12% - 4%) = 16%
The project's required return on retained earnings is therefore 16%, a number which should be
used in our calculation of weighted average cost of capital (WACC) (Yang et al, 2003).
The x-axis of the Security Market Line diagram is defined by the beta while the y-axis is
Page 9 of 18
⊘ This is a preview!⊘
Do you want full access?
Subscribe today to unlock all pages.
Trusted by 1+ million students worldwide
INVESTMENT MANAGEMENT
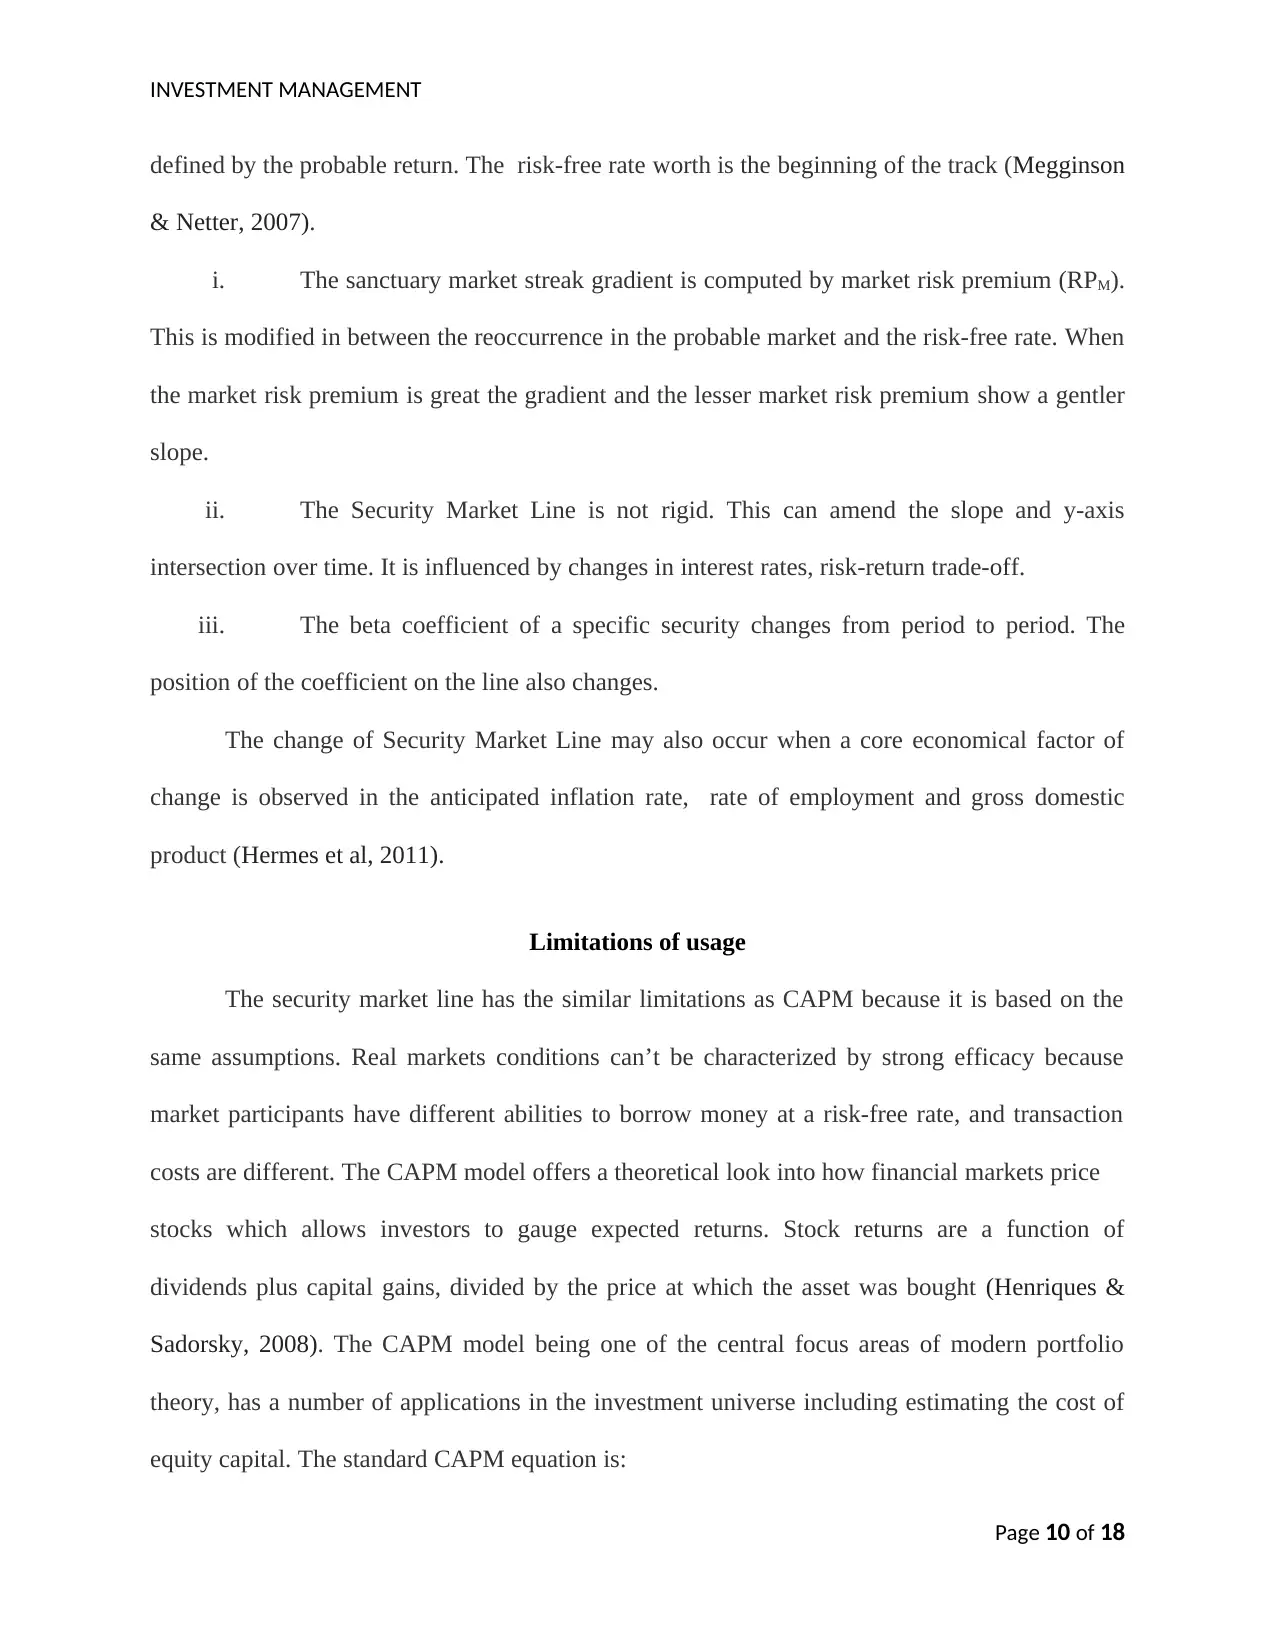
defined by the probable return. The risk-free rate worth is the beginning of the track (Megginson
& Netter, 2007).
i. The sanctuary market streak gradient is computed by market risk premium (RPM).
This is modified in between the reoccurrence in the probable market and the risk-free rate. When
the market risk premium is great the gradient and the lesser market risk premium show a gentler
slope.
ii. The Security Market Line is not rigid. This can amend the slope and y-axis
intersection over time. It is influenced by changes in interest rates, risk-return trade-off.
iii. The beta coefficient of a specific security changes from period to period. The
position of the coefficient on the line also changes.
The change of Security Market Line may also occur when a core economical factor of
change is observed in the anticipated inflation rate, rate of employment and gross domestic
product (Hermes et al, 2011).
Limitations of usage
The security market line has the similar limitations as CAPM because it is based on the
same assumptions. Real markets conditions can’t be characterized by strong efficacy because
market participants have different abilities to borrow money at a risk-free rate, and transaction
costs are different. The CAPM model offers a theoretical look into how financial markets price
stocks which allows investors to gauge expected returns. Stock returns are a function of
dividends plus capital gains, divided by the price at which the asset was bought (Henriques &
Sadorsky, 2008). The CAPM model being one of the central focus areas of modern portfolio
theory, has a number of applications in the investment universe including estimating the cost of
equity capital. The standard CAPM equation is:
Page 10 of 18
Paraphrase This Document
Need a fresh take? Get an instant paraphrase of this document with our AI Paraphraser
INVESTMENT MANAGEMENT
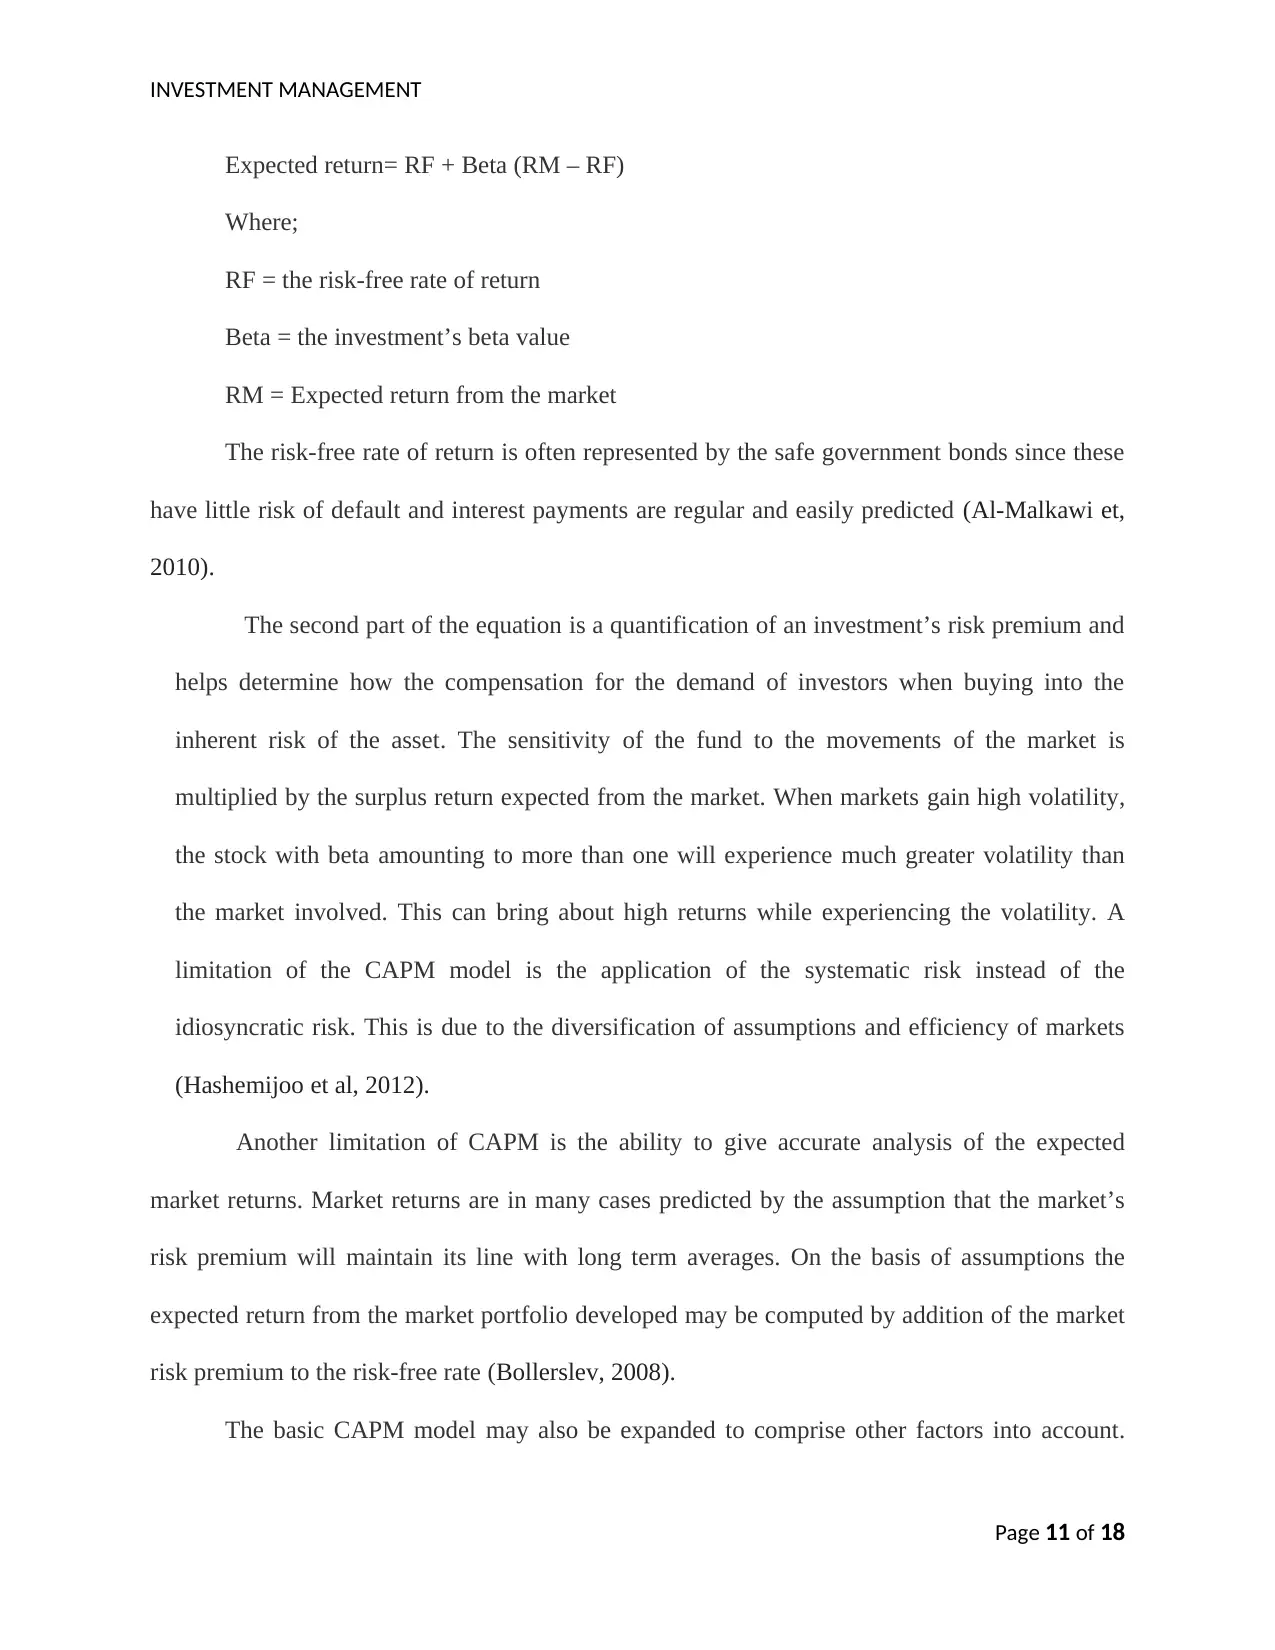
Expected return= RF + Beta (RM – RF)
Where;
RF = the risk-free rate of return
Beta = the investment’s beta value
RM = Expected return from the market
The risk-free rate of return is often represented by the safe government bonds since these
have little risk of default and interest payments are regular and easily predicted (Al-Malkawi et,
2010).
The second part of the equation is a quantification of an investment’s risk premium and
helps determine how the compensation for the demand of investors when buying into the
inherent risk of the asset. The sensitivity of the fund to the movements of the market is
multiplied by the surplus return expected from the market. When markets gain high volatility,
the stock with beta amounting to more than one will experience much greater volatility than
the market involved. This can bring about high returns while experiencing the volatility. A
limitation of the CAPM model is the application of the systematic risk instead of the
idiosyncratic risk. This is due to the diversification of assumptions and efficiency of markets
(Hashemijoo et al, 2012).
Another limitation of CAPM is the ability to give accurate analysis of the expected
market returns. Market returns are in many cases predicted by the assumption that the market’s
risk premium will maintain its line with long term averages. On the basis of assumptions the
expected return from the market portfolio developed may be computed by addition of the market
risk premium to the risk-free rate (Bollerslev, 2008).
The basic CAPM model may also be expanded to comprise other factors into account.
Page 11 of 18
INVESTMENT MANAGEMENT
This provides a more complex forecast of expected returns. There are a number of CAPM
variations which have been established in the recent past. There are several other financial
models which utilize CAPM in calculation of the risk-return ratios. On the other hand, CAPM
equation is crucial in reaching the expected asset return as the returns. This is from a risk free
investment with the addition of risk premium. This is multiplied by the beta value of the
investment. The capital asset pricing model is financial tool that is vital for investors to
determine the price of an investment. This is based on the expected return metrics and its risk.
Despite the limitations CAPM also displays significant advantages. This include the
following;-
Ease-of-use: CAPM can be tested to achieve a range of potential outcomes which
provide confidence as concerns the relevant rates of return.
Portfolio is varied: The investors have a diversified portfolio which differ from
the market portfolio. This subsequently lowers unsystematic risk.
Systematic Risk (beta): CAPM accounts for the systematic risk. This is left out of
other return models. Case in point, the dividend discount model (DDM). Systematic or market
risk is a critical variable as it is not foreseen. This, in many situations, cannot be fully mitigated.
The prime reason is that it is often not fully expected.
Minimum variance portfolio refers to security portfolios which combine to lessen the
price volatility of the overall portfolio. Volatility in the community of investment is a measure of
a specific price movement security. Hence, the greater the volatility of a particular investment
the higher the market risk (Naceur et al, 2006).
CONCLUSION
In conclusion, we can evidently say that capital market line model is the best model to
Page 12 of 18
⊘ This is a preview!⊘
Do you want full access?
Subscribe today to unlock all pages.
Trusted by 1+ million students worldwide
1 out of 18
Related Documents


Your All-in-One AI-Powered Toolkit for Academic Success.
+13062052269
info@desklib.com
Available 24*7 on WhatsApp / Email
![[object Object]](/_next/static/media/star-bottom.7253800d.svg)
Unlock your academic potential
Copyright © 2020–2026 A2Z Services. All Rights Reserved. Developed and managed by ZUCOL.