FIN203 Project: Analyzing Financial Stocks & Capital Budgeting
VerifiedAdded on 2023/06/07
|13
|3911
|373
Report
AI Summary
This report provides a comprehensive analysis of the financial instruments of AMP Limited and Commonwealth Bank (CBA), focusing on their stock price trends over the past five years and the impact of the Royal Commission on market and firm-specific risks. It also delves into capital budgeting techniques, specifically the Net Present Value (NPV) and Internal Rate of Return (IRR) methods, in the context of Henry Property Limited, offering recommendations based on these evaluations. The analysis incorporates stock price charts to illustrate the volatility and trends of AMP and CBA, examining factors influencing these movements, such as financial health and regulatory scrutiny. The report concludes with insights into the implications of the Royal Commission's findings on the financial sector and the importance of capital budgeting in making informed investment decisions.
Running head: BANKING AND FINANCE
Banking and Finance
Name of the Student:
Name of the University:
Author’s Note:
Course ID:
Banking and Finance
Name of the Student:
Name of the University:
Author’s Note:
Course ID:
Paraphrase This Document
Need a fresh take? Get an instant paraphrase of this document with our AI Paraphraser
1BANKING AND FINANCE
Table of Contents
Introduction:...............................................................................................................................2
Research (a literature survey):...................................................................................................2
Analysis:.....................................................................................................................................3
Part A: AMP and CBA share price........................................................................................3
Part B: Capital budgeting:......................................................................................................6
Recommendations:...................................................................................................................10
Conclusion:..............................................................................................................................10
References:...............................................................................................................................11
2BANKING AND FINANCE
Introduction:
The current paper would investigate the financial instruments of the two popular
banks operating in the Australian banking industry. These two banks include AMP Limited
and Commonwealth Bank (CBA). Firstly, it would intend to discuss the trend and evolution
of the current stock price of the banks over the past five years. Secondly, the essay would
focus on the ways through which the Royal Commission is inquiring into the activities of the
Australian financial institutions and their effects on market and firm-specific risks. The
second part of this essay would shed light on the capital budgeting techniques in the context
of Henry Property Limited. For this organisation, the two chosen capital budgeting
techniques include net present value (NPV) method and internal rate of return (IRR) method
based on which recommendations would be provided.
Research (a literature survey):
Resiliency could be observed in the Australian financial system and this has assisted
to deal with any adverse shocks. The capital levels of the financial institutions are quite above
the existing regulatory minimums and the increasing profit levels have further boosted their
capital (Reserve Bank of Australia 2018). Even though the trend of net interest margins is
lower, they are broadening now with the improvement in funding conditions and the impact
of current loan repricing is recognised. The rise in capital of the banks over the recent time
has increased their resiliency with a lowering return on equity. However, the investors still
expect equivalent returns to those obtained a decade back. Such tension could motivate the
financial institutions to obtain greater returns by accepting additional risks. This is the
primary reason that the regulators have raised their concentration on the risk culture of the
financial institutions and the sector is undertaking moves so that their approach to various
risks is strengthened.
As commented by Almazan, Chen and Titman (2017), capital budgeting could be
defined as a procedure where an organisation ascertains and analyses potential big
investments or expenses. Such investments and expenses might be projects like establishment
of a new plant or investment in any long-term venture. Primarily, all organisations need to
pursue all opportunities and projects, which increase shareholders’ wealth. However, due to
the limited availability of funds for new projects, it is crucial to use capital budgeting
methods for ascertaining the most profitable projects. Some of the significant capital
⊘ This is a preview!⊘
Do you want full access?
Subscribe today to unlock all pages.
Trusted by 1+ million students worldwide
3BANKING AND FINANCE
budgeting methods include net present value, internal rate of return, payback period,
accounting rate of return, profitability index and others.
Analysis:
Part A: AMP and CBA share price
01/06/2014
01/08/2014
01/10/2014
01/12/2014
01/02/2015
01/04/2015
01/06/2015
01/08/2015
01/10/2015
01/12/2015
01/02/2016
01/04/2016
01/06/2016
01/08/2016
01/10/2016
01/12/2016
01/02/2017
01/04/2017
01/06/2017
01/08/2017
01/10/2017
01/12/2017
01/02/2018
01/04/2018
01/06/2018
$-
$1.00
$2.00
$3.00
$4.00
$5.00
$6.00
$7.00
$8.00
Share price of AMP for the past five years
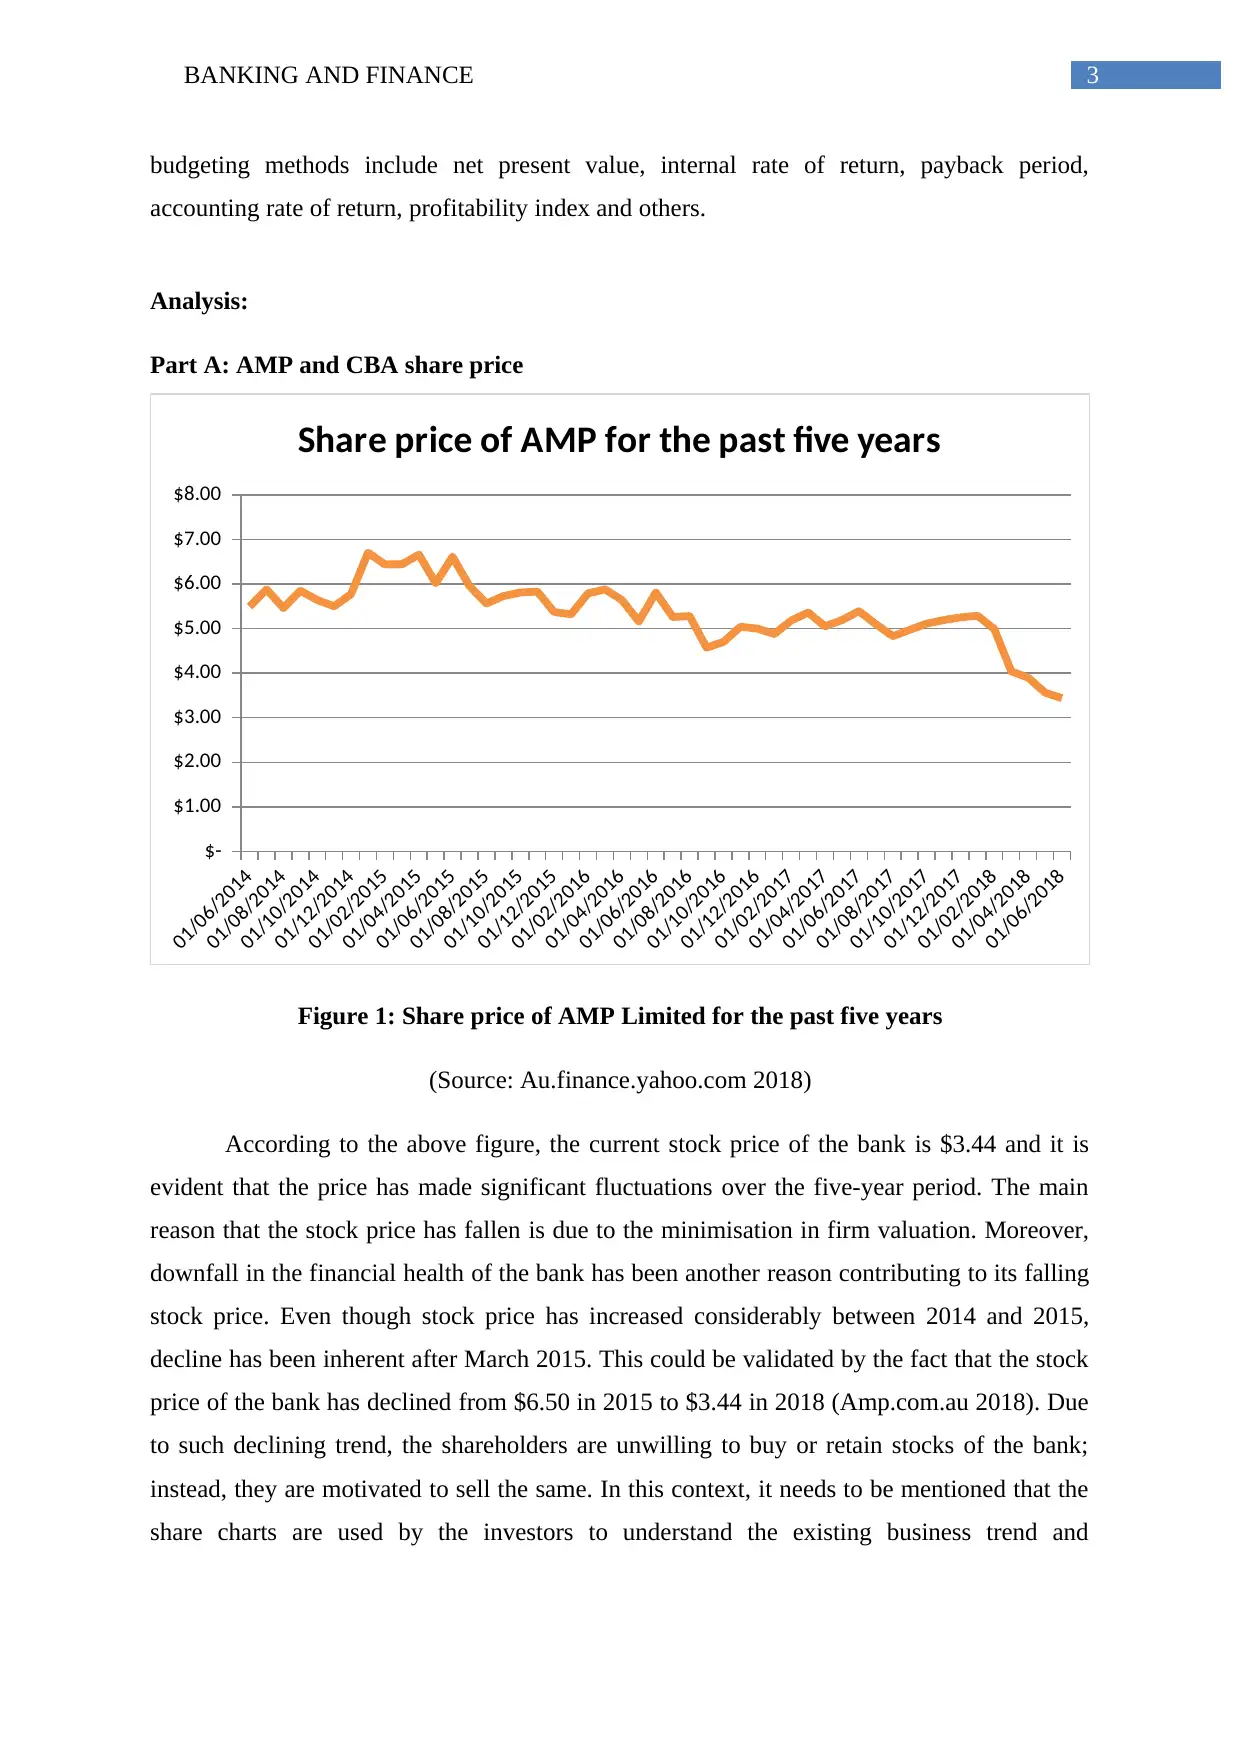
Figure 1: Share price of AMP Limited for the past five years
(Source: Au.finance.yahoo.com 2018)
According to the above figure, the current stock price of the bank is $3.44 and it is
evident that the price has made significant fluctuations over the five-year period. The main
reason that the stock price has fallen is due to the minimisation in firm valuation. Moreover,
downfall in the financial health of the bank has been another reason contributing to its falling
stock price. Even though stock price has increased considerably between 2014 and 2015,
decline has been inherent after March 2015. This could be validated by the fact that the stock
price of the bank has declined from $6.50 in 2015 to $3.44 in 2018 (Amp.com.au 2018). Due
to such declining trend, the shareholders are unwilling to buy or retain stocks of the bank;
instead, they are motivated to sell the same. In this context, it needs to be mentioned that the
share charts are used by the investors to understand the existing business trend and
budgeting methods include net present value, internal rate of return, payback period,
accounting rate of return, profitability index and others.
Analysis:
Part A: AMP and CBA share price
01/06/2014
01/08/2014
01/10/2014
01/12/2014
01/02/2015
01/04/2015
01/06/2015
01/08/2015
01/10/2015
01/12/2015
01/02/2016
01/04/2016
01/06/2016
01/08/2016
01/10/2016
01/12/2016
01/02/2017
01/04/2017
01/06/2017
01/08/2017
01/10/2017
01/12/2017
01/02/2018
01/04/2018
01/06/2018
$-
$1.00
$2.00
$3.00
$4.00
$5.00
$6.00
$7.00
$8.00
Share price of AMP for the past five years
Figure 1: Share price of AMP Limited for the past five years
(Source: Au.finance.yahoo.com 2018)
According to the above figure, the current stock price of the bank is $3.44 and it is
evident that the price has made significant fluctuations over the five-year period. The main
reason that the stock price has fallen is due to the minimisation in firm valuation. Moreover,
downfall in the financial health of the bank has been another reason contributing to its falling
stock price. Even though stock price has increased considerably between 2014 and 2015,
decline has been inherent after March 2015. This could be validated by the fact that the stock
price of the bank has declined from $6.50 in 2015 to $3.44 in 2018 (Amp.com.au 2018). Due
to such declining trend, the shareholders are unwilling to buy or retain stocks of the bank;
instead, they are motivated to sell the same. In this context, it needs to be mentioned that the
share charts are used by the investors to understand the existing business trend and
Paraphrase This Document
Need a fresh take? Get an instant paraphrase of this document with our AI Paraphraser
4BANKING AND FINANCE
accordingly, they assess whether they could generate adequate returns from investment
(Viney and Phillips 2015).
01/06/2014
01/08/2014
01/10/2014
01/12/2014
01/02/2015
01/04/2015
01/06/2015
01/08/2015
01/10/2015
01/12/2015
01/02/2016
01/04/2016
01/06/2016
01/08/2016
01/10/2016
01/12/2016
01/02/2017
01/04/2017
01/06/2017
01/08/2017
01/10/2017
01/12/2017
01/02/2018
01/04/2018
01/06/2018
$-
$10.00
$20.00
$30.00
$40.00
$50.00
$60.00
$70.00
$80.00
$90.00
$100.00
Share price of CBA for the past five years
Figure 2: Share price of CBA for the past five years
(Source: Au.finance.yahoo.com 2018)
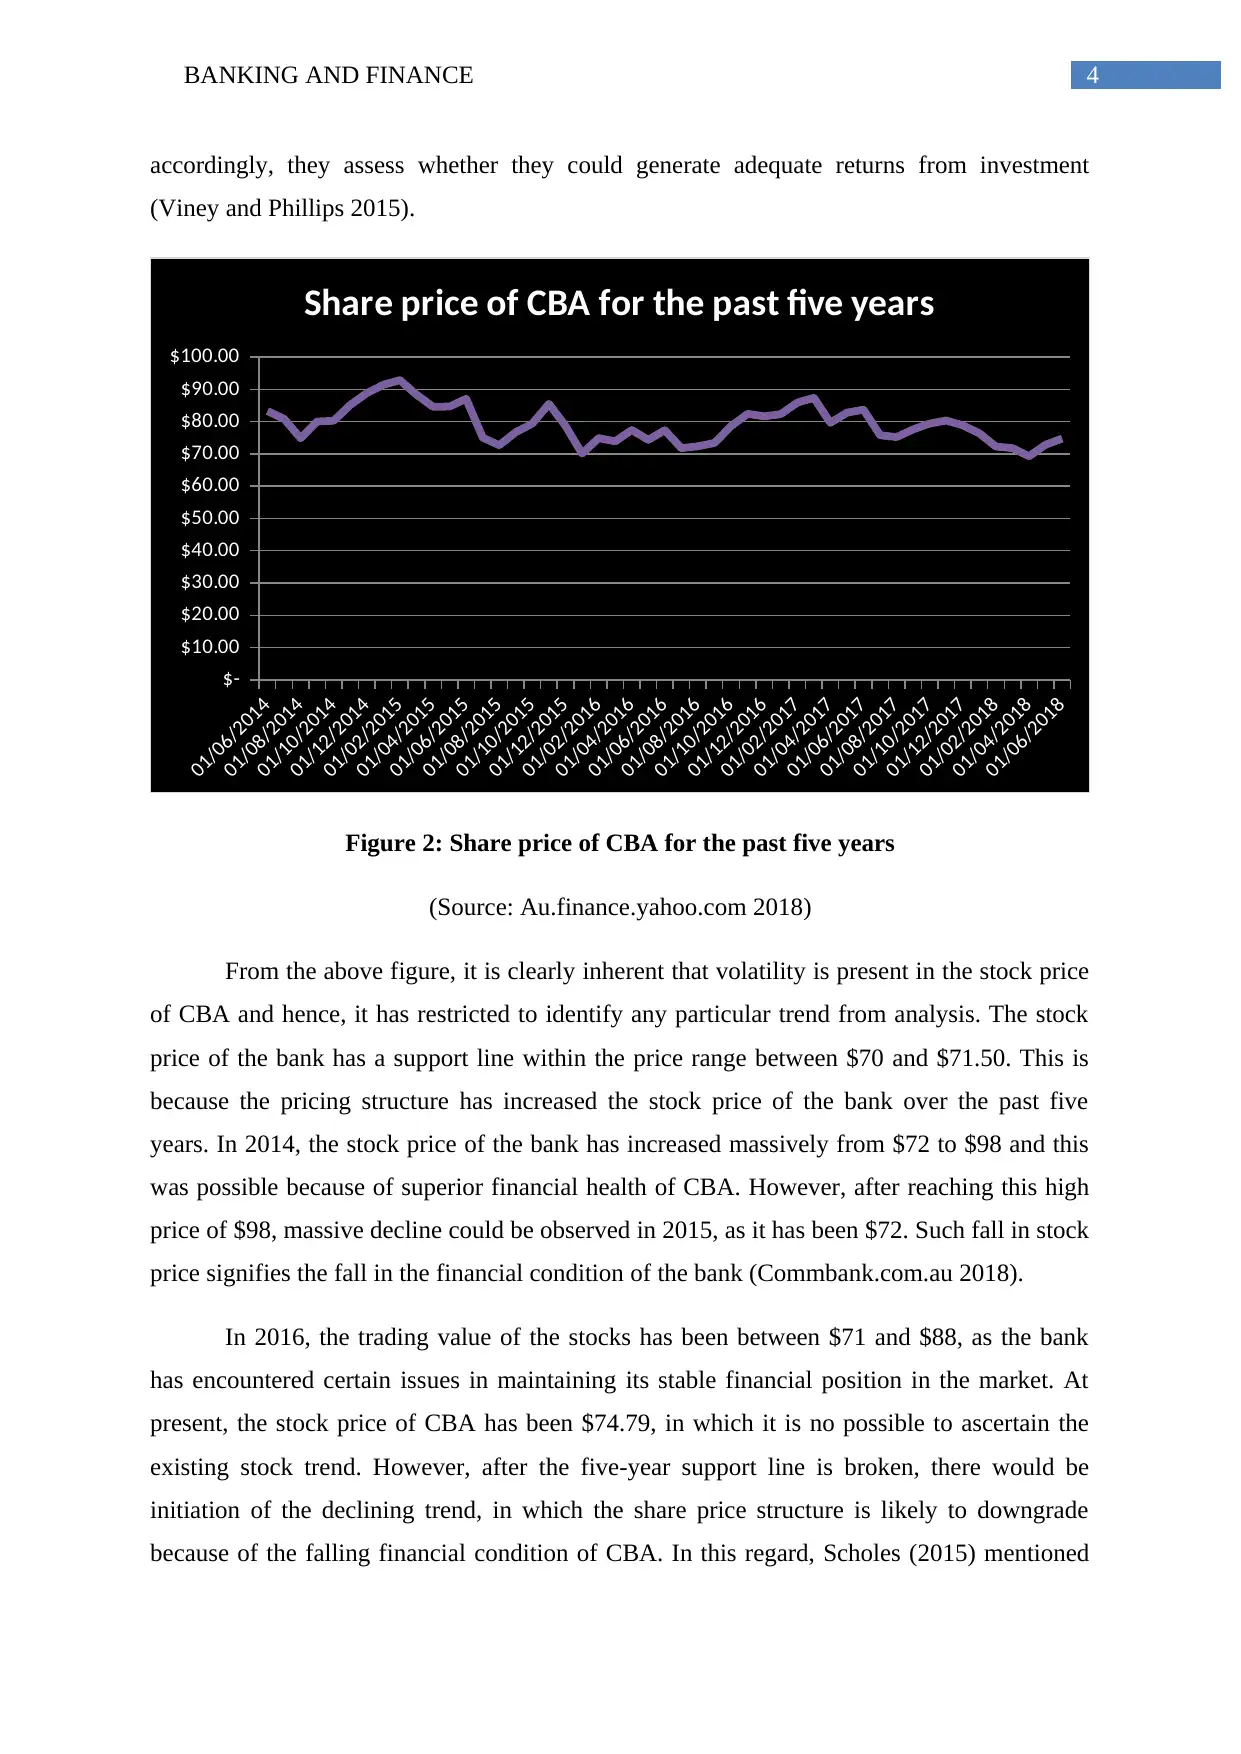
From the above figure, it is clearly inherent that volatility is present in the stock price
of CBA and hence, it has restricted to identify any particular trend from analysis. The stock
price of the bank has a support line within the price range between $70 and $71.50. This is
because the pricing structure has increased the stock price of the bank over the past five
years. In 2014, the stock price of the bank has increased massively from $72 to $98 and this
was possible because of superior financial health of CBA. However, after reaching this high
price of $98, massive decline could be observed in 2015, as it has been $72. Such fall in stock
price signifies the fall in the financial condition of the bank (Commbank.com.au 2018).
In 2016, the trading value of the stocks has been between $71 and $88, as the bank
has encountered certain issues in maintaining its stable financial position in the market. At
present, the stock price of CBA has been $74.79, in which it is no possible to ascertain the
existing stock trend. However, after the five-year support line is broken, there would be
initiation of the declining trend, in which the share price structure is likely to downgrade
because of the falling financial condition of CBA. In this regard, Scholes (2015) mentioned
accordingly, they assess whether they could generate adequate returns from investment
(Viney and Phillips 2015).
01/06/2014
01/08/2014
01/10/2014
01/12/2014
01/02/2015
01/04/2015
01/06/2015
01/08/2015
01/10/2015
01/12/2015
01/02/2016
01/04/2016
01/06/2016
01/08/2016
01/10/2016
01/12/2016
01/02/2017
01/04/2017
01/06/2017
01/08/2017
01/10/2017
01/12/2017
01/02/2018
01/04/2018
01/06/2018
$-
$10.00
$20.00
$30.00
$40.00
$50.00
$60.00
$70.00
$80.00
$90.00
$100.00
Share price of CBA for the past five years
Figure 2: Share price of CBA for the past five years
(Source: Au.finance.yahoo.com 2018)
From the above figure, it is clearly inherent that volatility is present in the stock price
of CBA and hence, it has restricted to identify any particular trend from analysis. The stock
price of the bank has a support line within the price range between $70 and $71.50. This is
because the pricing structure has increased the stock price of the bank over the past five
years. In 2014, the stock price of the bank has increased massively from $72 to $98 and this
was possible because of superior financial health of CBA. However, after reaching this high
price of $98, massive decline could be observed in 2015, as it has been $72. Such fall in stock
price signifies the fall in the financial condition of the bank (Commbank.com.au 2018).
In 2016, the trading value of the stocks has been between $71 and $88, as the bank
has encountered certain issues in maintaining its stable financial position in the market. At
present, the stock price of CBA has been $74.79, in which it is no possible to ascertain the
existing stock trend. However, after the five-year support line is broken, there would be
initiation of the declining trend, in which the share price structure is likely to downgrade
because of the falling financial condition of CBA. In this regard, Scholes (2015) mentioned
5BANKING AND FINANCE
that with the help of technical analysis, the investors could gain insight regarding the
investment opportunities apparent within the stocks and such information assists in
maximising their earning levels from investments.
The regulators of Australia have appointed the Royal Commission, which have direct
effect on the existing operations of the Australian financial institutions. The reason behind the
appointment of this commission is to assess the misconduct in superannuation, banking and
financial services sectors functioning in the nation. Thus, this commission would detect the
deficiencies evident in the existing operations of the financial companies. This has direct
impact on systematic risk as well as unsystematic risk of these organisations, since the
investors are worried about the illicit practices apparent in the same. Hence, the investment-
related systematic risk and unsystematic risk is increased and this might lead to lower returns
on investment for the investors. Moreover, different unethical measures of the management
increase both systematic and unsystematic risks (Bikker and Spierdijk 2017).
There is increase in market risk due to the uncertainty within the investors. The Royal
Commission is involved in assessing the four big banks in Australia that increase the
investors’ concern along with highlighting the unethical practices adopted by the
management of each bank. Moreover, increase in firm-specific risk is evident as well and
adverse impact is deemed to be observed on the livelihoods of the citizens. The Governor
General of Commonwealth has developed the Royal Commission so that the malpractices of
the financial services sector could be revealed, as they have negative impact on the lives of
the citizens. When the malpractices of the organisations operating in the above-stated sector
are revealed, it would lead to rise in both systematic risk and unsystematic risk (Williams
2017).
After the appointment of Royal Commission, there is decline in stock prices of both
AMP and CBA, since pertinent news about the manipulation of the financial organisations
are revealed on the part of the commission. The Royal Commission has unfolded the scandal
associated with AMP’s operations, in which the bank was charging more fees for its super
accounts. This has highlighted the deficiencies of the bank management, in which AMP has
to incur $5 million to 50,000 fund members of superannuation as compensation. This has
negatively affected the stock price of the bank due to the identification of fraudulent
activities. This signifies the fall in the stock price of AMP starting from February 2018 after
the Royal Commission has revealed the news (Asx.com.au 2018).
⊘ This is a preview!⊘
Do you want full access?
Subscribe today to unlock all pages.
Trusted by 1+ million students worldwide
6BANKING AND FINANCE
Moreover, the commission has revealed the criminal offences that happened in CBA.
The bank has conducted various unethical measures, which was disclosed by the Royal
Commission. Moreover, the commission would disclose future reports regarding the bank
necessary for revealing the unscrupulous practices of CBA.
Part B: Capital budgeting:
This sections deals with evaluating the two project proposals for Henry Property
Limited, in which the difference between required rate of return and internal rate has been
evaluated. Various differences are inherent between internal rate of return and required rate
of return based on their usage level, which an organisation uses in obtaining the financial
importance of any project or investment. As laid out by Andor, Mohanty and Toth (2015),
IRR is deemed to be one of the significant elements of the capital budgeting methods, which
the organisations use for evaluating the future earnings of their projects. The key differences
between the two concepts could be listed down under:
The basic difference between these two concepts is related to usage, which is
necessary for an organisation to analyse for obtaining the accurate income. IRR is
calculated to ascertain the minimum return level to be provided by the project in its
economic life. On the contrary, required rate of return is the minimum return level
necessary for carrying out any particular project (De Andrés, De Fuente and San
Martín 2015).
Another difference between the two concepts is observed in terms of ascertaining the
financial feasibility of a project. The calculation of net present value needs
consideration of required rate of return for signifying the financial performance
associated with the project. Moreover, consideration of time value of money is made
in required rate of return and thus, it plays a crucial role in ascertaining the present
value of future cash flows. However, a project could only be accepted, if IRR exceeds
the required rate of return (Johnson, Pfeiffer and Schneider 2017).
For evaluating the feasibility of the two proposed projects, X and Y, the NPV
technique is used and its detailed evaluation for Project X is provided as follows:
Paraphrase This Document
Need a fresh take? Get an instant paraphrase of this document with our AI Paraphraser
7BANKING AND FINANCE
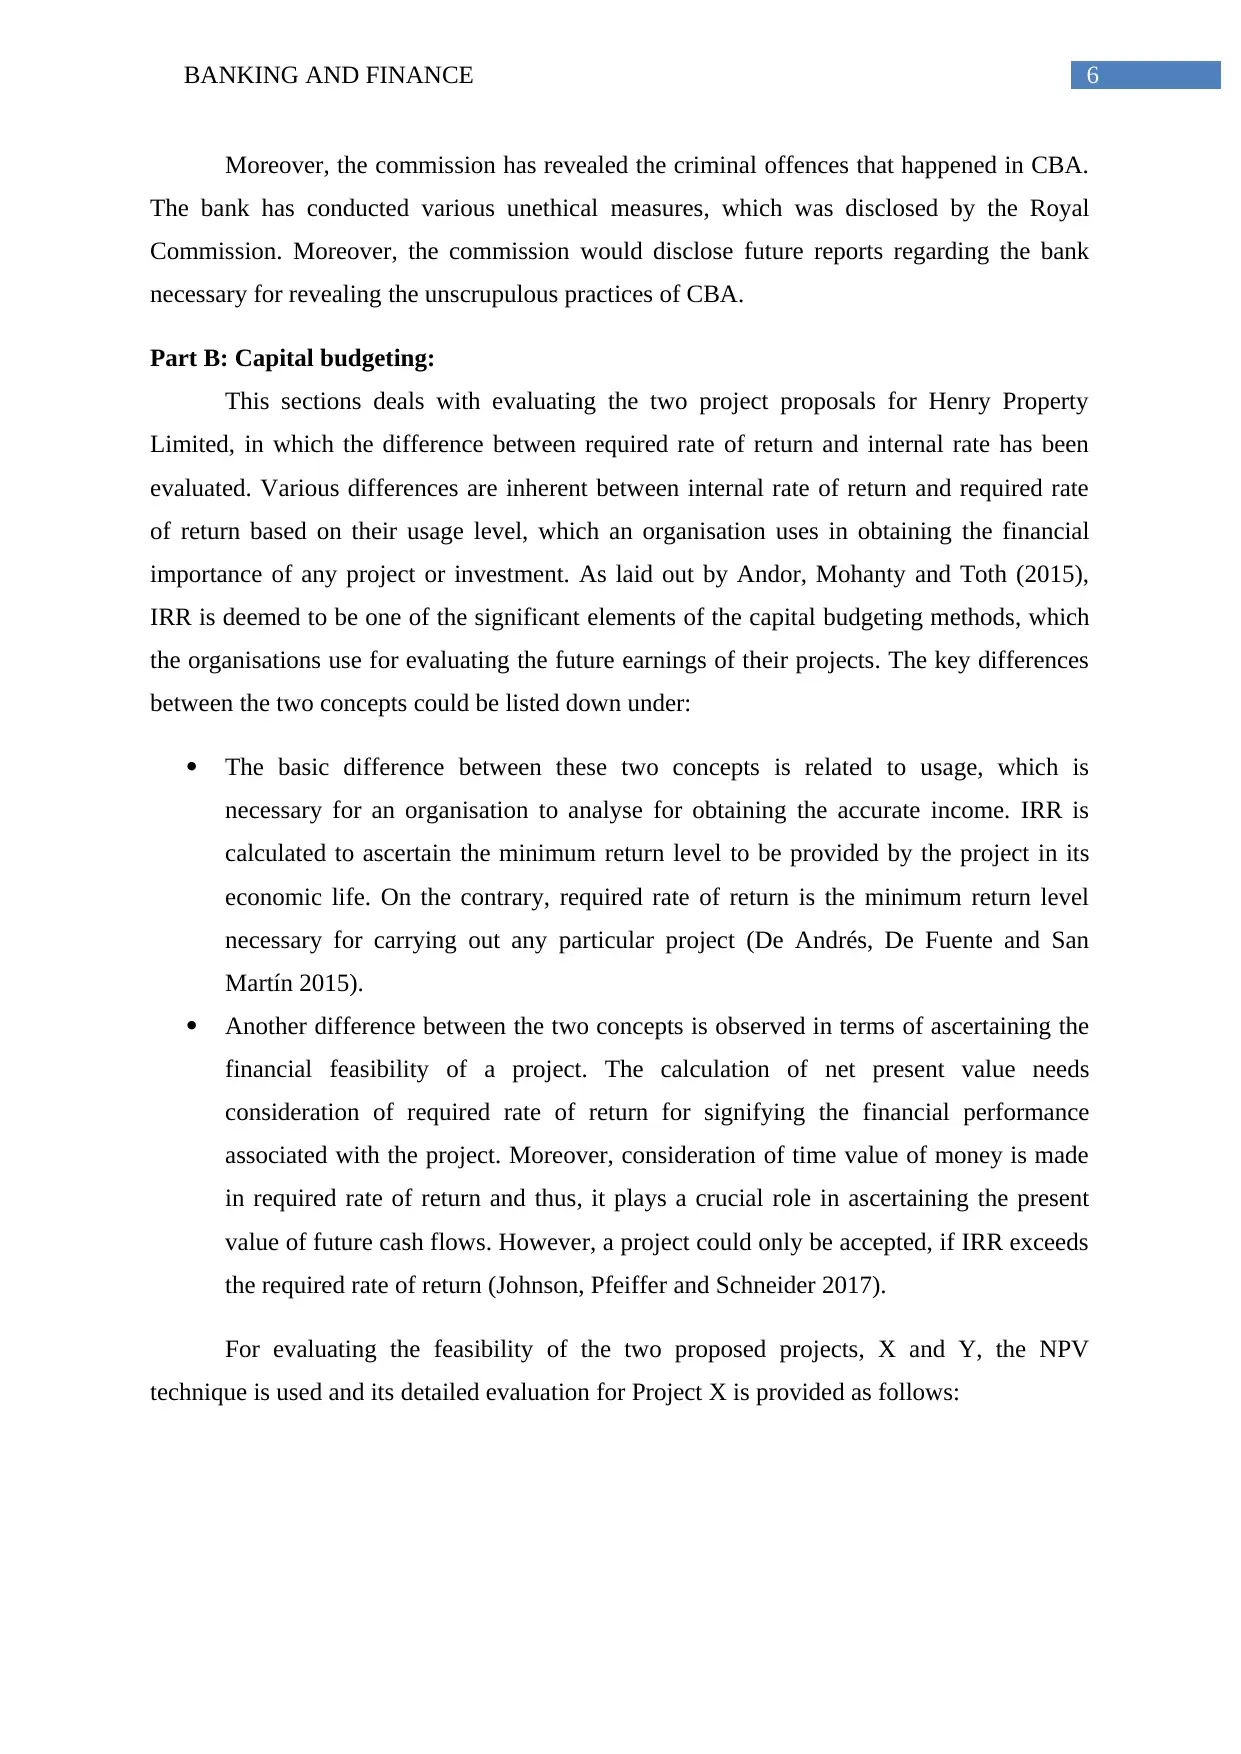
It is apparent from the above table that the NPV of Project X is obtained as
$77,250.04 by taking into consideration the cost of capital as 12%. This has assisted in
ascertaining the level of returns, which could be sought from undertaking the project
(Johnson and Pfeiffer 2016). As the NPV is found to be positive, the project could be
considered favourable for the organisation. However, before undertaking any decision, it is
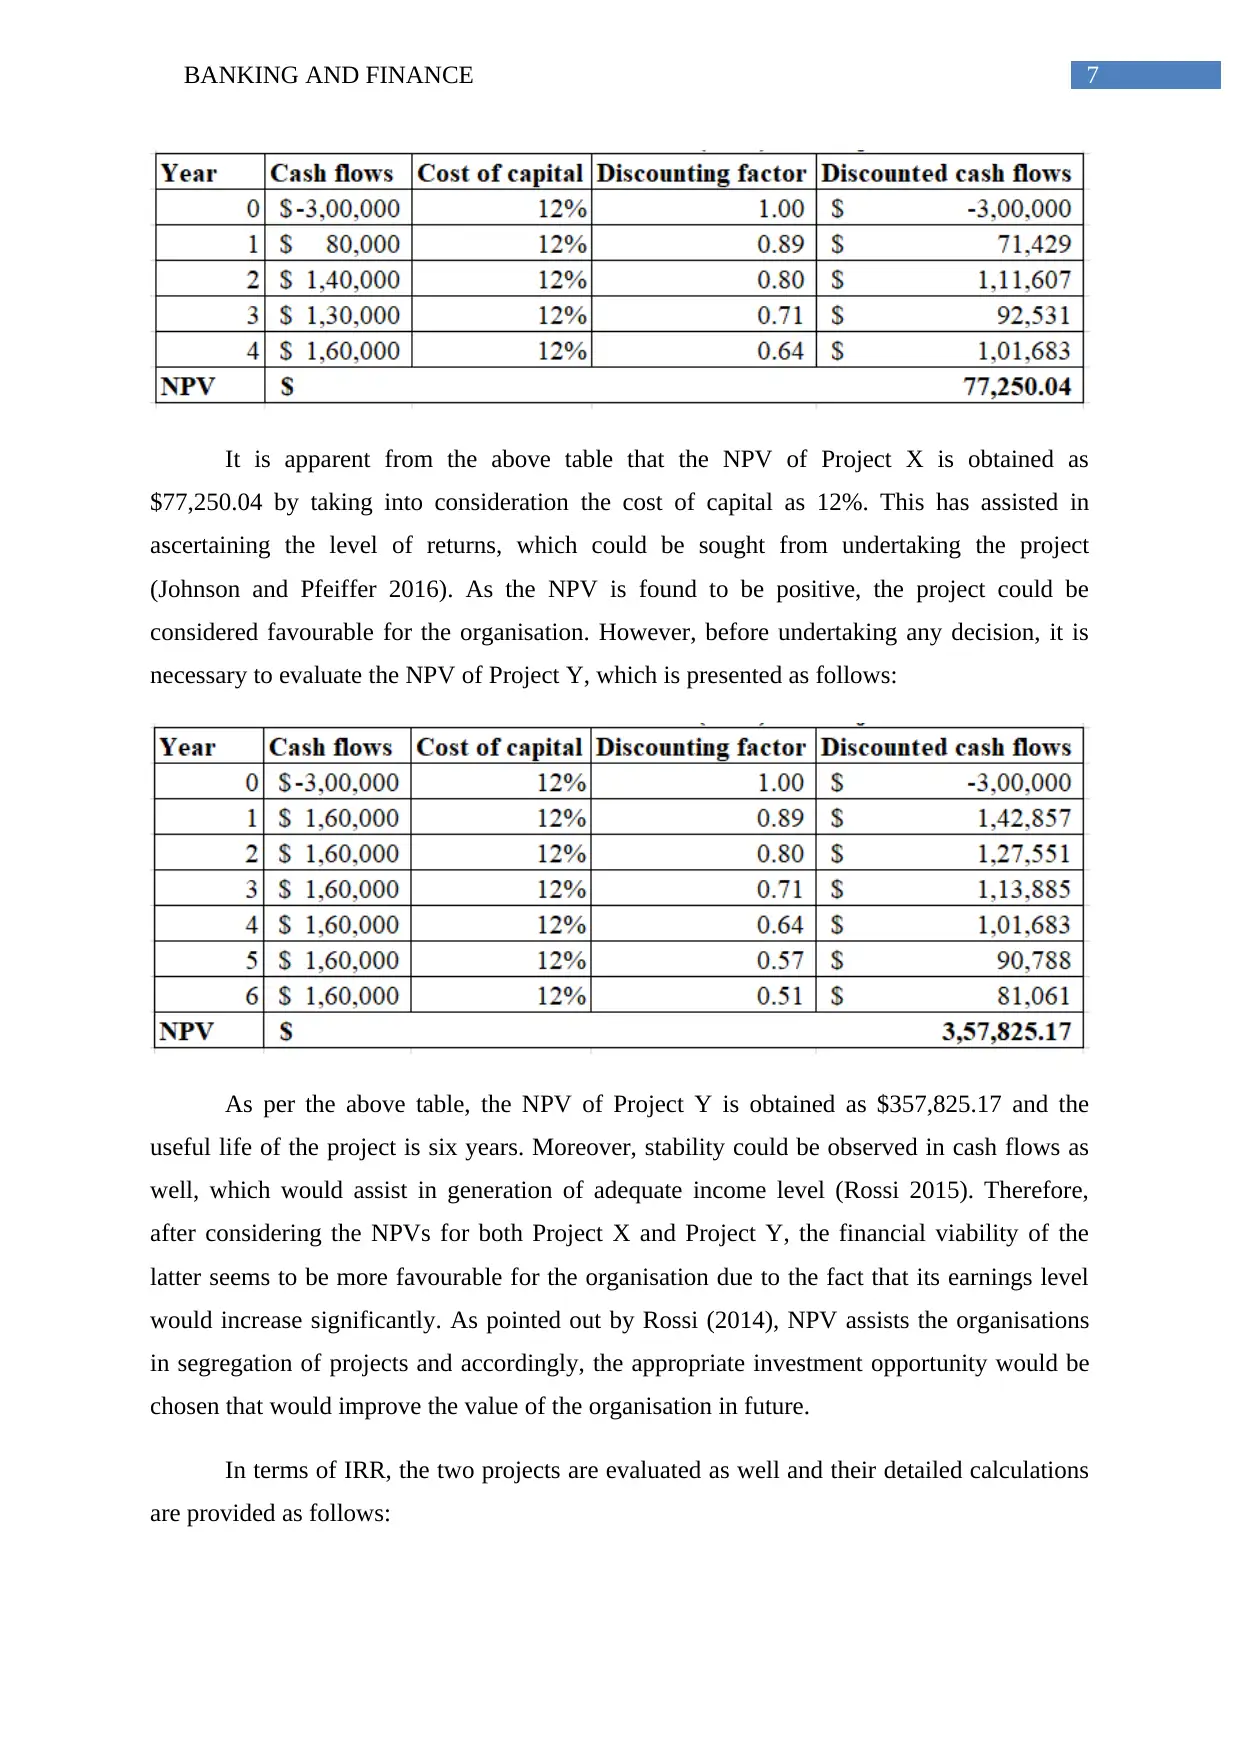
necessary to evaluate the NPV of Project Y, which is presented as follows:
As per the above table, the NPV of Project Y is obtained as $357,825.17 and the
useful life of the project is six years. Moreover, stability could be observed in cash flows as
well, which would assist in generation of adequate income level (Rossi 2015). Therefore,
after considering the NPVs for both Project X and Project Y, the financial viability of the
latter seems to be more favourable for the organisation due to the fact that its earnings level
would increase significantly. As pointed out by Rossi (2014), NPV assists the organisations
in segregation of projects and accordingly, the appropriate investment opportunity would be
chosen that would improve the value of the organisation in future.
In terms of IRR, the two projects are evaluated as well and their detailed calculations
are provided as follows:
It is apparent from the above table that the NPV of Project X is obtained as
$77,250.04 by taking into consideration the cost of capital as 12%. This has assisted in
ascertaining the level of returns, which could be sought from undertaking the project
(Johnson and Pfeiffer 2016). As the NPV is found to be positive, the project could be
considered favourable for the organisation. However, before undertaking any decision, it is
necessary to evaluate the NPV of Project Y, which is presented as follows:
As per the above table, the NPV of Project Y is obtained as $357,825.17 and the
useful life of the project is six years. Moreover, stability could be observed in cash flows as
well, which would assist in generation of adequate income level (Rossi 2015). Therefore,
after considering the NPVs for both Project X and Project Y, the financial viability of the
latter seems to be more favourable for the organisation due to the fact that its earnings level
would increase significantly. As pointed out by Rossi (2014), NPV assists the organisations
in segregation of projects and accordingly, the appropriate investment opportunity would be
chosen that would improve the value of the organisation in future.
In terms of IRR, the two projects are evaluated as well and their detailed calculations
are provided as follows:
8BANKING AND FINANCE
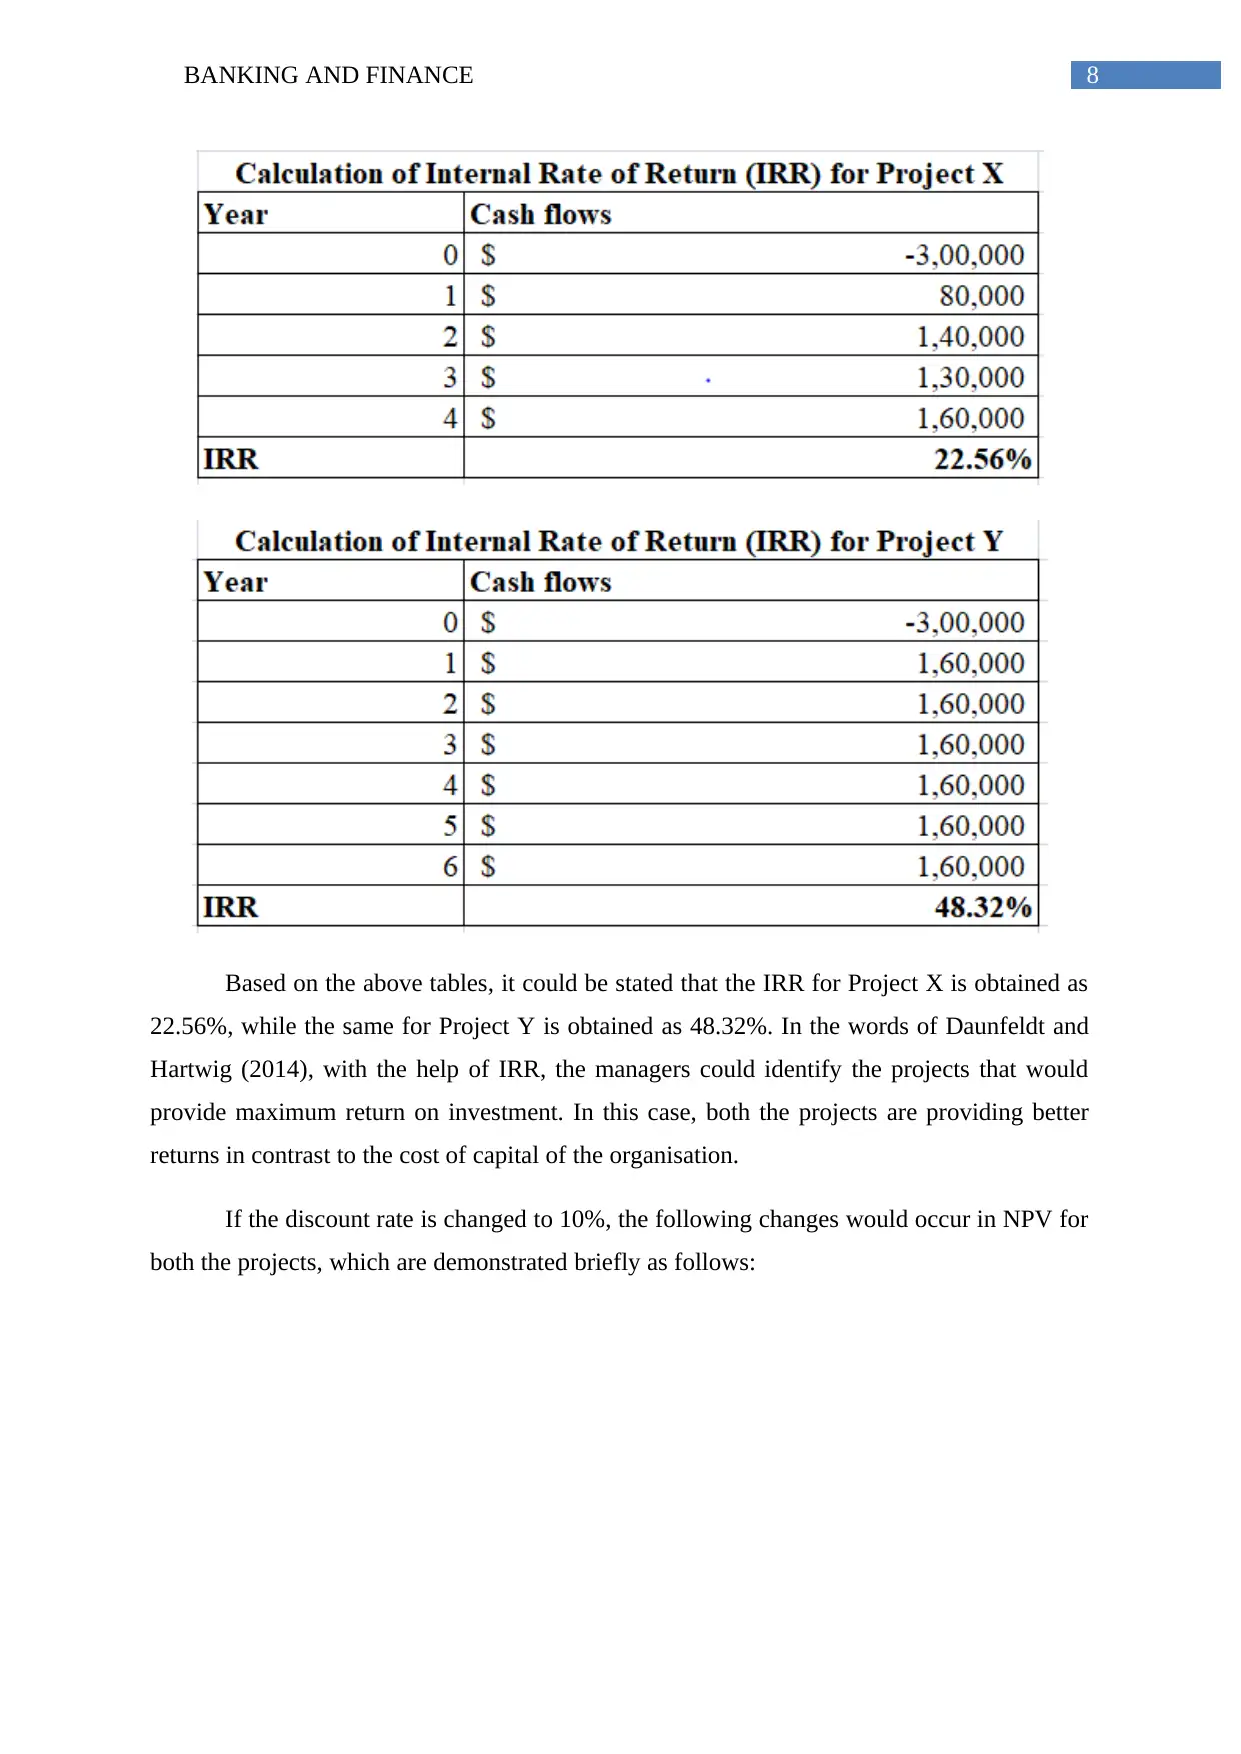
Based on the above tables, it could be stated that the IRR for Project X is obtained as
22.56%, while the same for Project Y is obtained as 48.32%. In the words of Daunfeldt and
Hartwig (2014), with the help of IRR, the managers could identify the projects that would
provide maximum return on investment. In this case, both the projects are providing better
returns in contrast to the cost of capital of the organisation.
If the discount rate is changed to 10%, the following changes would occur in NPV for
both the projects, which are demonstrated briefly as follows:
⊘ This is a preview!⊘
Do you want full access?
Subscribe today to unlock all pages.
Trusted by 1+ million students worldwide

9BANKING AND FINANCE
From the above tables, it is inherent that the NPV for Project X is obtained as
$95,382.83, which is more than the NPV of the project having the discount rate of 12%. The
similar situation could be observed in case of Project Y as well, as the NPV of the project has
increased. Therefore, it is prominent that the fall in cost of capital increases the NPV of the
project and vice-versa (Schönbohm and Zahn 2016). However, the trend is same and hence,
no impact on the decision would be made, as both the projects seem to be profitable from the
viewpoint of Henry Property Limited.
However, it is to be borne in mind that there might be circumstances, in which NPV
and IRR would provide different recommendations and they need to be analysed carefully.
Any change made in the cost of capital of the project might have favourable or unfavourable
impact on the value of NPV, while the IRR value would tend to remain unchanged. This
clearly signifies that the project recommendations for NPV would change with no
modification in the value of IRR (Mukherjee, Al Rahahleh and Lane 2016). Another situation
where NPV and IRR would not offer the same recommendation is related to the timing of the
cash outflows. In such scenario, no change could be observed in NPV, while IRR might have
negative or multiple values. This implies that in case of timing variation in cash outflows, the
Paraphrase This Document
Need a fresh take? Get an instant paraphrase of this document with our AI Paraphraser
10BANKING AND FINANCE
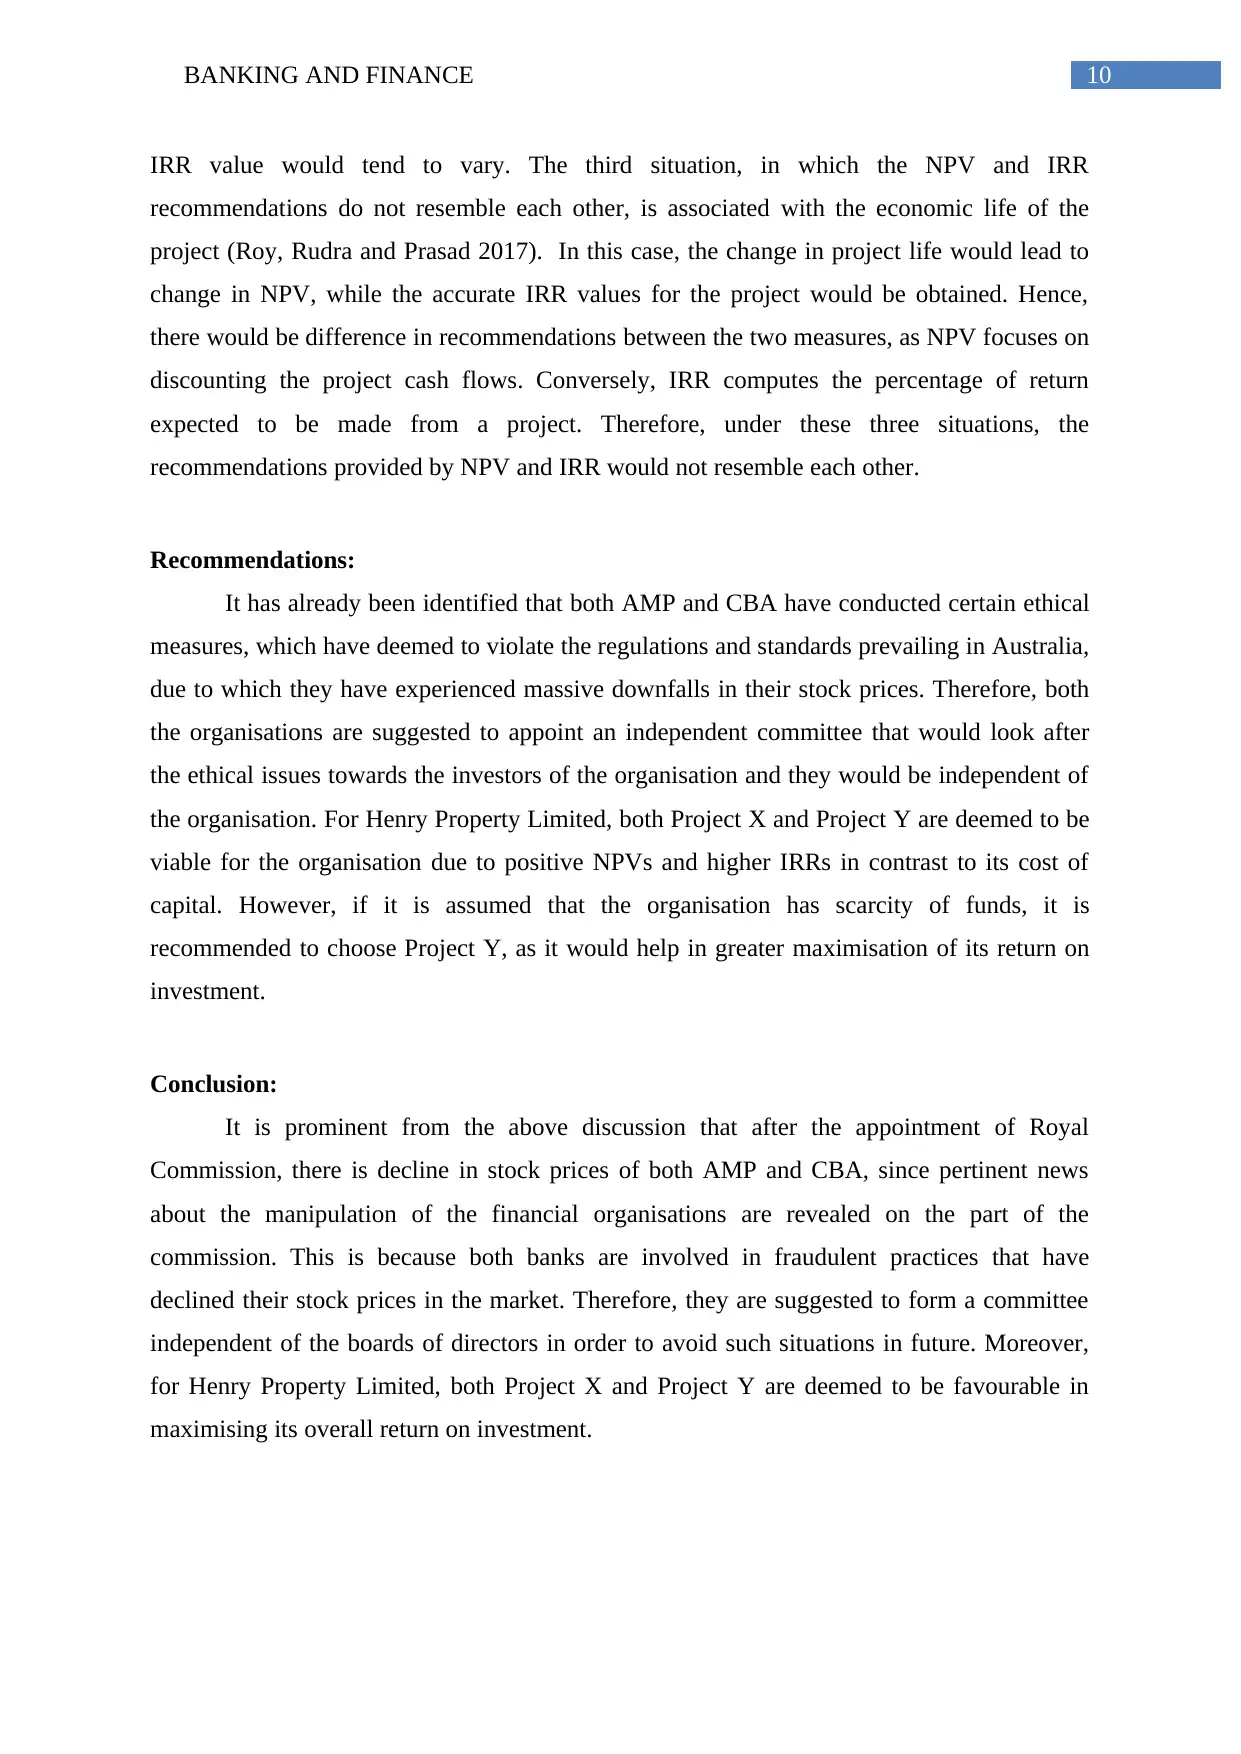
IRR value would tend to vary. The third situation, in which the NPV and IRR
recommendations do not resemble each other, is associated with the economic life of the
project (Roy, Rudra and Prasad 2017). In this case, the change in project life would lead to
change in NPV, while the accurate IRR values for the project would be obtained. Hence,
there would be difference in recommendations between the two measures, as NPV focuses on
discounting the project cash flows. Conversely, IRR computes the percentage of return
expected to be made from a project. Therefore, under these three situations, the
recommendations provided by NPV and IRR would not resemble each other.
Recommendations:
It has already been identified that both AMP and CBA have conducted certain ethical
measures, which have deemed to violate the regulations and standards prevailing in Australia,
due to which they have experienced massive downfalls in their stock prices. Therefore, both
the organisations are suggested to appoint an independent committee that would look after
the ethical issues towards the investors of the organisation and they would be independent of
the organisation. For Henry Property Limited, both Project X and Project Y are deemed to be
viable for the organisation due to positive NPVs and higher IRRs in contrast to its cost of
capital. However, if it is assumed that the organisation has scarcity of funds, it is
recommended to choose Project Y, as it would help in greater maximisation of its return on
investment.
Conclusion:
It is prominent from the above discussion that after the appointment of Royal
Commission, there is decline in stock prices of both AMP and CBA, since pertinent news
about the manipulation of the financial organisations are revealed on the part of the
commission. This is because both banks are involved in fraudulent practices that have
declined their stock prices in the market. Therefore, they are suggested to form a committee
independent of the boards of directors in order to avoid such situations in future. Moreover,
for Henry Property Limited, both Project X and Project Y are deemed to be favourable in
maximising its overall return on investment.
11BANKING AND FINANCE
References:
Almazan, A., Chen, Z. and Titman, S., 2017. Firm Investment and Stakeholder Choices: A
Top‐Down Theory of Capital Budgeting. The Journal of Finance, 72(5), pp.2179-2228.
Amp.com.au., 2018. AMP Personal Banking - Accounts, Super, Home Loans & Insurance |
AMP. [online] Available at: https://www.amp.com.au/ [Accessed 19 Sep. 2018].
Andor, G., Mohanty, S.K. and Toth, T., 2015. Capital budgeting practices: A survey of
Central and Eastern European firms. Emerging Markets Review, 23, pp.148-172.
Asx.com.au., 2018. Home - Australian Securities Exchange - ASX. [online] Available at:
https://www.asx.com.au/ [Accessed 19 Sep. 2018].
Au.finance.yahoo.com., 2018. Yahoo is now a part of Oath. [online] Available at:
https://au.finance.yahoo.com/ [Accessed 19 Sep. 2018].
Bikker, J.A. and Spierdijk, L. eds., 2017. Handbook of Competition in Banking and Finance.
Edward Elgar Publishing.
Commbank.com.au., 2018. Personal banking including accounts, credit cards and home
loans - CommBank. [online] Available at: https://www.commbank.com.au/ [Accessed 19
Sep. 2018].
Daunfeldt, S.O. and Hartwig, F., 2014. What determines the use of capital budgeting
methods?: Evidence from Swedish listed companies. Journal of Finance and
Economics, 2(4), pp.101-112.
De Andrés, P., De Fuente, G. and San Martín, P., 2015. Capital budgeting practices in
Spain. BRQ Business Research Quarterly, 18(1), pp.37-56.
Johnson, N.B. and Pfeiffer, T., 2016. Capital budgeting and divisional performance
measurement. Foundations and Trends® in Accounting, 10(1), pp.1-100.
Johnson, N.B., Pfeiffer, T. and Schneider, G., 2017. Two-stage capital budgeting, capital
charge rates, and resource constraints. Review of Accounting Studies, 22(2), pp.933-963.
⊘ This is a preview!⊘
Do you want full access?
Subscribe today to unlock all pages.
Trusted by 1+ million students worldwide
1 out of 13
Related Documents


Your All-in-One AI-Powered Toolkit for Academic Success.
+13062052269
info@desklib.com
Available 24*7 on WhatsApp / Email
![[object Object]](/_next/static/media/star-bottom.7253800d.svg)
Unlock your academic potential
Copyright © 2020–2026 A2Z Services. All Rights Reserved. Developed and managed by ZUCOL.