Swinburne University: FIN30016 Investment Portfolio Report
VerifiedAdded on  2022/10/02
|10
|1718
|448
Report
AI Summary
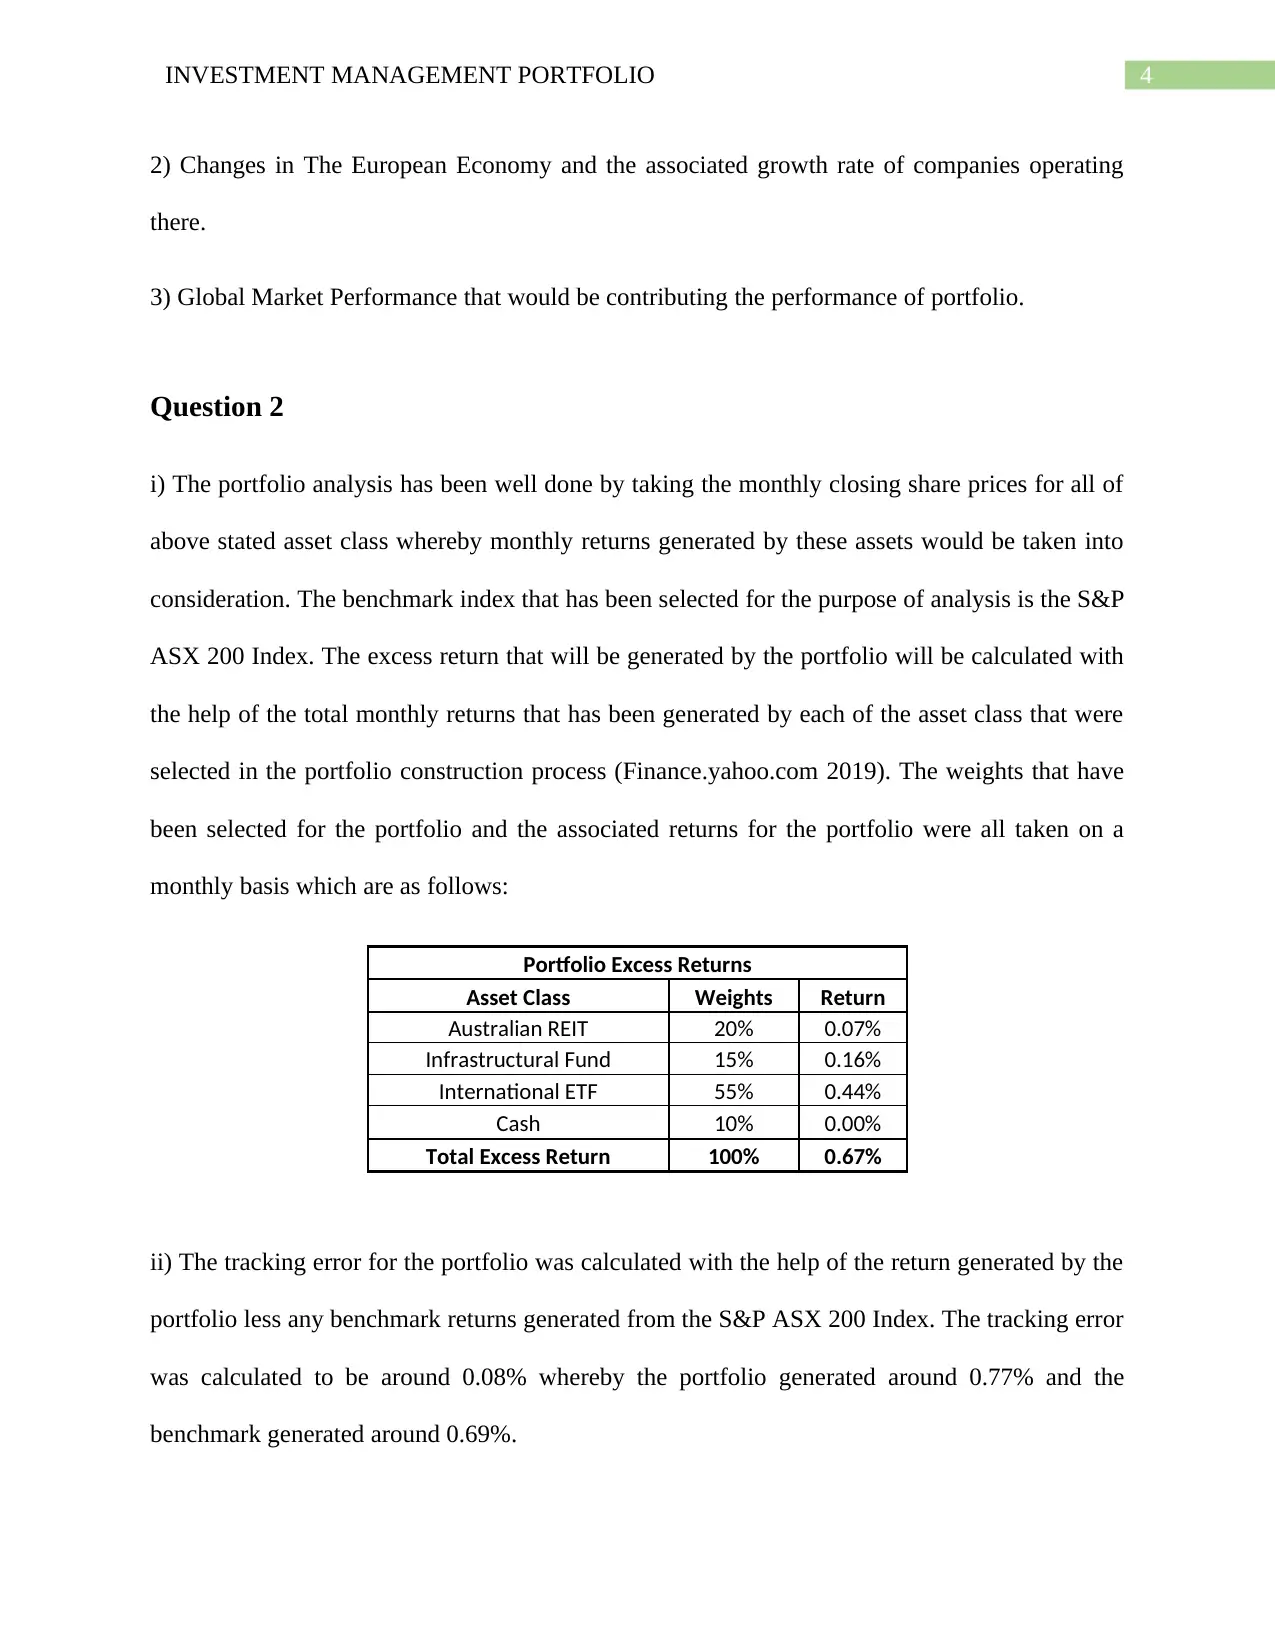
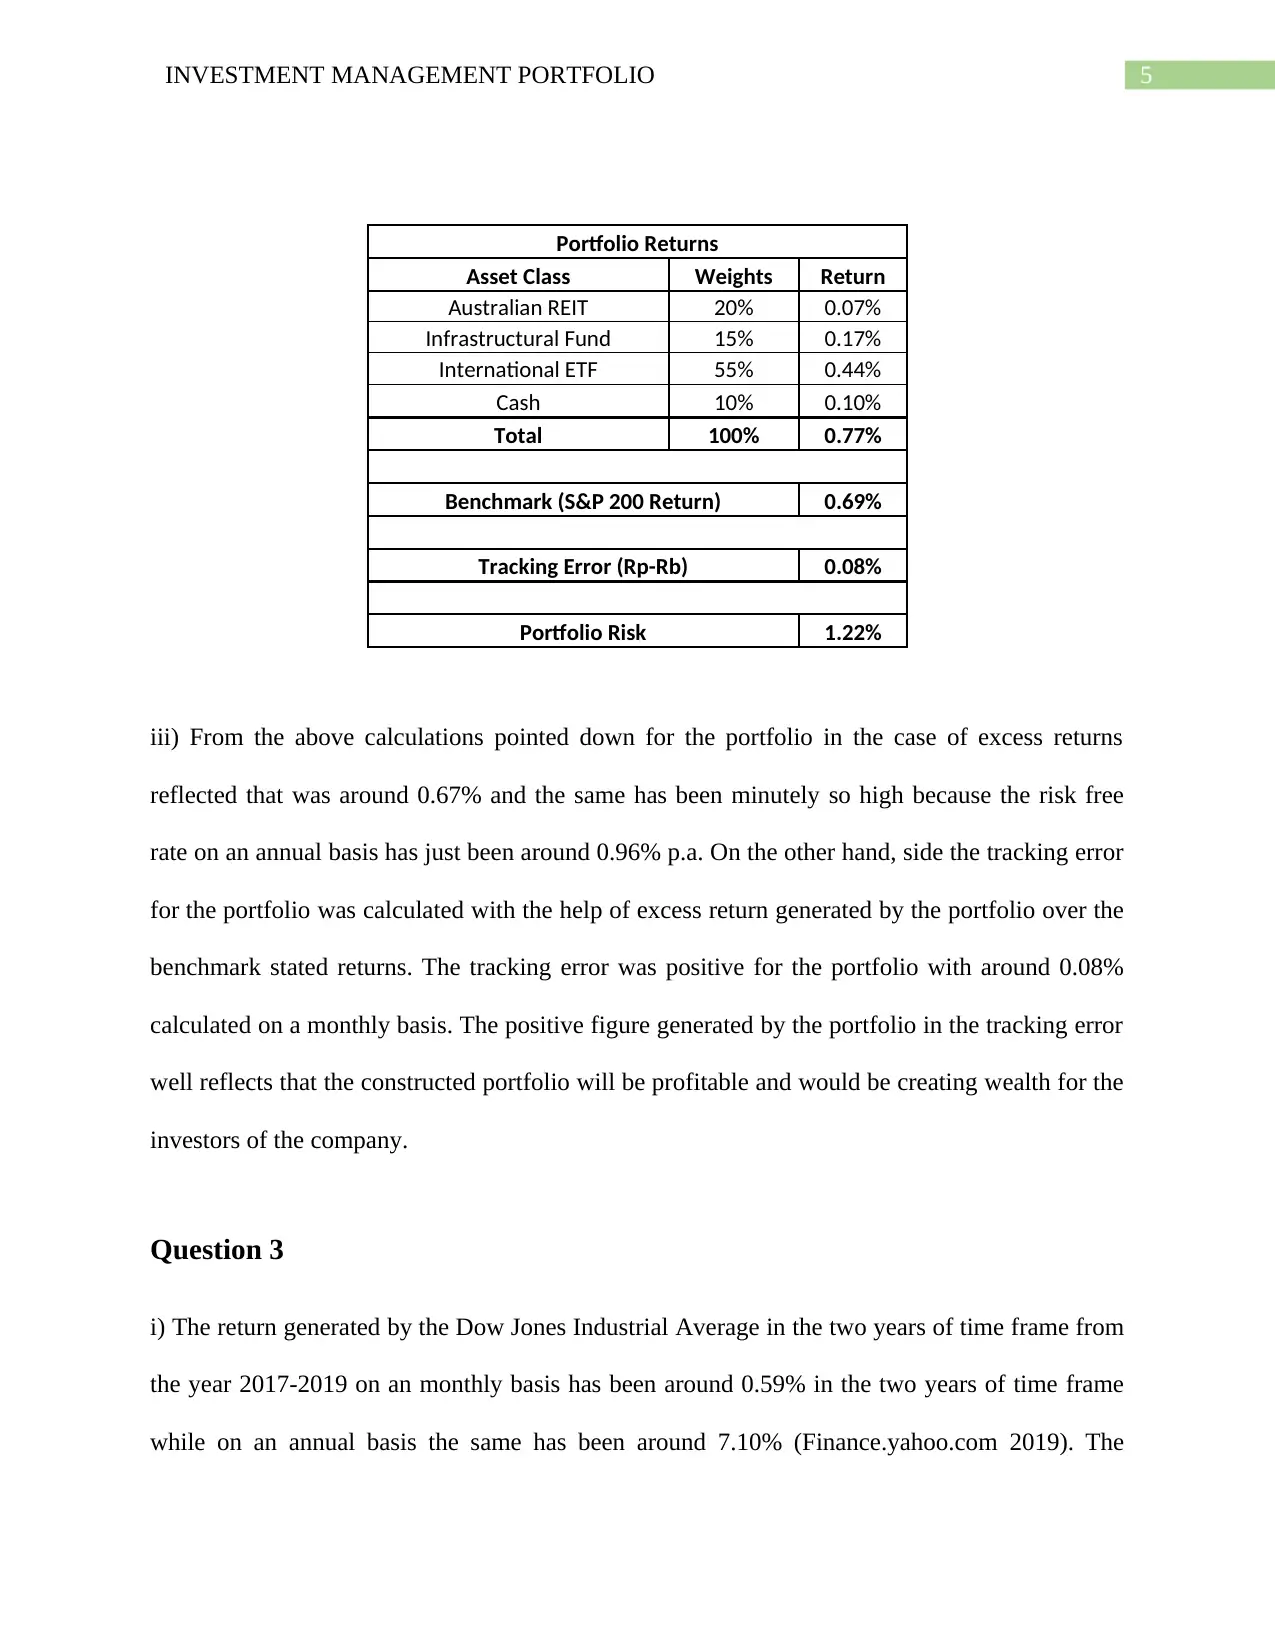
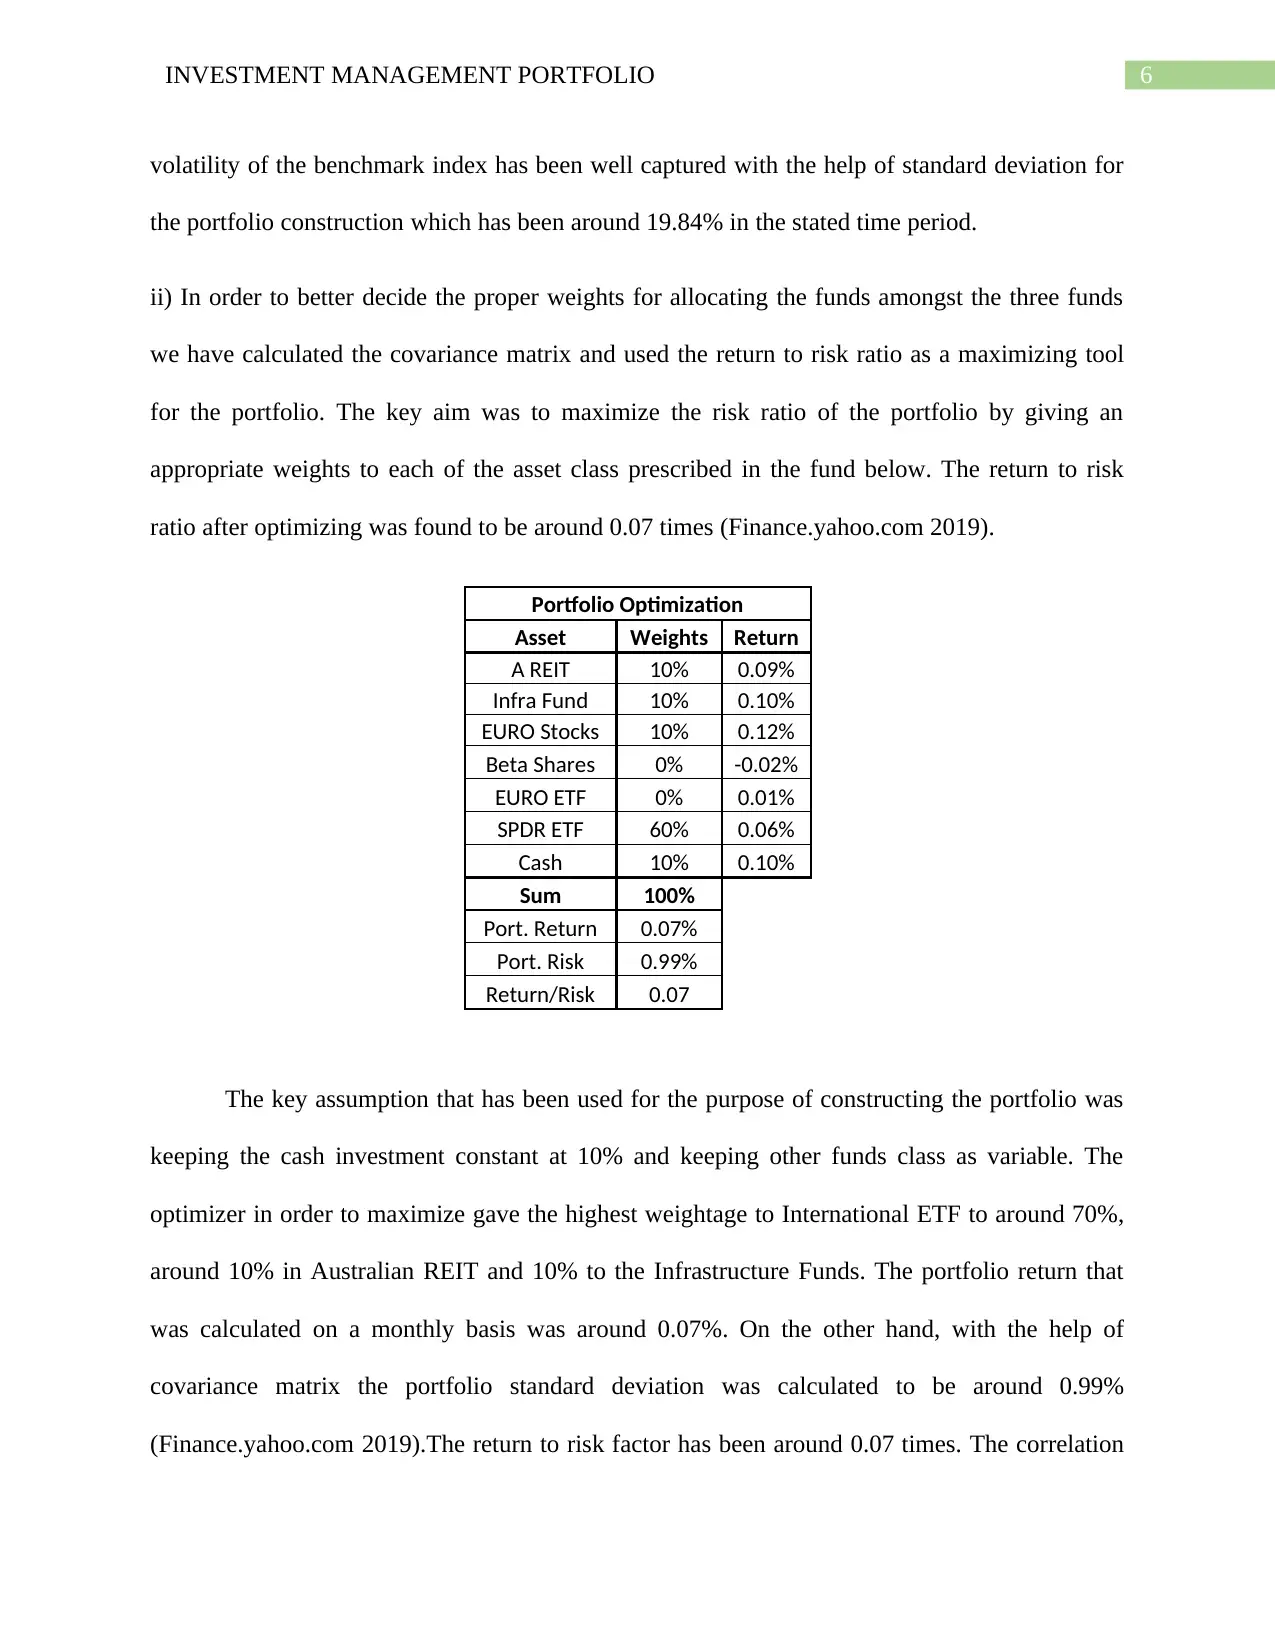
This report presents an analysis of an investment portfolio, focusing on the performance and optimization of various asset classes. The analysis begins with the selection and justification of specific Australian REITs (Scentre Group) and Infrastructure Funds (AusNet Services Ltd.), as well as International ETFs (ETFS Euro Stoxx 50 ETF), Sector ETFs (BetaShares Global Bank ETF), Cash and Currency ETFs (BetaShare EURO ETF), and Fixed Income ETFs (SPDR S&P/ASX Gov. Bond). The report identifies factors influencing fund performance, such as currency fluctuations and global market trends. The portfolio analysis includes calculating excess returns, tracking error, and portfolio risk, with the S&P ASX 200 Index used as a benchmark. Furthermore, the report examines the Dow Jones Industrial Average's performance and employs a covariance matrix to optimize fund allocation, aiming to maximize the return-to-risk ratio. The optimization process suggests specific asset weights, and the report discusses the correlation between different funds within the portfolio.

Running head: INVESTMENT MANAGEMENT PORTFOLIO
Investment Management Portfolio
Name of the Student:
Name of the University:
Author’s Note:
Investment Management Portfolio
Name of the Student:
Name of the University:
Author’s Note:
Paraphrase This Document
Need a fresh take? Get an instant paraphrase of this document with our AI Paraphraser

1INVESTMENT MANAGEMENT PORTFOLIO
Table of Contents
Question 1........................................................................................................................................2
Part 1............................................................................................................................................2
Part II...........................................................................................................................................2
Justifications of Funds.................................................................................................................2
Factors Influencing Performance of Funds..................................................................................3
Question 2........................................................................................................................................4
Question 3........................................................................................................................................5
References........................................................................................................................................8

2INVESTMENT MANAGEMENT PORTFOLIO
Question 1
Part 1
The Australian REIT that has been selected for the purpose of analysis is the Scentre
Group. On the other hand the Infrastructural Fund that has been selected for the purpose of
analysis is the AusNet Services Ltd. The Fund own and operates three regulated energy network
business that includes the High Voltage Electricity Business which is Victoria’s. On the other
hand, the electricity distribution network in the eastern Victoria is the other key distribution of
Infrastructure Fund and a key Infrastructure Asset operating in the Gas Distribution Network,
which is in the Western Victoria. Finally Modo is the other business sector that is in the
commercial energy services (Asx.com.au 2011). The revenue generated by the fund has been
around $1,861 Million in the year 2019 and the same was around $1909.8 Million in the year
2018, a movement of 2.5%. From the Revenue Contribution perspective it is to be noted that the
Electricity Distribution Network has provided around $866.2 Million in 2019, which has
comparatively fallen over the two-year time frame as the same was around $891.4 Million
(Ausnetservices.com.au 2019). On the other hand, side the Electricity Transformation division
which is a key infrastructural asset has contributed around $618.2 Million in the year 2019 and
has contributed around $601.9 Million which is marginally greater showing an increase of
around 2.5% in the trend period.
Part II
Justifications of Funds
The key fund that have been selected in the International/Strategy ETF Section are
primarily as follows:
⊘ This is a preview!⊘
Do you want full access?
Subscribe today to unlock all pages.

Trusted by 1+ million students worldwide

3INVESTMENT MANAGEMENT PORTFOLIO
International ETFS (ETFS Euro Stoxx 50 ETF): The fund has been selected based on the
fund performance and the diversification provided by the Fund as it contains 50 stocks from 12
different European Countries (Etfsecurities.com.au 2019). The fund would be giving us an
exposure to the Eurozone and would be primarily investing in the blue-chip stocks.
International Sector ETFs (BetaShares Global Bank ETF): The fund has been selected as it
would be providing an easy diversification process among the various banks that the fund invest
on a global basis. The foreign exposure with the currency movement is well hedged with the
Australian Dollar which reduces the currency exposure and the associated fund flows.
Cash and Currency ETFs (BetaShare EURO ETF): The fund would be providing an
exposure to the Euro Currency against the Australian Dollar. The performance of the ETF could
be well benchmarked with the performance of EURO Currency (BetaShares 2019). The key
convenience that the ETF would be providing will be in the form of avoiding various trading
costs and complexity that is associated with the forex transactions.
Fixed Income ETF (SPDR S&P/ASX Gov. Bond): The selected fund would be helping in
regular income generation as the same would be benefiting the potential investors from a regular
source of income stream that would be provided by the Bond in the form of coupon payment
acting as regular cash flows. The bonds listed in the fund are primarily of AAA rated quality
(Ssga.com 2019).
Factors Influencing Performance of Funds
The three key factors that would be influencing the performance of the fund would be
primarily in the form of:
1) Changes in the Euro Currency and the returns associated with the currency.
Paraphrase This Document
Need a fresh take? Get an instant paraphrase of this document with our AI Paraphraser

4INVESTMENT MANAGEMENT PORTFOLIO
2) Changes in The European Economy and the associated growth rate of companies operating
there.
3) Global Market Performance that would be contributing the performance of portfolio.
Question 2
i) The portfolio analysis has been well done by taking the monthly closing share prices for all of
above stated asset class whereby monthly returns generated by these assets would be taken into
consideration. The benchmark index that has been selected for the purpose of analysis is the S&P
ASX 200 Index. The excess return that will be generated by the portfolio will be calculated with
the help of the total monthly returns that has been generated by each of the asset class that were
selected in the portfolio construction process (Finance.yahoo.com 2019). The weights that have
been selected for the portfolio and the associated returns for the portfolio were all taken on a
monthly basis which are as follows:
Portfolio Excess Returns
Asset Class Weights Return
Australian REIT 20% 0.07%
Infrastructural Fund 15% 0.16%
International ETF 55% 0.44%
Cash 10% 0.00%
Total Excess Return 100% 0.67%
ii) The tracking error for the portfolio was calculated with the help of the return generated by the
portfolio less any benchmark returns generated from the S&P ASX 200 Index. The tracking error
was calculated to be around 0.08% whereby the portfolio generated around 0.77% and the
benchmark generated around 0.69%.

5INVESTMENT MANAGEMENT PORTFOLIO
Portfolio Returns
Asset Class Weights Return
Australian REIT 20% 0.07%
Infrastructural Fund 15% 0.17%
International ETF 55% 0.44%
Cash 10% 0.10%
Total 100% 0.77%
Benchmark (S&P 200 Return) 0.69%
Tracking Error (Rp-Rb) 0.08%
Portfolio Risk 1.22%
iii) From the above calculations pointed down for the portfolio in the case of excess returns
reflected that was around 0.67% and the same has been minutely so high because the risk free
rate on an annual basis has just been around 0.96% p.a. On the other hand, side the tracking error
for the portfolio was calculated with the help of excess return generated by the portfolio over the
benchmark stated returns. The tracking error was positive for the portfolio with around 0.08%
calculated on a monthly basis. The positive figure generated by the portfolio in the tracking error
well reflects that the constructed portfolio will be profitable and would be creating wealth for the
investors of the company.
Question 3
i) The return generated by the Dow Jones Industrial Average in the two years of time frame from
the year 2017-2019 on an monthly basis has been around 0.59% in the two years of time frame
while on an annual basis the same has been around 7.10% (Finance.yahoo.com 2019). The
⊘ This is a preview!⊘
Do you want full access?
Subscribe today to unlock all pages.

Trusted by 1+ million students worldwide

6INVESTMENT MANAGEMENT PORTFOLIO
volatility of the benchmark index has been well captured with the help of standard deviation for
the portfolio construction which has been around 19.84% in the stated time period.
ii) In order to better decide the proper weights for allocating the funds amongst the three funds
we have calculated the covariance matrix and used the return to risk ratio as a maximizing tool
for the portfolio. The key aim was to maximize the risk ratio of the portfolio by giving an
appropriate weights to each of the asset class prescribed in the fund below. The return to risk
ratio after optimizing was found to be around 0.07 times (Finance.yahoo.com 2019).
Portfolio Optimization
Asset Weights Return
A REIT 10% 0.09%
Infra Fund 10% 0.10%
EURO Stocks 10% 0.12%
Beta Shares 0% -0.02%
EURO ETF 0% 0.01%
SPDR ETF 60% 0.06%
Cash 10% 0.10%
Sum 100%
Port. Return 0.07%
Port. Risk 0.99%
Return/Risk 0.07
The key assumption that has been used for the purpose of constructing the portfolio was
keeping the cash investment constant at 10% and keeping other funds class as variable. The
optimizer in order to maximize gave the highest weightage to International ETF to around 70%,
around 10% in Australian REIT and 10% to the Infrastructure Funds. The portfolio return that
was calculated on a monthly basis was around 0.07%. On the other hand, with the help of
covariance matrix the portfolio standard deviation was calculated to be around 0.99%
(Finance.yahoo.com 2019).The return to risk factor has been around 0.07 times. The correlation
Paraphrase This Document
Need a fresh take? Get an instant paraphrase of this document with our AI Paraphraser

7INVESTMENT MANAGEMENT PORTFOLIO
for each of the fund or asset class was calculated and amongst which it was specially found that
Beta Shares Global ETF (International Sector ETF) had the highest correlation to around 0.823
times. The lowest correlation was around -0.3145 which was for Beta Shares EURO ETF (Cash
and Currency ETF).
for each of the fund or asset class was calculated and amongst which it was specially found that
Beta Shares Global ETF (International Sector ETF) had the highest correlation to around 0.823
times. The lowest correlation was around -0.3145 which was for Beta Shares EURO ETF (Cash
and Currency ETF).

8INVESTMENT MANAGEMENT PORTFOLIO
References
Asx.com.au. 2011. Complete list of exchange-traded products on ASX.. [online] Available at:
https://www.asx.com.au/products/etf/managed-funds-etp-product-list.htm# [Accessed 2 Oct.
2019].
Ausnetservices.com.au. 2019. Home. [online] Available at: https://www.ausnetservices.com.au/
[Accessed 2 Oct. 2019].
BetaShares. 2019. Euro ETF | BetaShares. [online] Available at:
https://www.betashares.com.au/fund/euro-etf-betashares/ [Accessed 2 Oct. 2019].
Etfsecurities.com.au. 2019. [online] Available at: https://www.etfsecurities.com.au/product/estx
[Accessed 2 Oct. 2019].
Finance.yahoo.com. 2019. [online] Available at:
https://finance.yahoo.com/quote/GOVT.AX/history?p=GOVT.AX&.tsrc=fin-srch [Accessed 2
Oct. 2019].
Finance.yahoo.com. 2019. [online] Available at:
https://finance.yahoo.com/quote/%5EDJI/history?
period1=1475346600&period2=1569954600&interval=1mo&filter=history&frequency=1mo
[Accessed 2 Oct. 2019].
Finance.yahoo.com. 2019. [online] Available at:
https://finance.yahoo.com/quote/BNKS.AX/history?p=BNKS.AX&.tsrc=fin-srch [Accessed 2
Oct. 2019].
⊘ This is a preview!⊘
Do you want full access?
Subscribe today to unlock all pages.

Trusted by 1+ million students worldwide

9INVESTMENT MANAGEMENT PORTFOLIO
Ssga.com. 2019. GOVT: SPDR S&P ASX Australian Government Bond | State Street ETFs.
[online] Available at: https://www.ssga.com/au/en_gb/individual/etfs/funds/spdr-sp-asx-
australian-government-bond-fund-govt [Accessed 2 Oct. 2019].
Ssga.com. 2019. GOVT: SPDR S&P ASX Australian Government Bond | State Street ETFs.
[online] Available at: https://www.ssga.com/au/en_gb/individual/etfs/funds/spdr-sp-asx-
australian-government-bond-fund-govt [Accessed 2 Oct. 2019].
1 out of 10
Related Documents

Your All-in-One AI-Powered Toolkit for Academic Success.
 +13062052269
info@desklib.com
Available 24*7 on WhatsApp / Email
Unlock your academic potential
Copyright © 2020–2025 A2Z Services. All Rights Reserved. Developed and managed by ZUCOL.