FIN3CSF: Case Study 5 - Investment Portfolio Performance Evaluation
VerifiedAdded on 2023/06/11
|11
|2551
|284
Case Study
AI Summary
This case study provides an in-depth analysis of an investment portfolio's performance, considering the economic and industry conditions within the Australian equity market. It examines the global and local economic environments, including GDP, inflation rates, and cash reserve rates, and their impact on the portfolio's components. The study identifies contributors and detractors to the portfolio's return, such as BHP Billiton, Qantas Airways, and ANZ Bank, and evaluates the overall portfolio performance using measures of risk and return. The conclusion offers recommendations for optimizing the portfolio's performance by adjusting investments based on their return-generating capacity and hedging strategies, emphasizing the importance of balancing risk and return while maintaining the portfolio's overall investment strategy. Desklib is your go to platform to access similar case studies and assignments.

Running Head: Performance Measures of Portfolio
PORTFOLIO INVESTMENT
PORTFOLIO INVESTMENT
Paraphrase This Document
Need a fresh take? Get an instant paraphrase of this document with our AI Paraphraser
Performance Measures of Portfolio 1
Introduction:
In this report, the economic and industry conditions of the Australian economy as a whole
and the equity market in particular have been discussed. Australian economy is quite
developed and it is also one of the largest economies with the mixed market industries. Till
2017 it has achieved a GDP of Australian dollars 1.69 trillion and also it ranks second
position as a wealthiest nation in the world.
Summary of Economic, global and industry environment
The economy of Australia is primarily dominated by the service sector and therefore almost
65% of total GDP of the country is generated through the service sector only. In the 10 years
from 1999 to 2008, prior to great recession, the GDP of Australian economy grew at the rate
of 3.4% on an average per year. In 2009, the economic growth rate had declined to 1.6% due
to global financial crisis but from 2010 to 2013, the economic performance of the Australian
economy has been improved. Due to this the GDP rate was averaged at 2.7%. The rate of
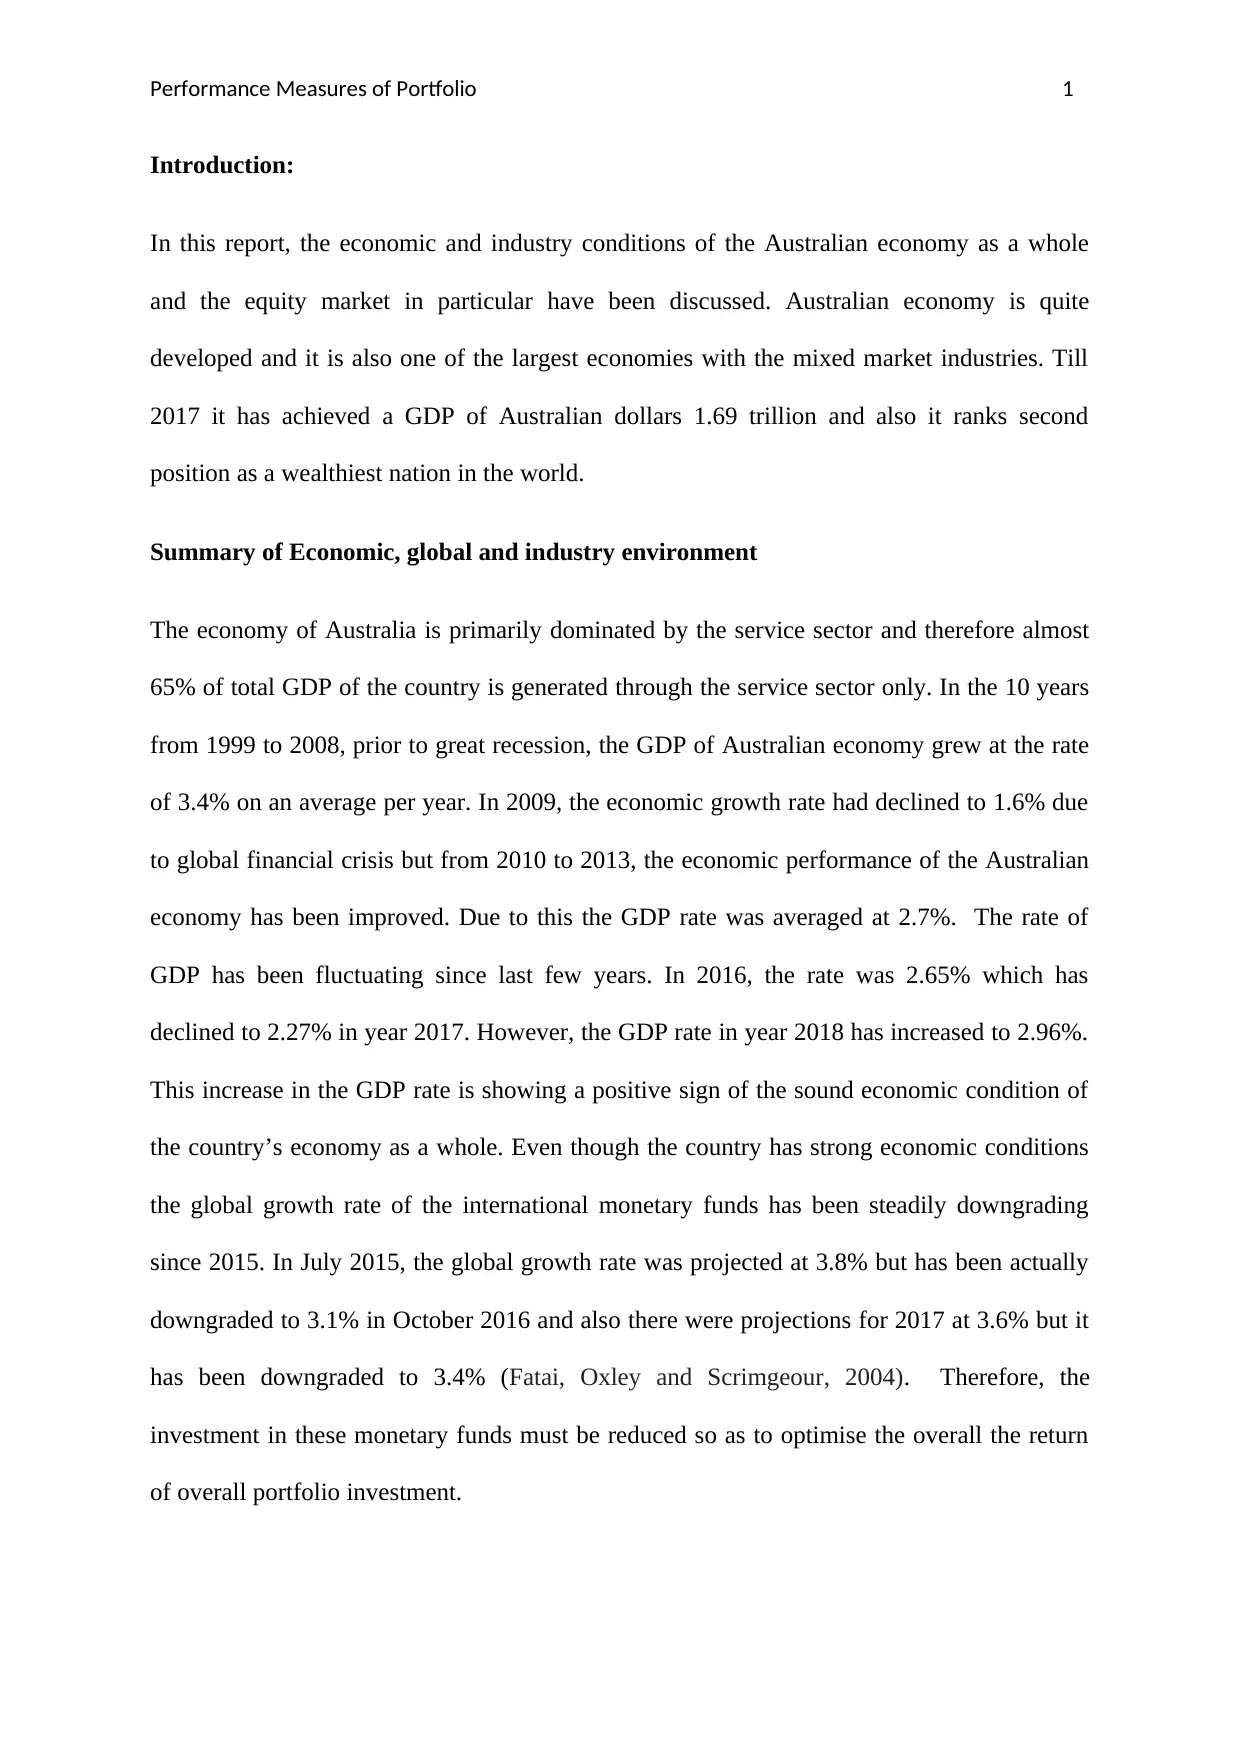
GDP has been fluctuating since last few years. In 2016, the rate was 2.65% which has
declined to 2.27% in year 2017. However, the GDP rate in year 2018 has increased to 2.96%.
This increase in the GDP rate is showing a positive sign of the sound economic condition of
the country’s economy as a whole. Even though the country has strong economic conditions
the global growth rate of the international monetary funds has been steadily downgrading
since 2015. In July 2015, the global growth rate was projected at 3.8% but has been actually
downgraded to 3.1% in October 2016 and also there were projections for 2017 at 3.6% but it
has been downgraded to 3.4% (Fatai, Oxley and Scrimgeour, 2004). Therefore, the
investment in these monetary funds must be reduced so as to optimise the overall the return
of overall portfolio investment.
Introduction:
In this report, the economic and industry conditions of the Australian economy as a whole
and the equity market in particular have been discussed. Australian economy is quite
developed and it is also one of the largest economies with the mixed market industries. Till
2017 it has achieved a GDP of Australian dollars 1.69 trillion and also it ranks second
position as a wealthiest nation in the world.
Summary of Economic, global and industry environment
The economy of Australia is primarily dominated by the service sector and therefore almost
65% of total GDP of the country is generated through the service sector only. In the 10 years
from 1999 to 2008, prior to great recession, the GDP of Australian economy grew at the rate
of 3.4% on an average per year. In 2009, the economic growth rate had declined to 1.6% due
to global financial crisis but from 2010 to 2013, the economic performance of the Australian
economy has been improved. Due to this the GDP rate was averaged at 2.7%. The rate of
GDP has been fluctuating since last few years. In 2016, the rate was 2.65% which has
declined to 2.27% in year 2017. However, the GDP rate in year 2018 has increased to 2.96%.
This increase in the GDP rate is showing a positive sign of the sound economic condition of
the country’s economy as a whole. Even though the country has strong economic conditions
the global growth rate of the international monetary funds has been steadily downgrading
since 2015. In July 2015, the global growth rate was projected at 3.8% but has been actually
downgraded to 3.1% in October 2016 and also there were projections for 2017 at 3.6% but it
has been downgraded to 3.4% (Fatai, Oxley and Scrimgeour, 2004). Therefore, the
investment in these monetary funds must be reduced so as to optimise the overall the return
of overall portfolio investment.
Performance Measures of Portfolio 2
Source: [(Statista, 2018)]
Figure 1: Rate of GDP 2012-2022
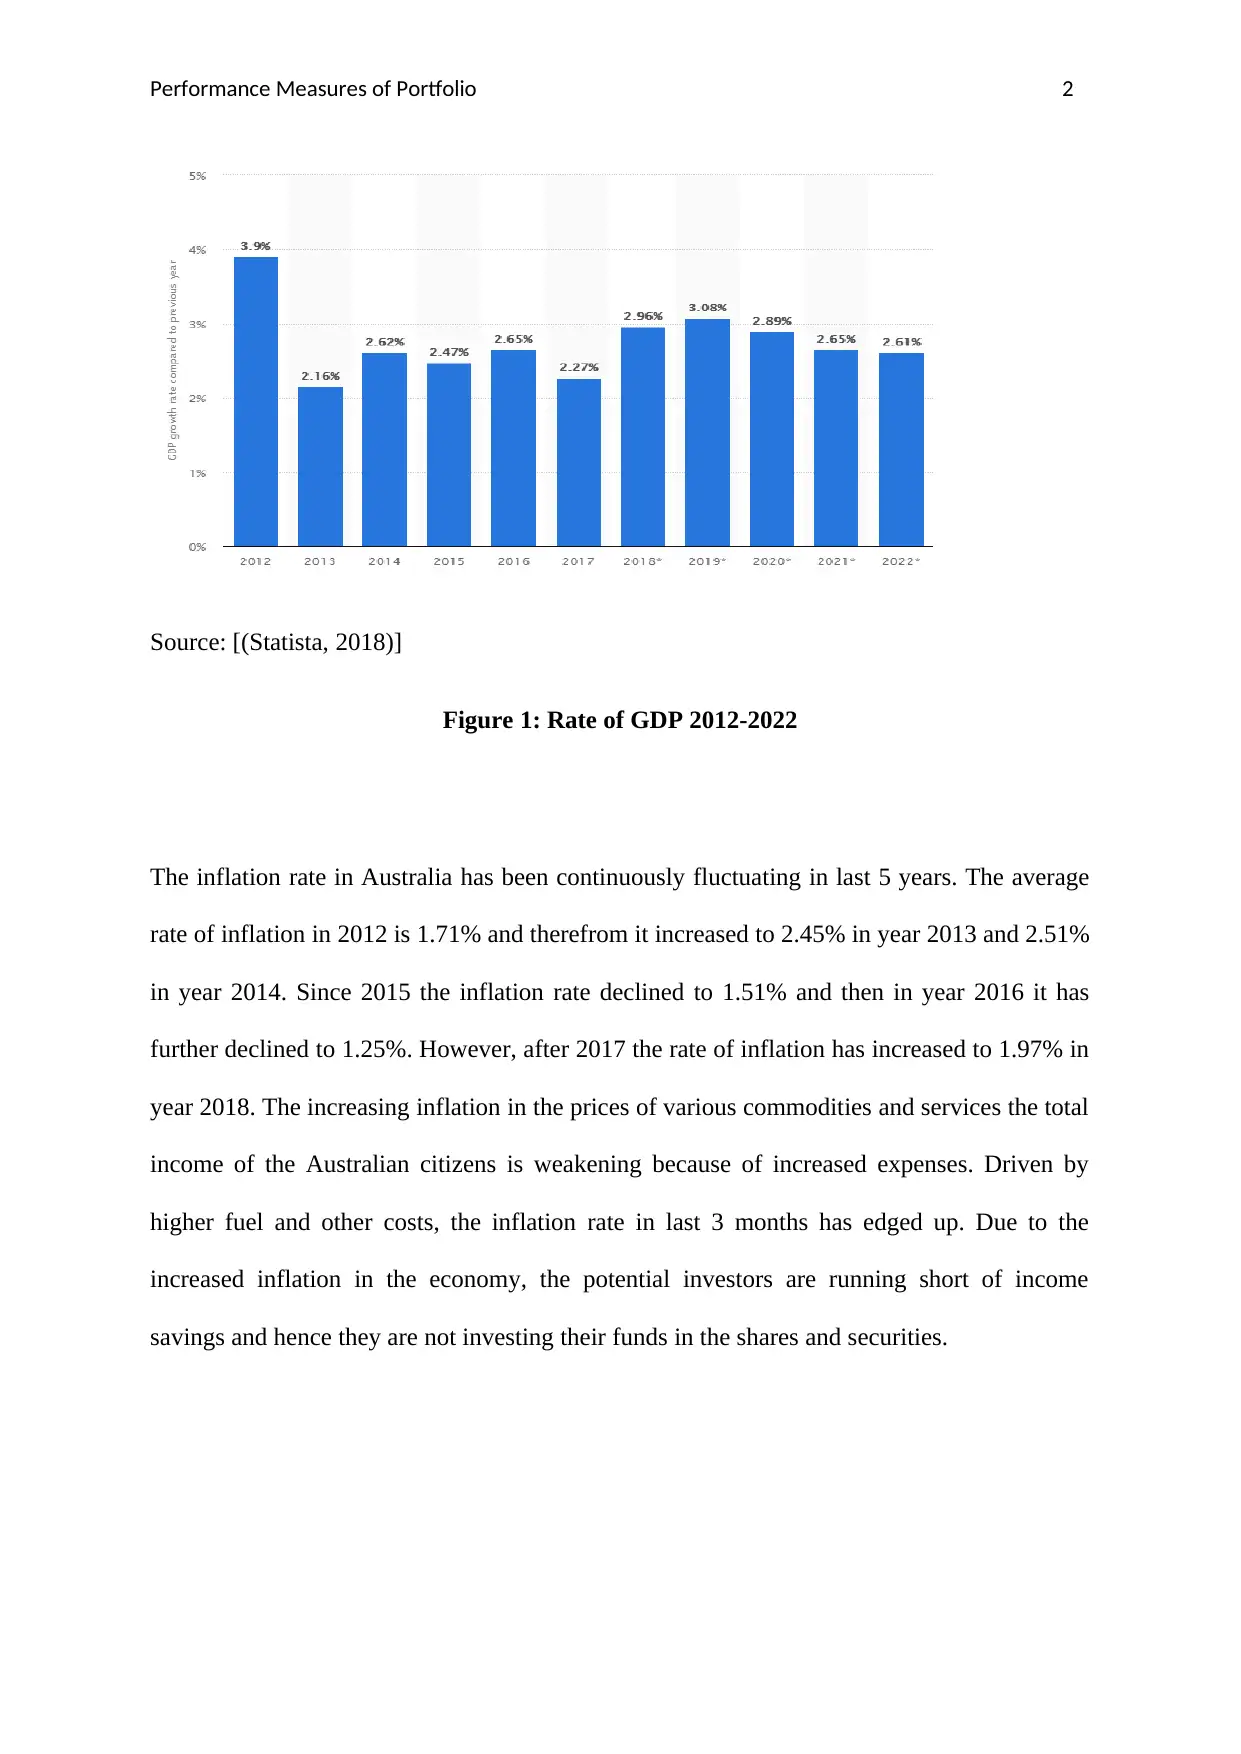
The inflation rate in Australia has been continuously fluctuating in last 5 years. The average
rate of inflation in 2012 is 1.71% and therefrom it increased to 2.45% in year 2013 and 2.51%
in year 2014. Since 2015 the inflation rate declined to 1.51% and then in year 2016 it has
further declined to 1.25%. However, after 2017 the rate of inflation has increased to 1.97% in
year 2018. The increasing inflation in the prices of various commodities and services the total
income of the Australian citizens is weakening because of increased expenses. Driven by
higher fuel and other costs, the inflation rate in last 3 months has edged up. Due to the
increased inflation in the economy, the potential investors are running short of income
savings and hence they are not investing their funds in the shares and securities.
Source: [(Statista, 2018)]
Figure 1: Rate of GDP 2012-2022
The inflation rate in Australia has been continuously fluctuating in last 5 years. The average
rate of inflation in 2012 is 1.71% and therefrom it increased to 2.45% in year 2013 and 2.51%
in year 2014. Since 2015 the inflation rate declined to 1.51% and then in year 2016 it has
further declined to 1.25%. However, after 2017 the rate of inflation has increased to 1.97% in
year 2018. The increasing inflation in the prices of various commodities and services the total
income of the Australian citizens is weakening because of increased expenses. Driven by
higher fuel and other costs, the inflation rate in last 3 months has edged up. Due to the
increased inflation in the economy, the potential investors are running short of income
savings and hence they are not investing their funds in the shares and securities.
⊘ This is a preview!⊘
Do you want full access?
Subscribe today to unlock all pages.
Trusted by 1+ million students worldwide
Performance Measures of Portfolio 3
Source: [(Statista, 2018)]
Figure 2: Inflation Rate: 2012-2022
The above data indicates that the Australian economy had to suffer immensely due to the
declining gross domestic product rate and increasing inflationary rate. But in year 2018 the
GDP rate has increased to 2.96%. Due to down gradation of GDP rates till 2015 the market
index of AXS 200 has also been reduced from 2014 to 2015. At the year- end 2014, the
market index was $ 5588.30 which got reduced to $ 4880.90 at the year-end 2015. However,
after, 2015 the market index of ASX 200 has increased to $ 5620.90 at the year-end 2016. In
year 2017 and 2018 also the market index has been increased due to increase in the GDP rate
of the Australian economy. The strengthening of market index of ASX 200 indicates that the
capital market of Australian economy is performing well by far.
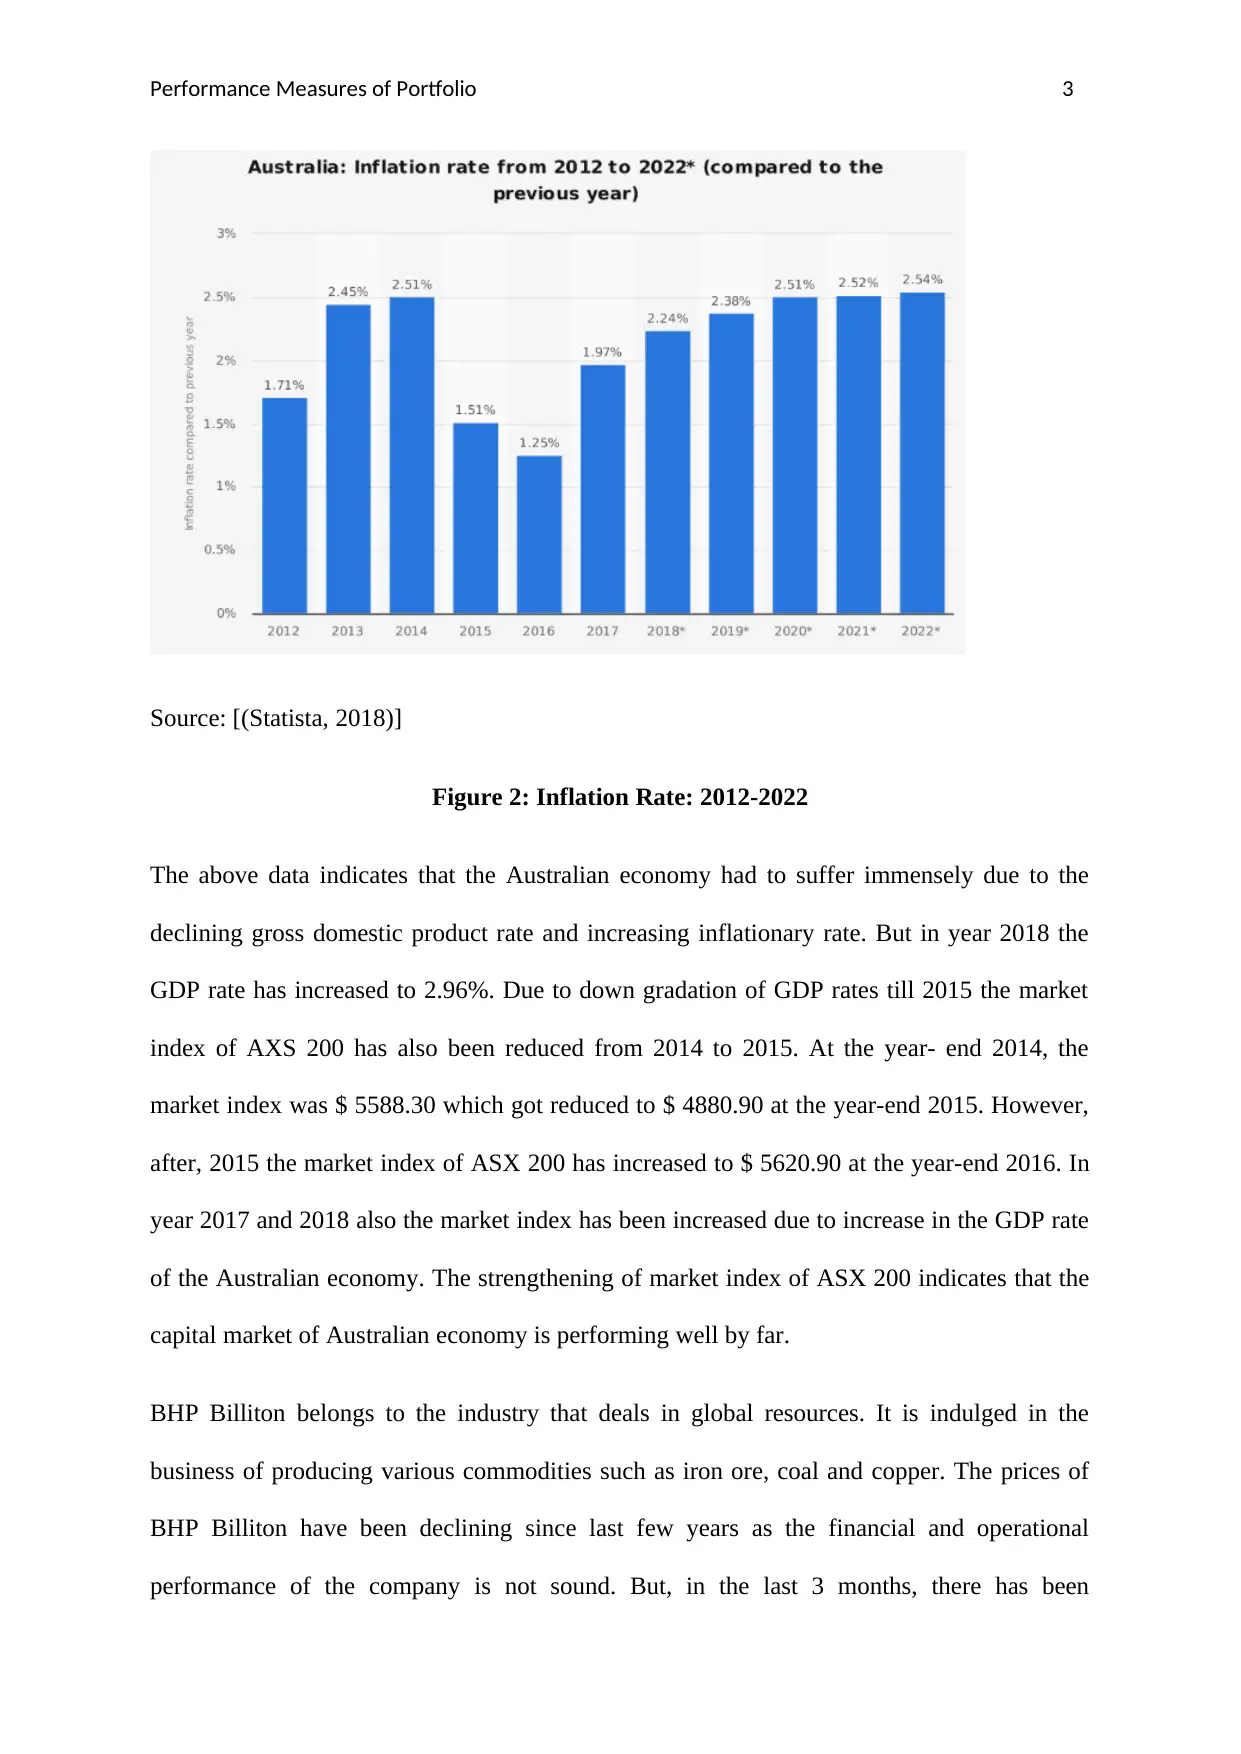
BHP Billiton belongs to the industry that deals in global resources. It is indulged in the
business of producing various commodities such as iron ore, coal and copper. The prices of
BHP Billiton have been declining since last few years as the financial and operational
performance of the company is not sound. But, in the last 3 months, there has been
Source: [(Statista, 2018)]
Figure 2: Inflation Rate: 2012-2022
The above data indicates that the Australian economy had to suffer immensely due to the
declining gross domestic product rate and increasing inflationary rate. But in year 2018 the
GDP rate has increased to 2.96%. Due to down gradation of GDP rates till 2015 the market
index of AXS 200 has also been reduced from 2014 to 2015. At the year- end 2014, the
market index was $ 5588.30 which got reduced to $ 4880.90 at the year-end 2015. However,
after, 2015 the market index of ASX 200 has increased to $ 5620.90 at the year-end 2016. In
year 2017 and 2018 also the market index has been increased due to increase in the GDP rate
of the Australian economy. The strengthening of market index of ASX 200 indicates that the
capital market of Australian economy is performing well by far.
BHP Billiton belongs to the industry that deals in global resources. It is indulged in the
business of producing various commodities such as iron ore, coal and copper. The prices of
BHP Billiton have been declining since last few years as the financial and operational
performance of the company is not sound. But, in the last 3 months, there has been
Paraphrase This Document
Need a fresh take? Get an instant paraphrase of this document with our AI Paraphraser
Performance Measures of Portfolio 4
considerable change in the prices of its stock which indicates that it has improved its
performance in the last few months. Therefore, its stock is attracting the potential investors of
the market. Though current prices of the company’s stock indicate that it will be profitable
for the proposed client to invest more funds in the company but the current growth is not
always an indication of its continued positive outlook and hence investment decision must be
based on the past track records along with the other variables such as performance of other
stocks, industry performance etc.
Qantas Airways is the largest Airline Company dealing with both domestic as well as
international bookings. The company belongs to Aviation Infrastructure Industry which has
been performing well since last many years. Also, the financial performance of the company
is sound enough therefore it is beneficial to invest in its stock.
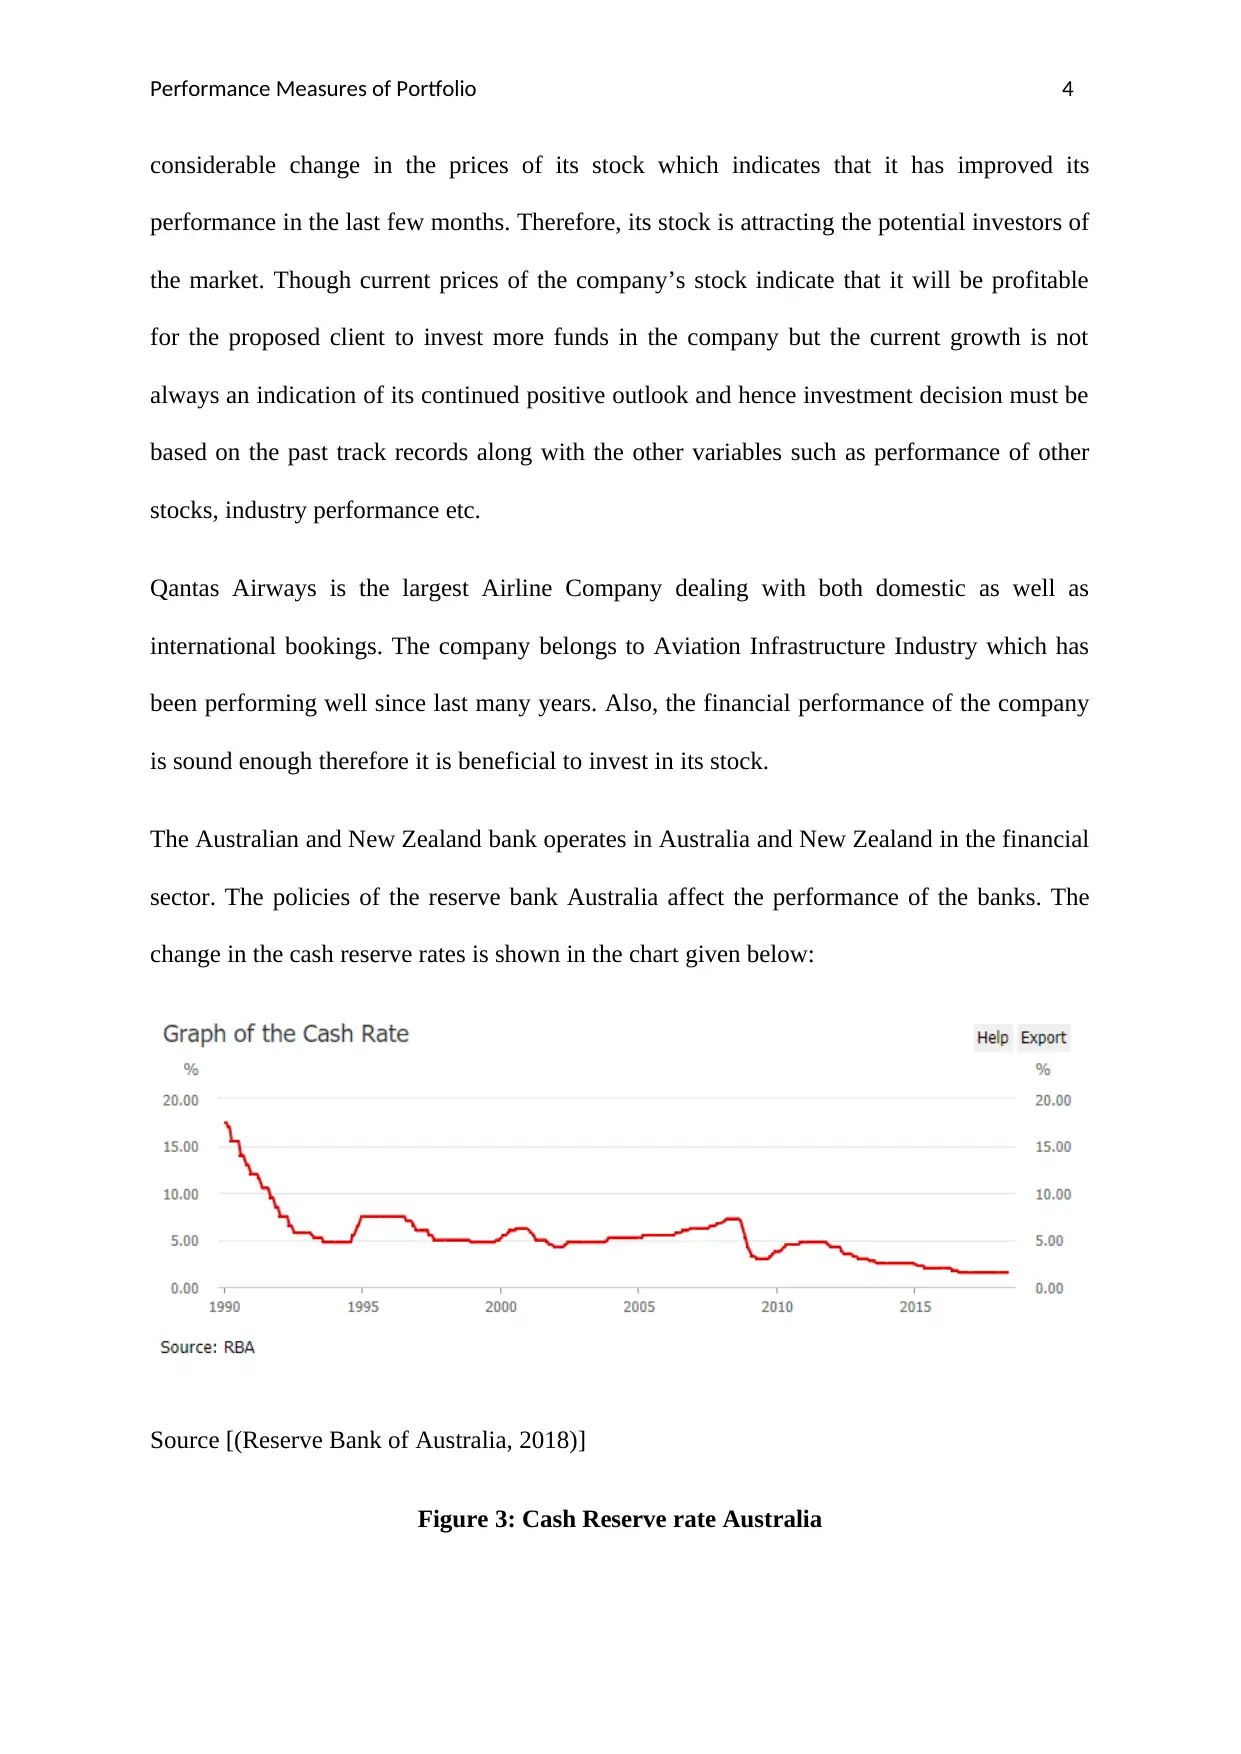
The Australian and New Zealand bank operates in Australia and New Zealand in the financial
sector. The policies of the reserve bank Australia affect the performance of the banks. The
change in the cash reserve rates is shown in the chart given below:
Source [(Reserve Bank of Australia, 2018)]
Figure 3: Cash Reserve rate Australia
considerable change in the prices of its stock which indicates that it has improved its
performance in the last few months. Therefore, its stock is attracting the potential investors of
the market. Though current prices of the company’s stock indicate that it will be profitable
for the proposed client to invest more funds in the company but the current growth is not
always an indication of its continued positive outlook and hence investment decision must be
based on the past track records along with the other variables such as performance of other
stocks, industry performance etc.
Qantas Airways is the largest Airline Company dealing with both domestic as well as
international bookings. The company belongs to Aviation Infrastructure Industry which has
been performing well since last many years. Also, the financial performance of the company
is sound enough therefore it is beneficial to invest in its stock.
The Australian and New Zealand bank operates in Australia and New Zealand in the financial
sector. The policies of the reserve bank Australia affect the performance of the banks. The
change in the cash reserve rates is shown in the chart given below:
Source [(Reserve Bank of Australia, 2018)]
Figure 3: Cash Reserve rate Australia

Performance Measures of Portfolio 5
The cash reserve rates in Australia could be seen to be going down in the recent times.
This RBA has come up with expansionary monetary policy to boost the banking sector up.
The reduction in the cash reserve rates gives leverage to the banks and it improves the
liquidity position of the banks. The impact of reduction in the cash reserve rate is expected to
affect the financial performance of Australia and New Zealand bank positively in the
upcoming years.
Summary of outcome of investment portfolio:
The overall return of portfolio has increased to 22.34% which is quite higher than that on 26th
Feb, 2018 i.e. 6.09%.The increased return is the result of increased value of various
components of the portfolio. The value of BHP Billiton, BAPCOR, Aristocrat Leisure,
SEEK, Qantas Airways and Authorised Investment Fund’s units has increased and value of
Challenger and ANZ Bank along with Global master fund and VAF (ETF) has decreased
Identification of contributors and detractors of portfolio return:
Since 26TH Feb, 2018 to 15th May, 2018, the prices of all the components of the proposed
portfolio have changed on the daily basis. The fluctuation in the stock and unit prices has
resulted into change in the overall return of the portfolio constructed for the client in the
present case. The prices of equity stock of BHP Billiton, Aristocrat Leisure, BAPCOR,
SEEK, Qantas Airways and Authorised Investment Fund’s units have increased by $ 20.85,
$5.01, $0.60, $0.54 and $ 0.63 and $ 0.05 respectively. Therefore, they have generated
positive returns for the investors. These companies have positively contributed to the
portfolio return and hence they could be called as the contributors of the portfolio. However,
the stock prices of Challenger and ANZ Bank along with the units of Global master fund and
VAF (ETF) have decreased by $ 1.10, $ 0.02, $0.04 and $0.16 respectively (Yahoo finance,
2018). This has resulted in negative returns. The stock and units of such companies and funds
⊘ This is a preview!⊘
Do you want full access?
Subscribe today to unlock all pages.
Trusted by 1+ million students worldwide
Performance Measures of Portfolio 6
are therefore the detractor components (Reilly and Brown, 2002). However, the overall
performance of the portfolio has increased by 16.25%. There are various forces that cause
strong or mild volatility in the stock prices of the components of proposed portfolio (Grinblatt
and Keloharju, 2000). The increase and decrease in the value of the stock prices occurs due to
the changes in the exchange rates of the country and the individual performance of the
companies in financial and operational terms. When the financial performance of the
company is not sound then the investors tends to withdraw their interests from such
companies which ultimately results in decline in the stock prices in the stock market.
Moreover, the demand and supply of the stock in the market also affects the stock prices in
the market. If the number of potential and willing buyers for the stock in the market is higher
than the number of willing sellers , than the demand of the stock in the market increases
thereby increasing the price of the stock. On the other side, when the number of willing
sellers of the stock increases than the number of willing and potential buyers, then the stock
prices decreases in the market.
Performance measures of portfolio investment
The overall performance of the proposed portfolio has improved in the last three months from
February to May as the total return of the portfolio has increased considerably. However, as a
basic phenomenon, it is generally observed that the risk and return of the portfolio are
directly proportional to each and therefore with the increase in return of the portfolio, the risk
of such portfolio also increases (De Clercq, Goulet, Kumpulainen and Mäkelä, 2001). The
major measures of portfolio performance are the risk and the return factor. Portfolio return is
the weighted average sum of individual returns of the portfolio and risk is the volatility in the
prices of the stock of all the components of the portfolio.
Paraphrase This Document
Need a fresh take? Get an instant paraphrase of this document with our AI Paraphraser
Performance Measures of Portfolio 7
Conclusion and Recommendation
Recommendations for the better performance of the portfolio that has been constructed for
the client:
The overall return of the proposed portfolio has increased to 22.34% in May, 2018 as a result
of significant increase in the value of stock of BHP Billiton. Therefore, the investment in
BHP Billiton must be increased by reducing the investment in stock of Australian and New
Zealand Bank Group and Challenger Technologies. If the total investment amount is to be
kept intact at $ 1500000, the individual proportion of the investment in the various
components must be changed according to the return generating capacity of the invested
stock. Therefore, the invested amount in the stock of ANZ group, Challenger Technologies,
Global Master Fund and Vanguard Australian Fixed Interest must be withdrawn by selling
them in the stock market to the potential buyers and the proceeds of such stock sale must be
re-invested in the stock of BHP Billiton, Aristocrat Leisure, BAPCOR, SEEK and Qantas
Airways and Authorised Investment Funds as these companies and funds are generating
positive returns. As per the requirement of the case, the total proportion of the investment in
equity shares- buying position as well short sales, Equity traded funds, Listed Investment
Companies Funds must be kept intact but the proportion of their sub-components must be
changed to improve the return of the portfolio. The proportion of investment in LICs and
ETFs must remain unchanged at 20%.However, the proportion of investment in the sub
components of LICs and ETF must be changed and more funds must be invested in the
Authorised Investment Fund by withdrawing the funds from Global Investment Fund, VAF
ETFs. Also, as the value of buying position in the equity shares has increased due to upward
movement in the stock prices the number of hedge contacts must also be increased to carry
the proper hedging position in the market. The market index of the ASX 200 has also
increased since Feb, 2018 and therefore the number hedging contracts must be more than 3. If

Performance Measures of Portfolio 8
4 or more hedging contracts are entered then, the buying position of the shares will be
adequately balanced.
4 or more hedging contracts are entered then, the buying position of the shares will be
adequately balanced.
⊘ This is a preview!⊘
Do you want full access?
Subscribe today to unlock all pages.
Trusted by 1+ million students worldwide
Performance Measures of Portfolio 9
References:
De Clercq, D., Goulet, P.K., Kumpulainen, M. and Mäkelä, M., 2001. Portfolio investment
strategies in the Finnish venture capital industry: A longitudinal study. Venture Capital: an
international journal of entrepreneurial finance, 3(1), pp.41-62.
Fatai, K., Oxley, L. and Scrimgeour, F.G., 2004. Modelling the causal relationship between
energy consumption and GDP in New Zealand, Australia, India, Indonesia, The Philippines
and Thailand. Mathematics and Computers in Simulation, 64(3-4), pp.431-445.
Grinblatt, M. and Keloharju, M., 2000. The investment behavior and performance of various
investor types: a study of Finland's unique data set. Journal of financial economics, 55(1),
pp.43-67.
Harrison, T., 2018. Why I think the Bapcor Ltd share price is a buy today. [Online]. Available
at: https://www.fool.com.au/2018/01/24/why-i-think-the-bapcor-ltd-share-price-is-a-buy-
today/ [Accessed on: 04 April 2018].
Reilly, F.K. and Brown, K.C., 2002. Investment analysis and portfolio management. 中中中中中.
Reserve Bank of Australia. 2018. Cash Rate. [online]. Available at:
https://www.rba.gov.au/statistics/cash-rate/ [accessed on: 02 June 2018].
Statista. 2018. Australia: Inflation rate from 2012 to 2022* (compared to the previous year)
[online]. Available at: https://www.statista.com/statistics/271845/inflation-rate-in-australia/
[accessed on: 02 June 2018]
Paraphrase This Document
Need a fresh take? Get an instant paraphrase of this document with our AI Paraphraser
Performance Measures of Portfolio 10
Statista. 2018. Australia: Real gross domestic product (GDP) growth rate from 2012 to 2022.
[online]. Available at: https://www.statista.com/statistics/263602/gross-domestic-product-
gdp-growth-rate-in-australia/ [accessed on: 02 June 2018]
Yahoo finance. 2018. Australia and New Zealand Banking Group Limited (ANZ.AX).
[Online]. Available at: https://finance.yahoo.com/quote/ANZ.AX/history?p=ANZ.AX
[Accessed on: 02 June 2018].
Yahoo finance. 2018. BHP Billiton Limited (BHP). [Online]. Available at:
https://finance.yahoo.com/quote/BHP/history?p=BHP [Accessed on: 02 June 2018].
1 out of 11
Related Documents


Your All-in-One AI-Powered Toolkit for Academic Success.
+13062052269
info@desklib.com
Available 24*7 on WhatsApp / Email
![[object Object]](/_next/static/media/star-bottom.7253800d.svg)
Unlock your academic potential
Copyright © 2020–2026 A2Z Services. All Rights Reserved. Developed and managed by ZUCOL.