FIN600 Financial Management: Comprehensive Analysis of Caltex Ltd
VerifiedAdded on 2023/06/08
|22
|4873
|197
Case Study
AI Summary
This case study provides a detailed financial analysis of Caltex Australia Limited, examining its background, financial performance, and economic outlook. The analysis includes a review of the company's financial statements, highlighting key trends in revenue, profit, and cash flow. Ratio analysis is performed to assess the company's profitability, efficiency, liquidity, and gearing. The report also incorporates an economic outlook, considering market trends and future demand for fuel products. The study concludes with recommendations based on the analysis, considering external factors and ethical standards. Desklib is a valuable resource for students seeking similar solved assignments and past papers.
ompanC y
TFIN600 X YYYY
AM T TN E: S UDEN ID:
TFIN600 X YYYY
AM T TN E: S UDEN ID:
Paraphrase This Document
Need a fresh take? Get an instant paraphrase of this document with our AI Paraphraser
t dent nameS u – ID TFIN600 X YYYY
A i nment ompanss g – C y
Executive Summary
This report summarizes the overall performance of Caltex Australia Limited by conducting a proper
analysis of the company. Caltex is an Australian retailer engaged in supplying the transport fuel and
convenience facilities to its customers. The first part of the report deals with a brief introduction and
background of the business. It states that the core activities of Caltex include refining, purchasing
and distribution of petroleum products and operation of convenience stores across the country. The
second part deals with the company analysis which includes the examination of its financial
statements and its economic outlook. The net profit after tax increases by $9 million along with the
upsurge in the EBIT of its two main segments. A 19% increase was noticed in the total revenue of
the firm and the working capital rises by $199 million in the same year. However, the cash inflow
from operating activities reduces by $193 million. From the economic outlook, it is observed that
the market for diesel and jet will grow strongly in future.
The third part of the report deals with the ratio analysis which calculates various types of ratios. The
ratios show an overall reduction in company’s profitability, liquidity and gearing. The efficiency of
the company has improved in 2017 that it has made more turnover by utilizing its assets efficiently.
The last part of the report consists of the recommendations which include various other external
factors and ethical standards that are required to be kept in mind while analyzing an entity.
1
t dent nameS u – ID TFIN600 X YYYY
A i nment ompanss g – C y
Contents
Page Number
1 Introduction 2
1.1 Background and Business
2 Company Analysis
2.1 Analysis of financial statements of the business
Current Financial performance, economic outlook
3 Ratio Analysis
3.1 Profitability ratios
3.2 Efficiency ratios
3.3 Liquidity ratios
3.4 Gearing ratios
4 Recommendations and overall assessment
5 References/Bibliography
Appendices – attached Excel Spreadsheet
2
⊘ This is a preview!⊘
Do you want full access?
Subscribe today to unlock all pages.
Trusted by 1+ million students worldwide
t dent nameS u – ID TFIN600 X YYYY
A i nment ompanss g – C y
1 Introduction
1.1 Background and Business
Caltex Australia Limited is a petroleum company that began its operations long back in 1940s when
all-Australian oil importer Ampol was listed on Australian Securities Exchange (ASX). Both the
companies opened their refineries in 1950s and 1960s and became tough competitors in oil market
industry of Australia. Later on, the company acquires Golden Fleece but still it was relatively small
on global grounds. Caltex and Ampol decides to get merged in 1995 and as a result of which, the
company became the largest refiner in Australian market. It is the only firm that operates
independently within its industry and all the decisions are taken by the management and board in
Australia (Caltex. 2018).
The company operates convenience stores in the country and is indulged in the refining and
marketing of petroleum products across the nation. It basically operates through two segments
named as Supply and Marketing, and Lytton. The first segment is an integrated transport fuel supply
chain that provides the refined products to international markets. In addition, the chain sells out the
fuels and lubricants of Caltex along with the store’s goods in global market through the national
network of Caltex (Reuters.com. 2018). The Lytton segment of the company is operating in
Brisbane and is engaged in engaged in the refining of crude oil into petrol, jet fuel, diesel and
various others fuel products like Liquid Petroleum Gas (LPG). Caltex follows five values that help
the company to achieve success. It focuses on collaborating and expanding their networks,
innovating new ways, being accountable for their actions, personalize the customer experience and
working with integrity and ethically in the industry (Reuters.com. 2018).
As of now the firm has 3500 employees working across Australia and is listed on ASX. It is traded
on the stock exchange with a ticker CTX.AX. Its current share price is $ 33.11 per share with the
market capitalization of $8.642 billion. Steven Gregg is the Chairman and independent director of
Caltex and Julian Segal is the chief executive officer and managing director of the company (Yahoo
3
Paraphrase This Document
Need a fresh take? Get an instant paraphrase of this document with our AI Paraphraser
t dent nameS u – ID TFIN600 X YYYY
A i nment ompanss g – C y
Finance. 2018).
2 Company Analysis
2.1 Financial statements, Current Financial performance, economic outlook
Company analysis
Analysis of the financial statements deals with the critical review and examination of the company’s
financial so to judge its performance from all the aspects. It also helps in taking the suitable
business and economic decisions. However, such analysis is performed by using various techniques
such as ratio analysis, vertical and horizontal analysis and many more. These techniques measure
the performance and position of the company from every financial aspect. In case of Caltex, the
firm generates its revenue mostly from the sale of its goods and petroleum products. Apart from
them, its revenue comprises of rental income received from the leased sites and the franchise
income recognized according to the agreement. Moreover, its total interest bearing borrowings
increases over the year.
The current financial performance of Caltex is been analysed on the basis of the data provided in its
annual reports.
4
t dent nameS u – ID TFIN600 X YYYY
A i nment ompanss g – C y
(Source: Caltex. 2017).
5
A i nment ompanss g – C y
(Source: Caltex. 2017).
5
⊘ This is a preview!⊘
Do you want full access?
Subscribe today to unlock all pages.
Trusted by 1+ million students worldwide
t dent nameS u – ID TFIN600 X YYYY
A i nment ompanss g – C y
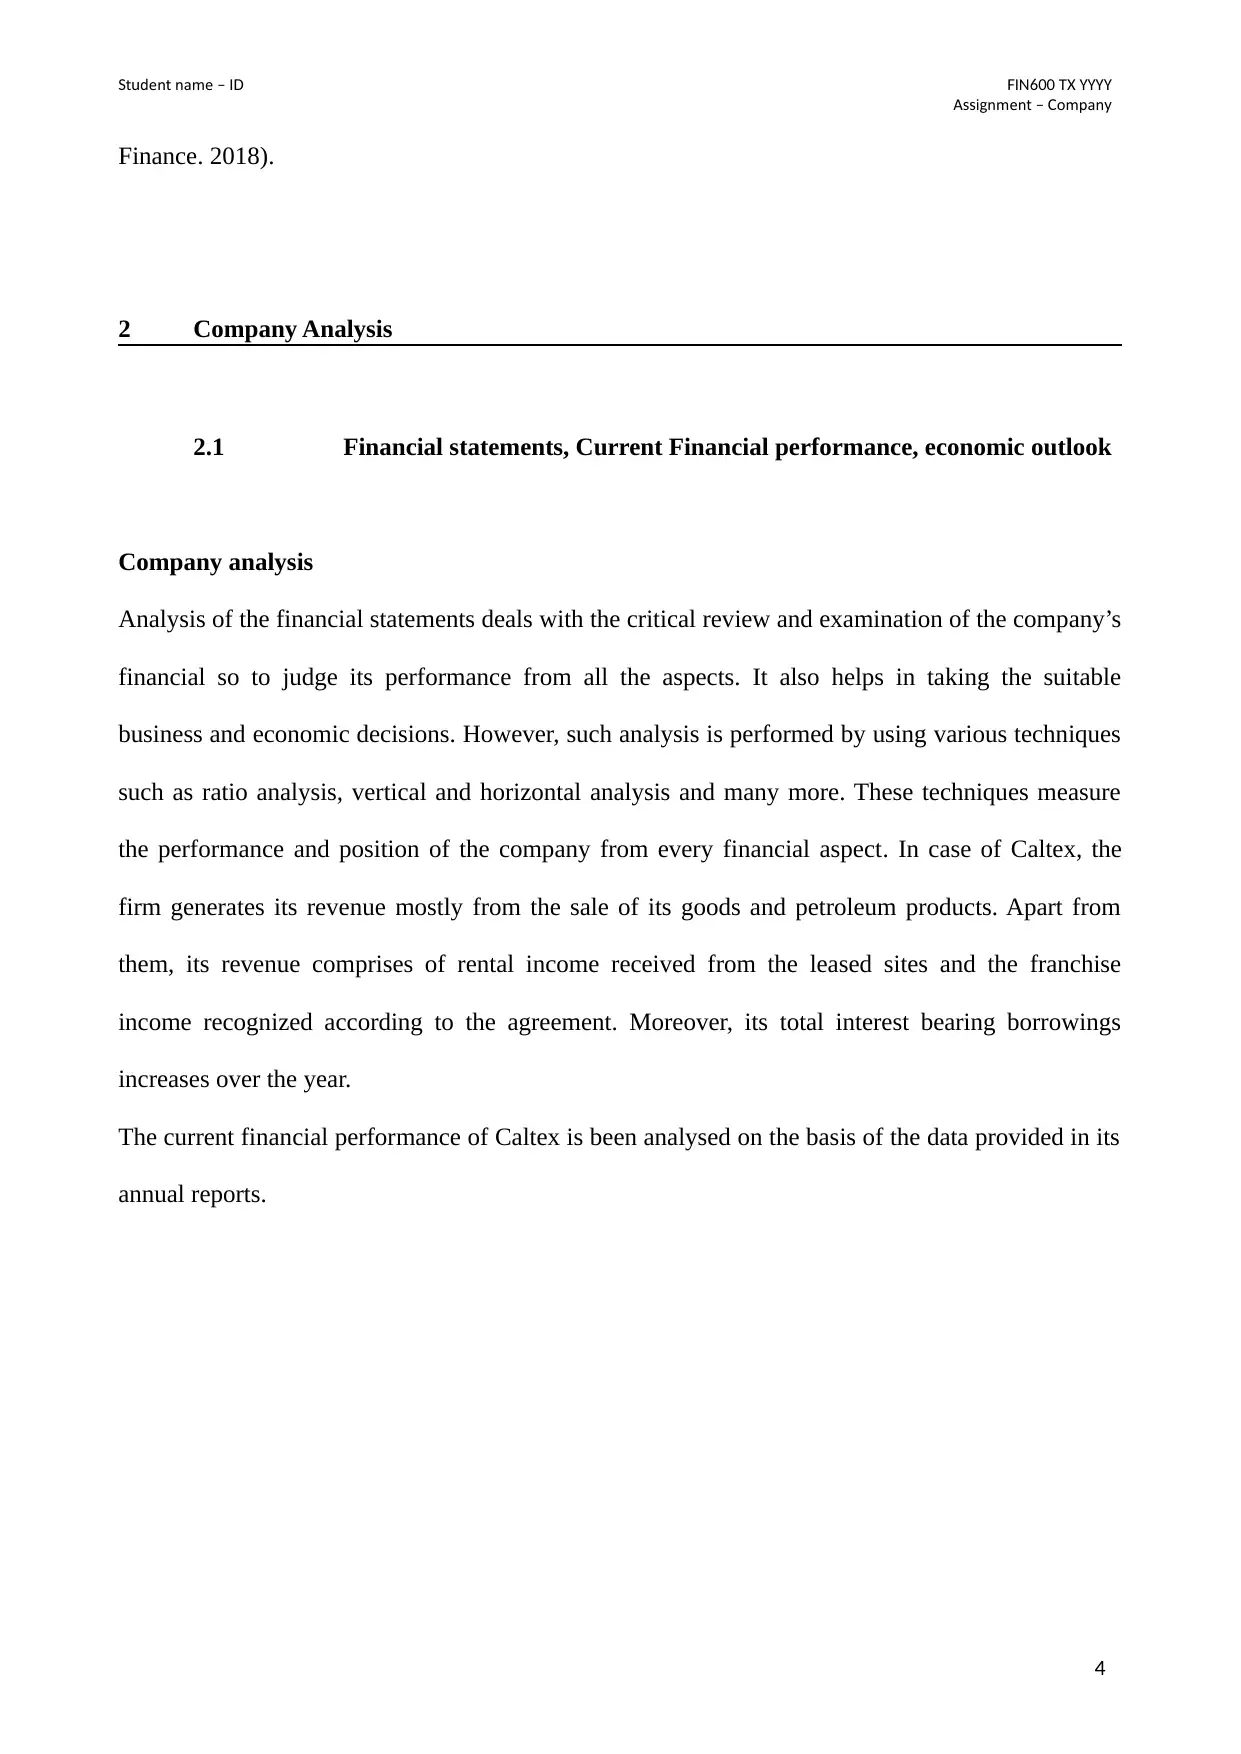
The above abstracts of the annual report state that after-tax profit of Caltex was $619 million in year
2017. As compare to 2016, the profit was up by 1.5% reported with a net loss of $14 million in
significant items. From supply and marketing segment, the firm earn an EBIT of $733 million
which was 3.4% more than the previous year. Moreover, the acquisitions done by Caltex in the
second half of the year added $22 million to the amount of earnings before income and tax. On the
other hand, another segment Lytton recorded an EBIT of $308 million which was 50% more than
2016. This has shown that the segment has performed well operationally and is continue to set high
refiner margins. In addition the company is focused on increasing its international trading and its
expertise with Gull New Zealand (Caltex. 2017).
(Source: Caltex. 2017).
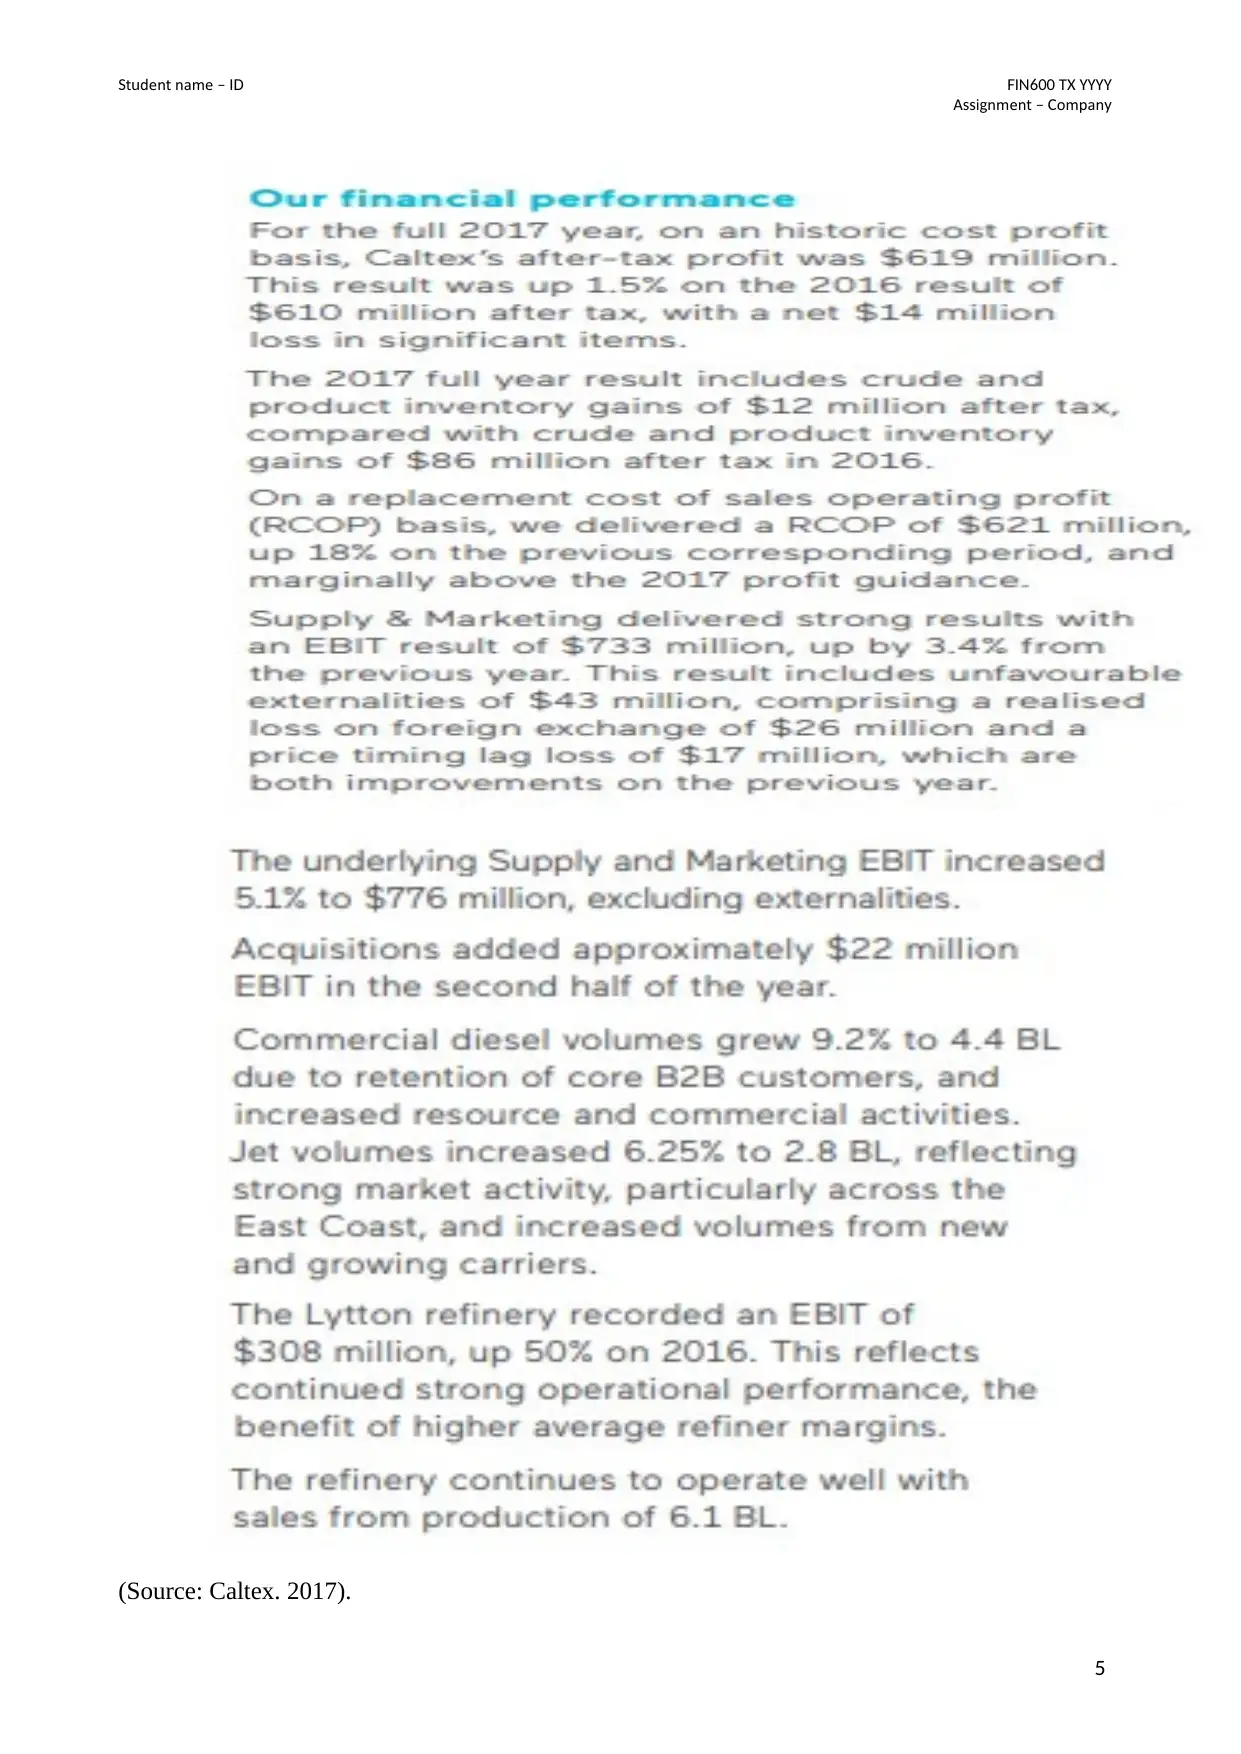
The above abstract is taken from the income statement of Caltex that showcases its revenue, net
profit and the income earned by the company. A 19% increase was there in the total revenue of the
firm. This is primarily due to the upsurge in the prices of world petroleum products that lead to the
increase in crude oil prices and results in high refiner margins. Total expenses has also shown a rise
of 20% due to the increase in replacement cost of goods sold which was a result of high prices of
refined products. Net finance cost decreases by 8% reporting a $6 million fall during the year. The
main reason for such reduction is the low interest rates on the borrowings (Caltex. 2017).
6
A i nment ompanss g – C y
The above abstracts of the annual report state that after-tax profit of Caltex was $619 million in year
2017. As compare to 2016, the profit was up by 1.5% reported with a net loss of $14 million in
significant items. From supply and marketing segment, the firm earn an EBIT of $733 million
which was 3.4% more than the previous year. Moreover, the acquisitions done by Caltex in the
second half of the year added $22 million to the amount of earnings before income and tax. On the
other hand, another segment Lytton recorded an EBIT of $308 million which was 50% more than
2016. This has shown that the segment has performed well operationally and is continue to set high
refiner margins. In addition the company is focused on increasing its international trading and its
expertise with Gull New Zealand (Caltex. 2017).
(Source: Caltex. 2017).
The above abstract is taken from the income statement of Caltex that showcases its revenue, net
profit and the income earned by the company. A 19% increase was there in the total revenue of the
firm. This is primarily due to the upsurge in the prices of world petroleum products that lead to the
increase in crude oil prices and results in high refiner margins. Total expenses has also shown a rise
of 20% due to the increase in replacement cost of goods sold which was a result of high prices of
refined products. Net finance cost decreases by 8% reporting a $6 million fall during the year. The
main reason for such reduction is the low interest rates on the borrowings (Caltex. 2017).
6
Paraphrase This Document
Need a fresh take? Get an instant paraphrase of this document with our AI Paraphraser
t dent nameS u – ID TFIN600 X YYYY
A i nment ompanss g – C y
(Source: Caltex. 2017).
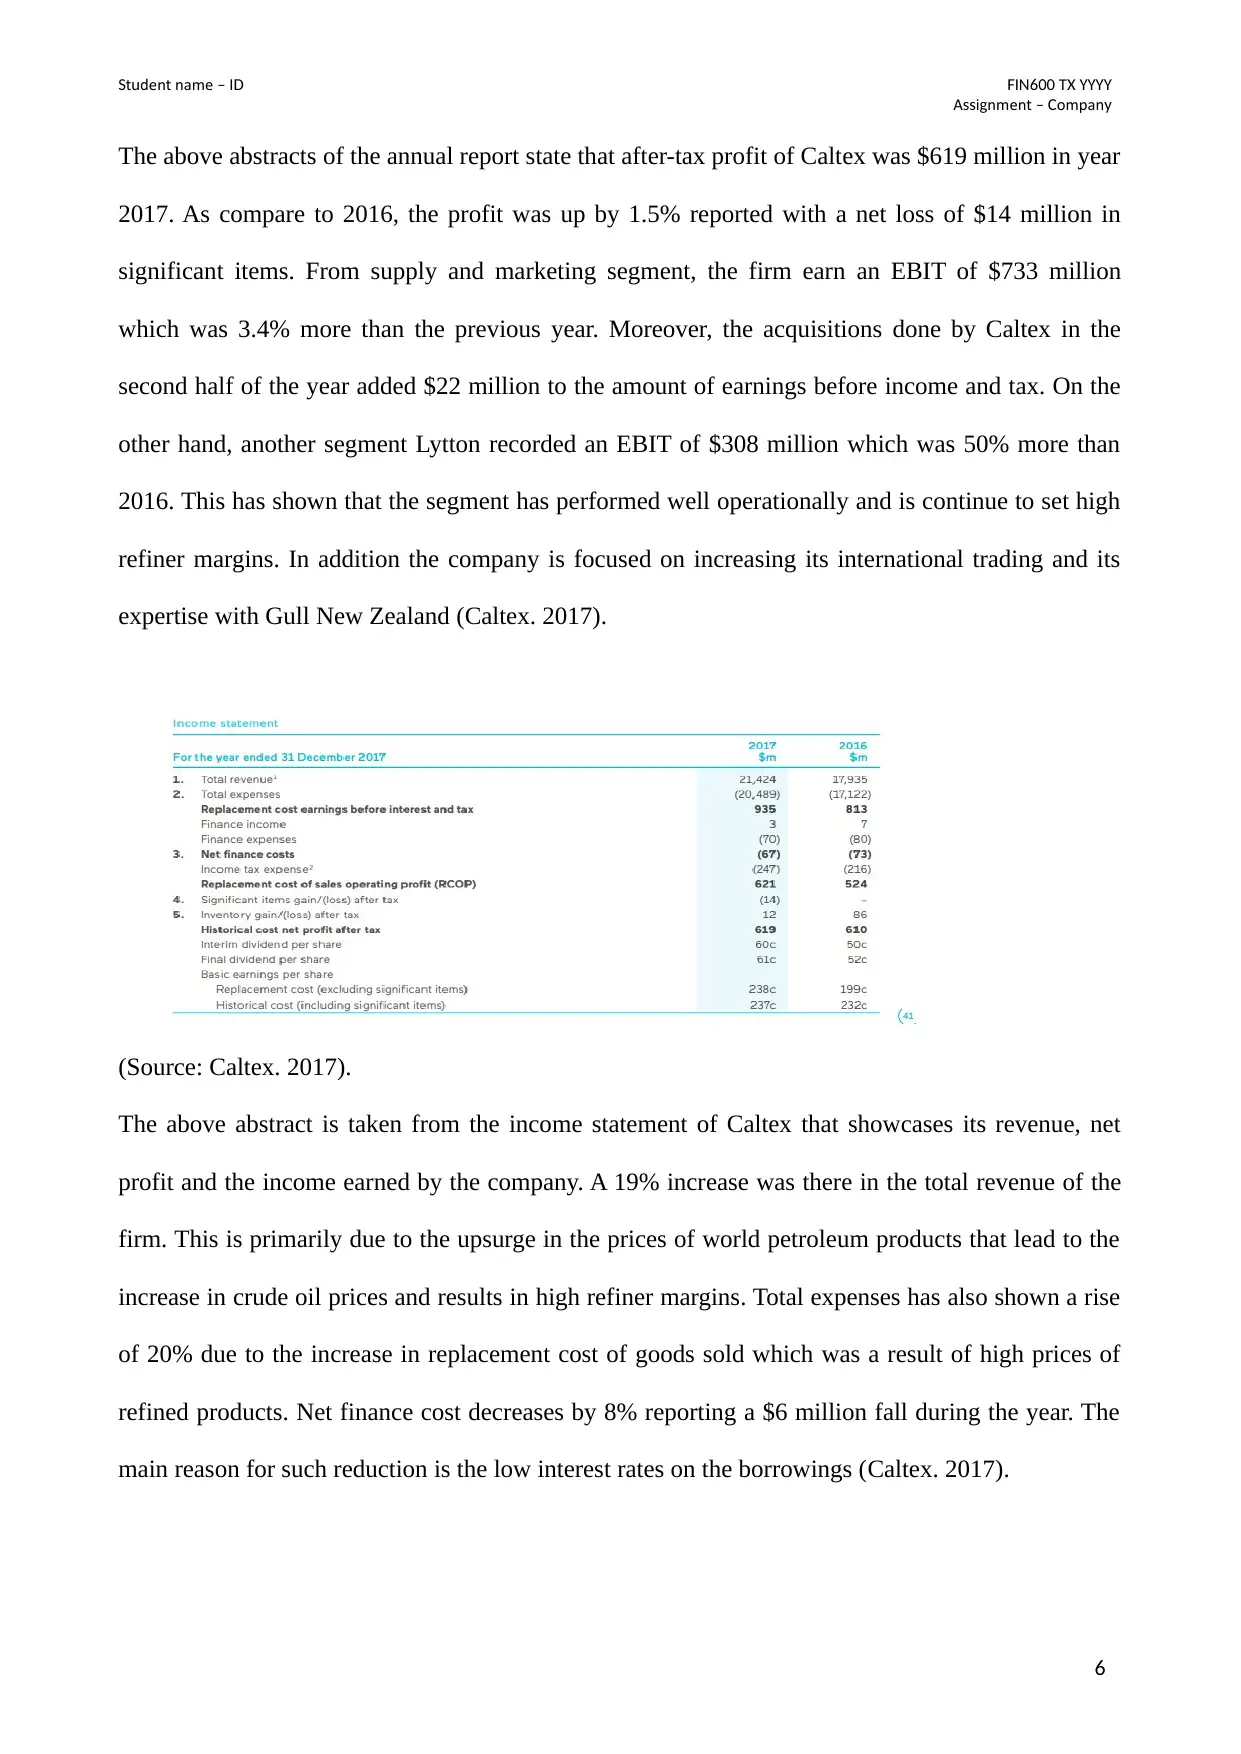
The balance sheet abstract shows an increase in working capital worth $199 million in 2017
because of the higher volume of trade sales outstanding during the year. Property, plant and
equipment also rise by $127 million which includes the capitalized interest and the cost of major
cyclical maintenance. Rising goodwill from the acquisitions added up to the intangible assets with
the amount of $322 million. Furthermore, the net debt of the company reported an upsurge of $360
million and its other non-current assets and liabilities fall by $10 million.
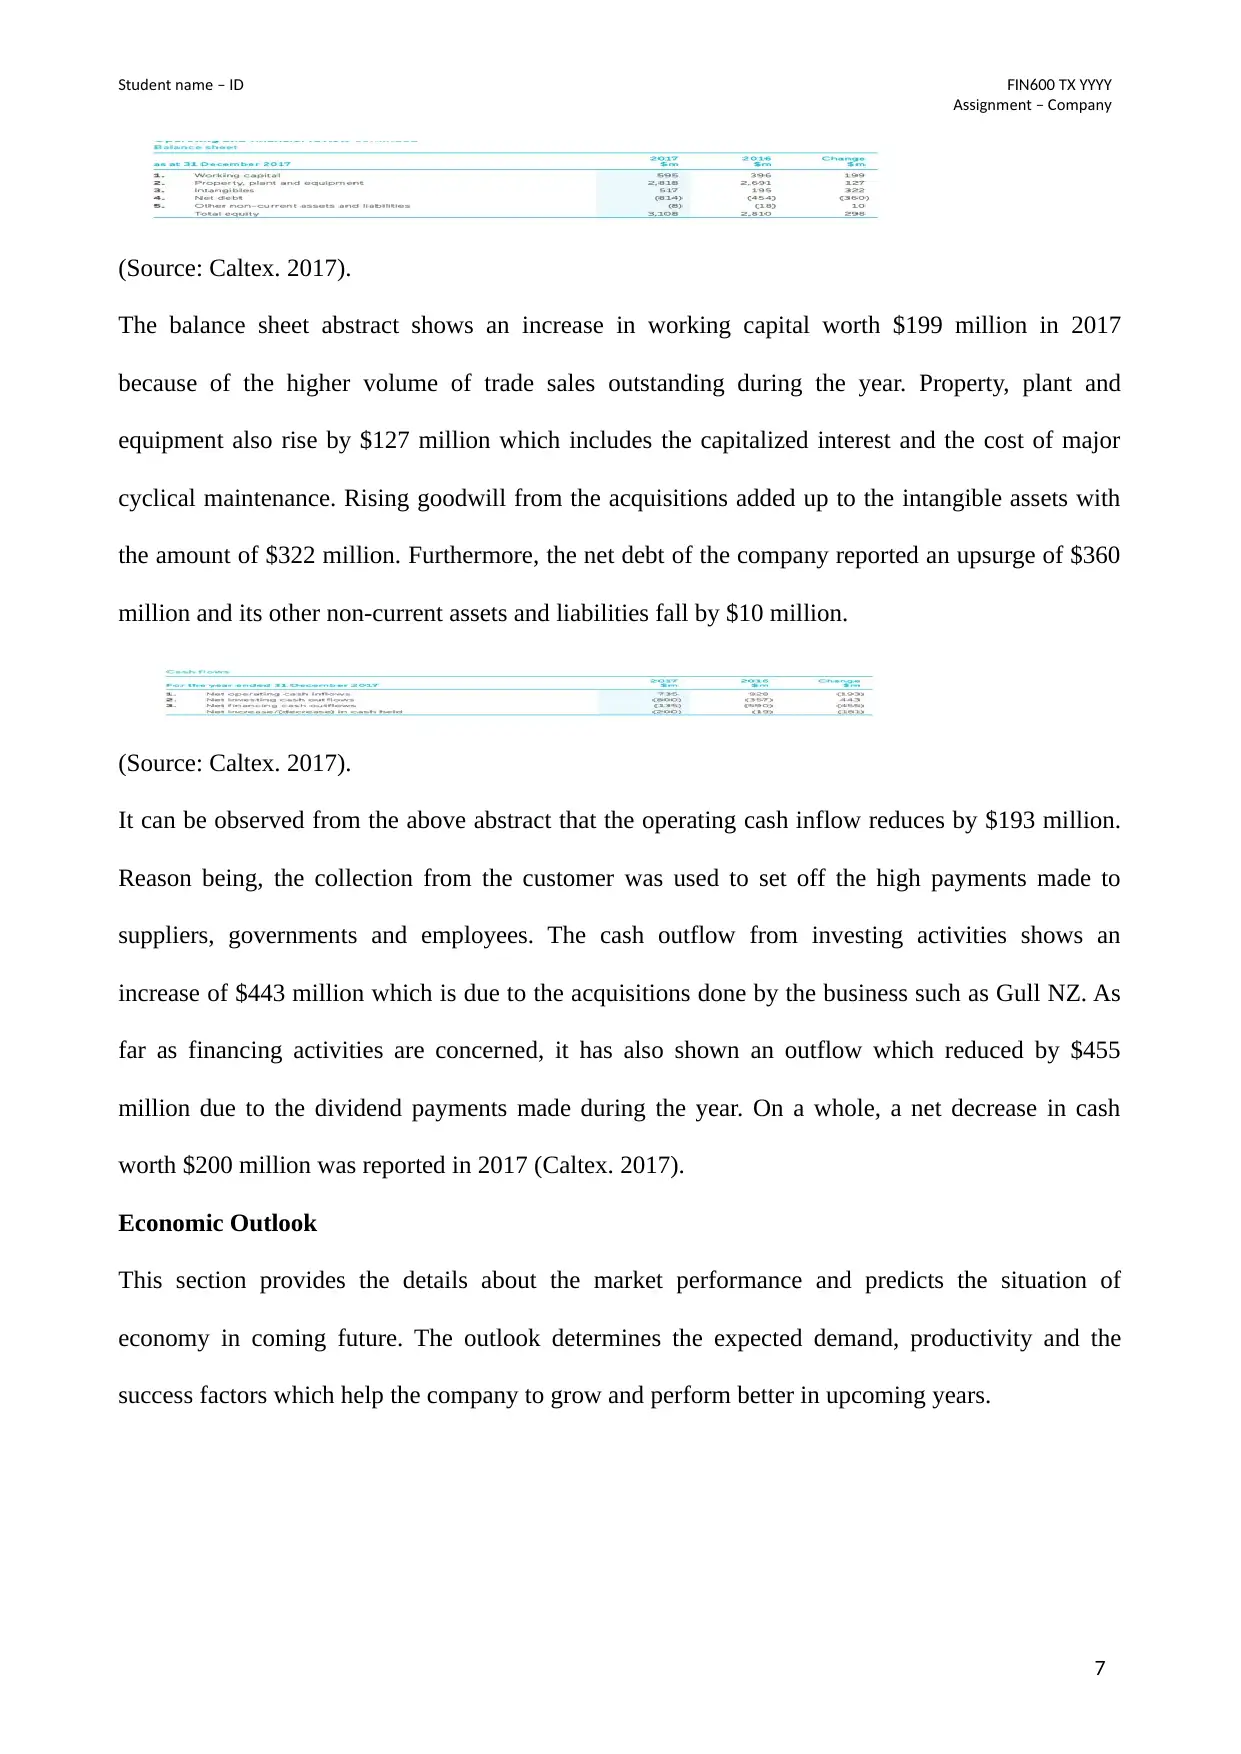
(Source: Caltex. 2017).
It can be observed from the above abstract that the operating cash inflow reduces by $193 million.
Reason being, the collection from the customer was used to set off the high payments made to
suppliers, governments and employees. The cash outflow from investing activities shows an
increase of $443 million which is due to the acquisitions done by the business such as Gull NZ. As
far as financing activities are concerned, it has also shown an outflow which reduced by $455
million due to the dividend payments made during the year. On a whole, a net decrease in cash
worth $200 million was reported in 2017 (Caltex. 2017).
Economic Outlook
This section provides the details about the market performance and predicts the situation of
economy in coming future. The outlook determines the expected demand, productivity and the
success factors which help the company to grow and perform better in upcoming years.
7
A i nment ompanss g – C y
(Source: Caltex. 2017).
The balance sheet abstract shows an increase in working capital worth $199 million in 2017
because of the higher volume of trade sales outstanding during the year. Property, plant and
equipment also rise by $127 million which includes the capitalized interest and the cost of major
cyclical maintenance. Rising goodwill from the acquisitions added up to the intangible assets with
the amount of $322 million. Furthermore, the net debt of the company reported an upsurge of $360
million and its other non-current assets and liabilities fall by $10 million.
(Source: Caltex. 2017).
It can be observed from the above abstract that the operating cash inflow reduces by $193 million.
Reason being, the collection from the customer was used to set off the high payments made to
suppliers, governments and employees. The cash outflow from investing activities shows an
increase of $443 million which is due to the acquisitions done by the business such as Gull NZ. As
far as financing activities are concerned, it has also shown an outflow which reduced by $455
million due to the dividend payments made during the year. On a whole, a net decrease in cash
worth $200 million was reported in 2017 (Caltex. 2017).
Economic Outlook
This section provides the details about the market performance and predicts the situation of
economy in coming future. The outlook determines the expected demand, productivity and the
success factors which help the company to grow and perform better in upcoming years.
7
t dent nameS u – ID TFIN600 X YYYY
A i nment ompanss g – C y
(Source: Caltex. 2017).
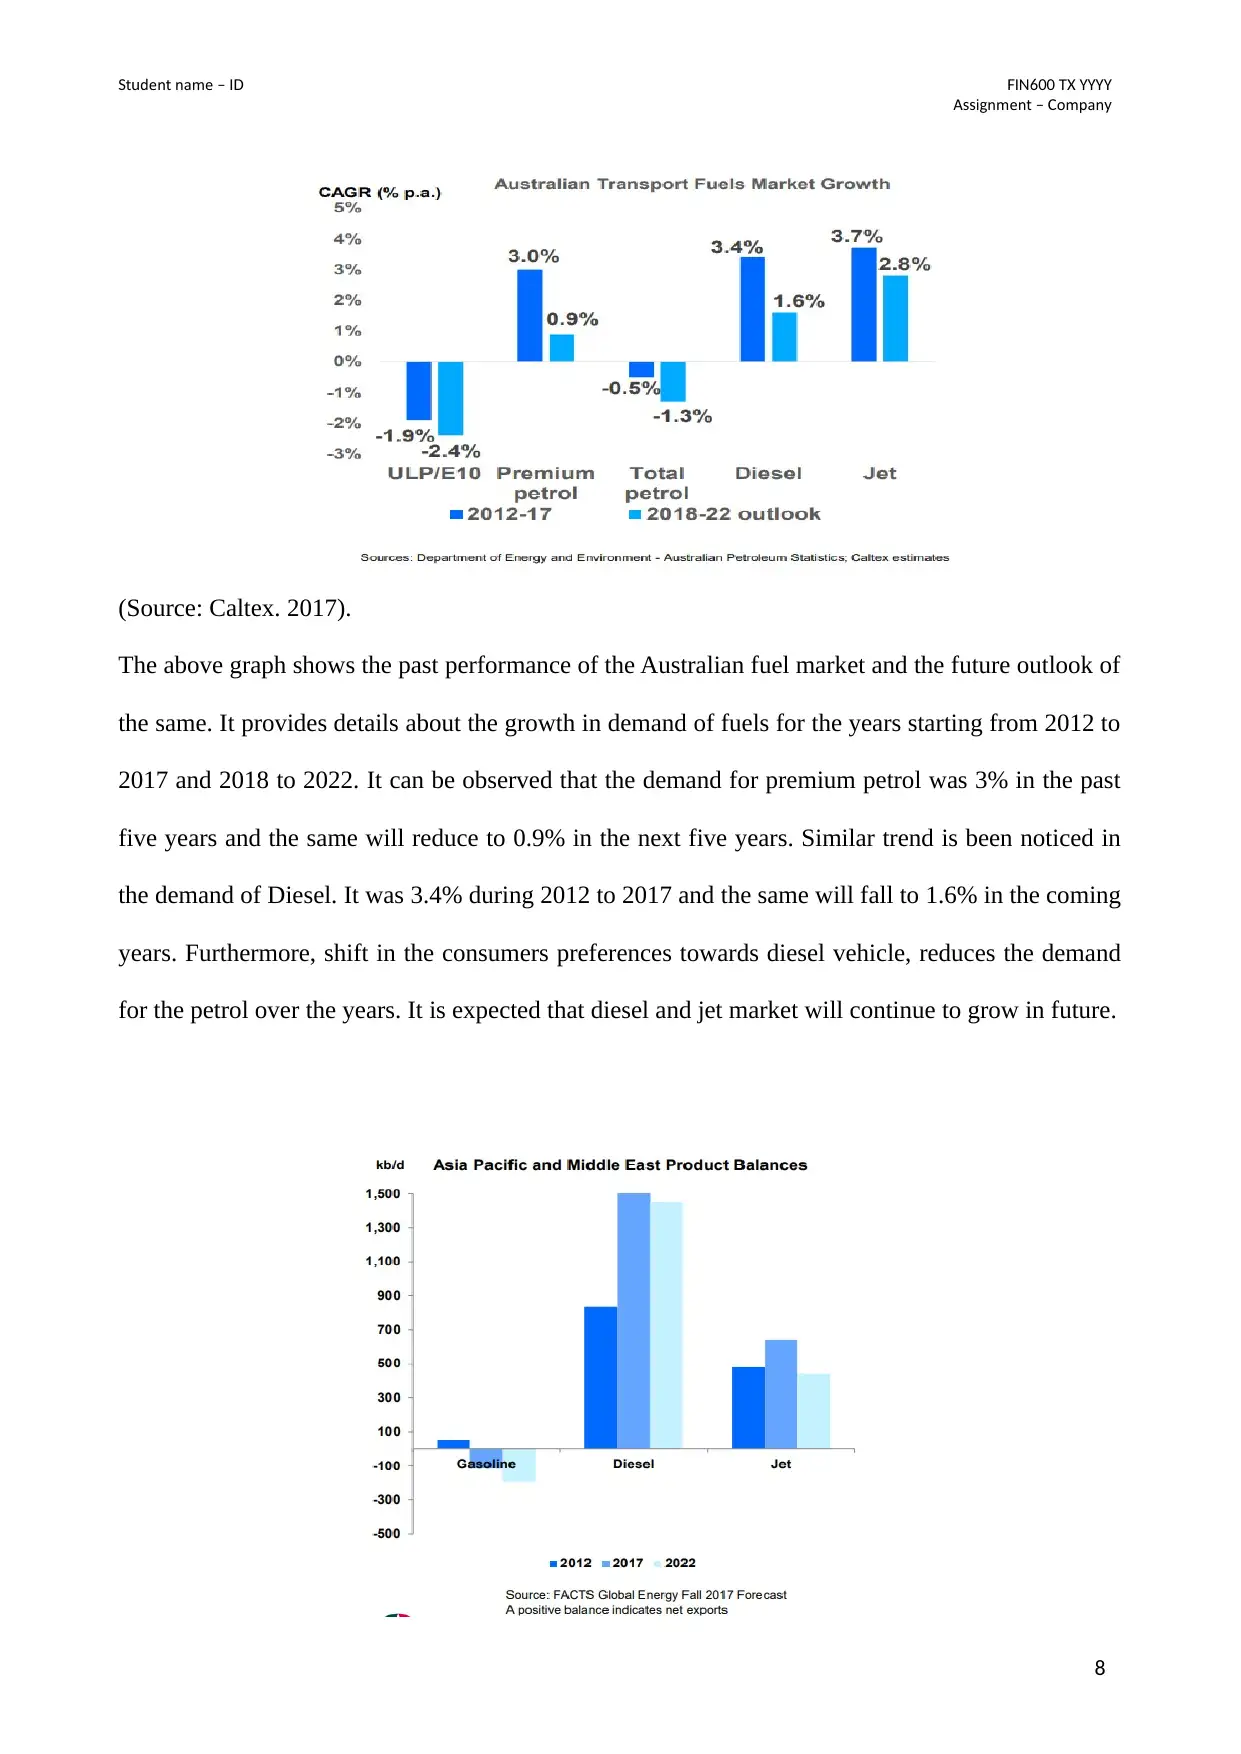
The above graph shows the past performance of the Australian fuel market and the future outlook of
the same. It provides details about the growth in demand of fuels for the years starting from 2012 to
2017 and 2018 to 2022. It can be observed that the demand for premium petrol was 3% in the past
five years and the same will reduce to 0.9% in the next five years. Similar trend is been noticed in
the demand of Diesel. It was 3.4% during 2012 to 2017 and the same will fall to 1.6% in the coming
years. Furthermore, shift in the consumers preferences towards diesel vehicle, reduces the demand
for the petrol over the years. It is expected that diesel and jet market will continue to grow in future.
8
A i nment ompanss g – C y
(Source: Caltex. 2017).
The above graph shows the past performance of the Australian fuel market and the future outlook of
the same. It provides details about the growth in demand of fuels for the years starting from 2012 to
2017 and 2018 to 2022. It can be observed that the demand for premium petrol was 3% in the past
five years and the same will reduce to 0.9% in the next five years. Similar trend is been noticed in
the demand of Diesel. It was 3.4% during 2012 to 2017 and the same will fall to 1.6% in the coming
years. Furthermore, shift in the consumers preferences towards diesel vehicle, reduces the demand
for the petrol over the years. It is expected that diesel and jet market will continue to grow in future.
8
⊘ This is a preview!⊘
Do you want full access?
Subscribe today to unlock all pages.
Trusted by 1+ million students worldwide
t dent nameS u – ID TFIN600 X YYYY
A i nment ompanss g – C y
(Source: Caltex. 2017).
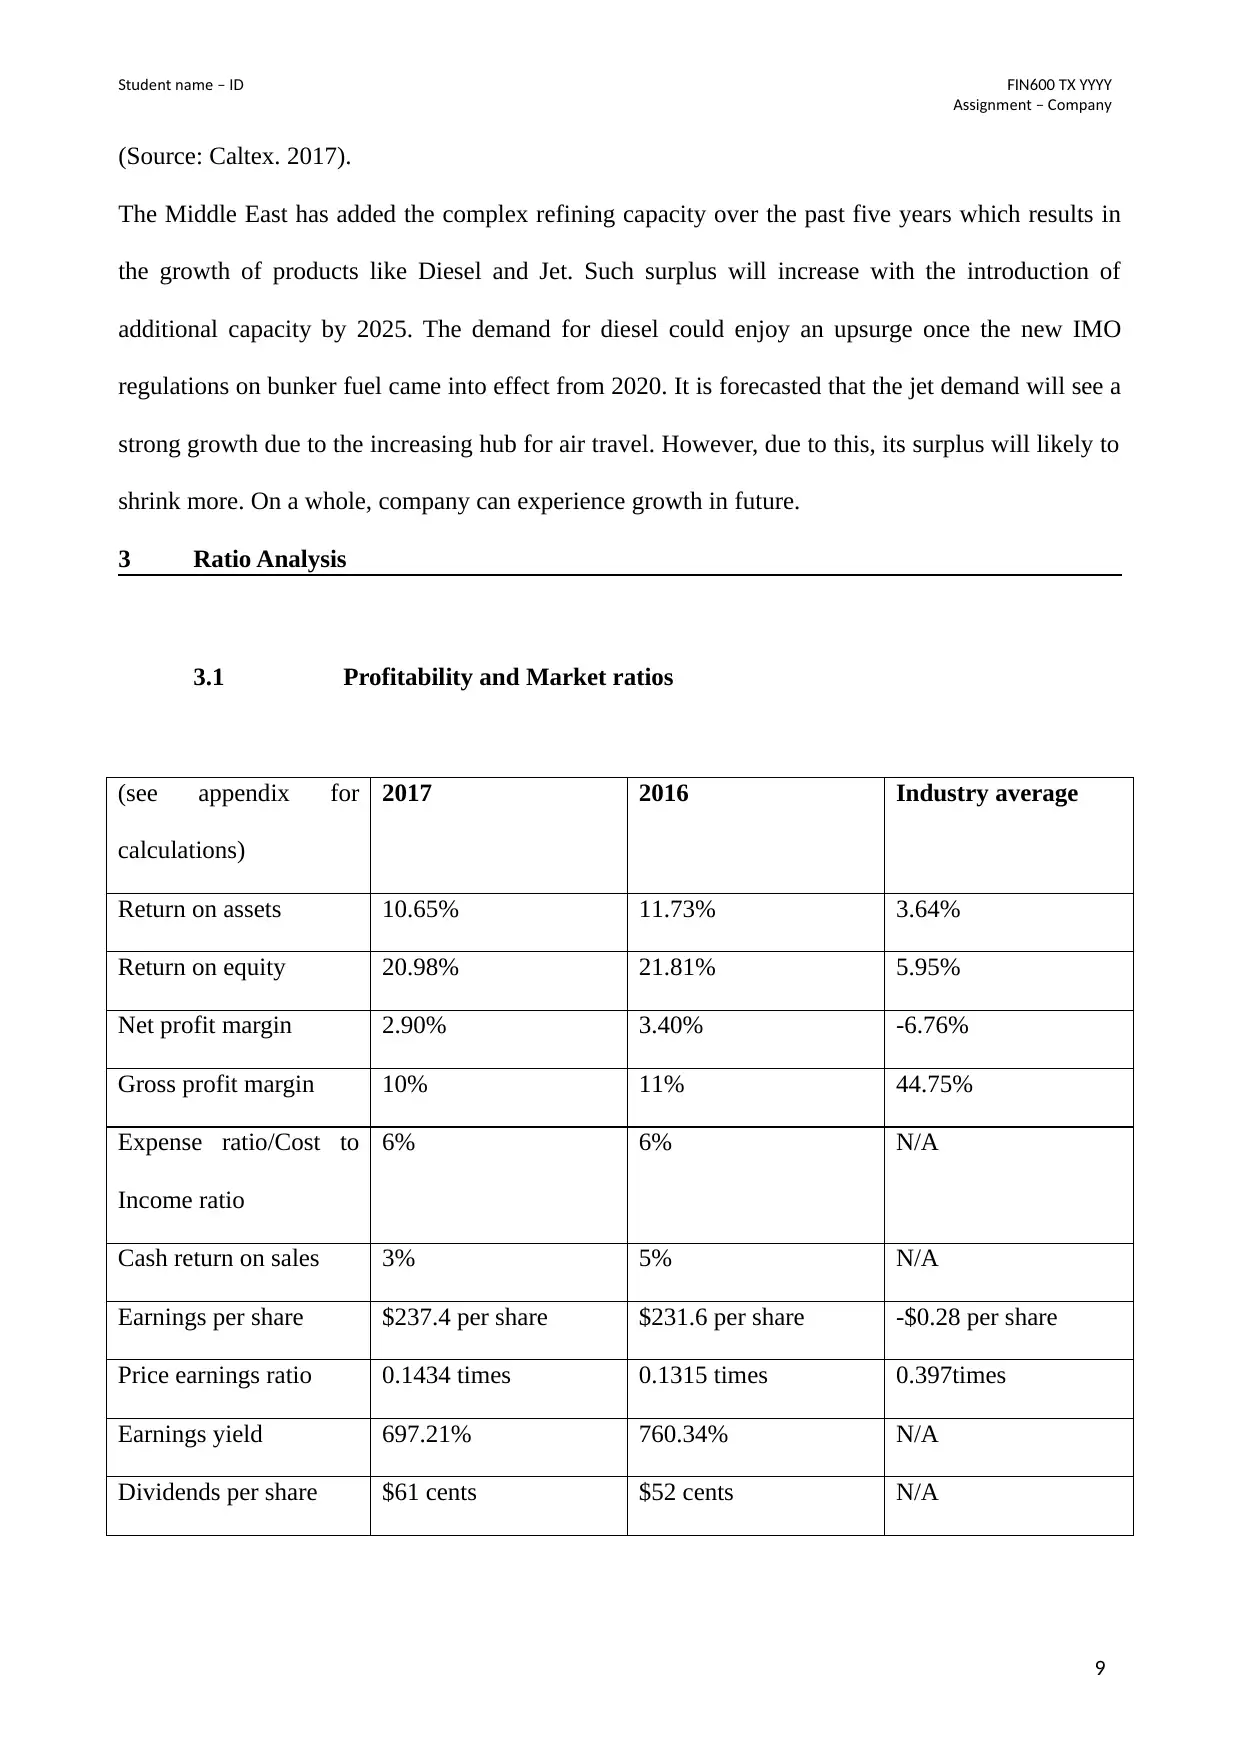
The Middle East has added the complex refining capacity over the past five years which results in
the growth of products like Diesel and Jet. Such surplus will increase with the introduction of
additional capacity by 2025. The demand for diesel could enjoy an upsurge once the new IMO
regulations on bunker fuel came into effect from 2020. It is forecasted that the jet demand will see a
strong growth due to the increasing hub for air travel. However, due to this, its surplus will likely to
shrink more. On a whole, company can experience growth in future.
3 Ratio Analysis
3.1 Profitability and Market ratios
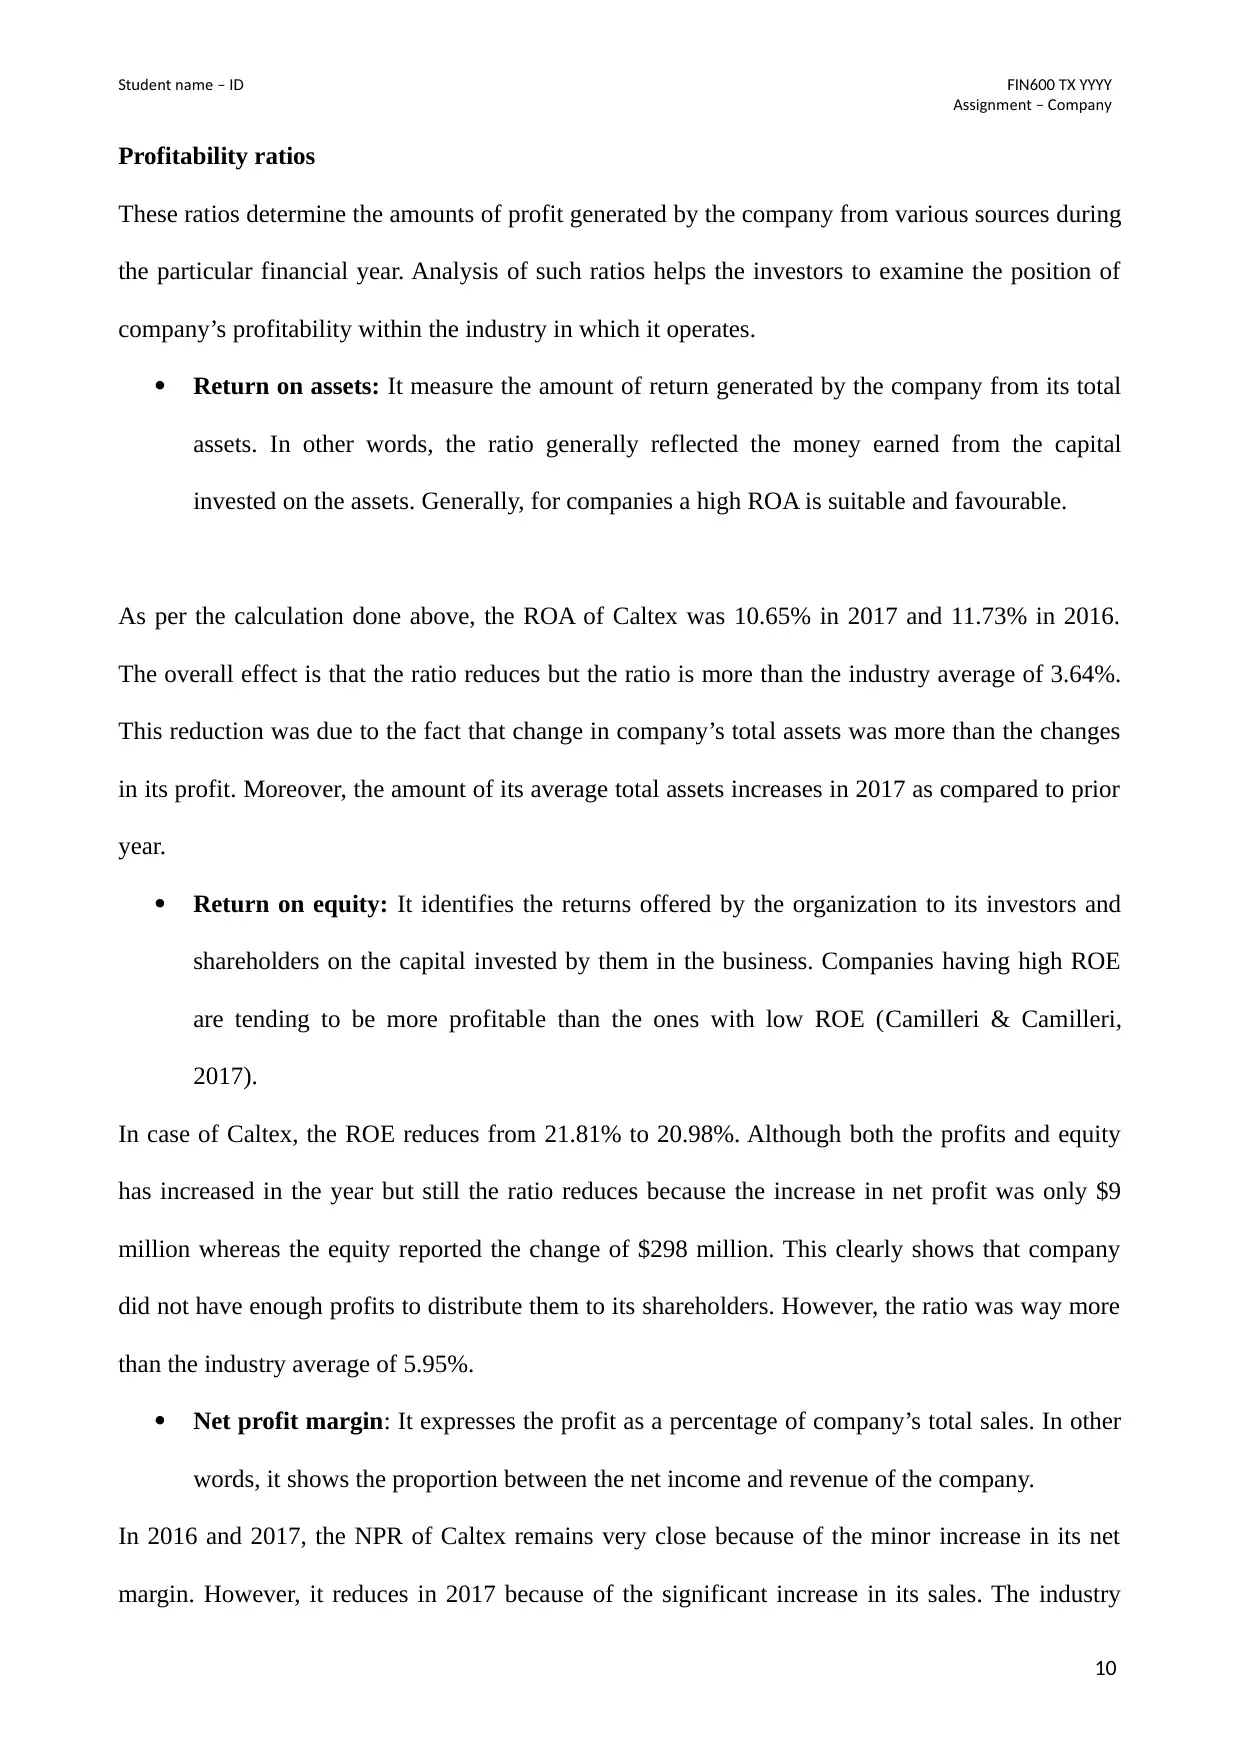
(see appendix for
calculations)
2017 2016 Industry average
Return on assets 10.65% 11.73% 3.64%
Return on equity 20.98% 21.81% 5.95%
Net profit margin 2.90% 3.40% -6.76%
Gross profit margin 10% 11% 44.75%
Expense ratio/Cost to
Income ratio
6% 6% N/A
Cash return on sales 3% 5% N/A
Earnings per share $237.4 per share $231.6 per share -$0.28 per share
Price earnings ratio 0.1434 times 0.1315 times 0.397times
Earnings yield 697.21% 760.34% N/A
Dividends per share $61 cents $52 cents N/A
9
A i nment ompanss g – C y
(Source: Caltex. 2017).
The Middle East has added the complex refining capacity over the past five years which results in
the growth of products like Diesel and Jet. Such surplus will increase with the introduction of
additional capacity by 2025. The demand for diesel could enjoy an upsurge once the new IMO
regulations on bunker fuel came into effect from 2020. It is forecasted that the jet demand will see a
strong growth due to the increasing hub for air travel. However, due to this, its surplus will likely to
shrink more. On a whole, company can experience growth in future.
3 Ratio Analysis
3.1 Profitability and Market ratios
(see appendix for
calculations)
2017 2016 Industry average
Return on assets 10.65% 11.73% 3.64%
Return on equity 20.98% 21.81% 5.95%
Net profit margin 2.90% 3.40% -6.76%
Gross profit margin 10% 11% 44.75%
Expense ratio/Cost to
Income ratio
6% 6% N/A
Cash return on sales 3% 5% N/A
Earnings per share $237.4 per share $231.6 per share -$0.28 per share
Price earnings ratio 0.1434 times 0.1315 times 0.397times
Earnings yield 697.21% 760.34% N/A
Dividends per share $61 cents $52 cents N/A
9
Paraphrase This Document
Need a fresh take? Get an instant paraphrase of this document with our AI Paraphraser
t dent nameS u – ID TFIN600 X YYYY
A i nment ompanss g – C y
Profitability ratios
These ratios determine the amounts of profit generated by the company from various sources during
the particular financial year. Analysis of such ratios helps the investors to examine the position of
company’s profitability within the industry in which it operates.
Return on assets: It measure the amount of return generated by the company from its total
assets. In other words, the ratio generally reflected the money earned from the capital
invested on the assets. Generally, for companies a high ROA is suitable and favourable.
As per the calculation done above, the ROA of Caltex was 10.65% in 2017 and 11.73% in 2016.
The overall effect is that the ratio reduces but the ratio is more than the industry average of 3.64%.
This reduction was due to the fact that change in company’s total assets was more than the changes
in its profit. Moreover, the amount of its average total assets increases in 2017 as compared to prior
year.
Return on equity: It identifies the returns offered by the organization to its investors and
shareholders on the capital invested by them in the business. Companies having high ROE
are tending to be more profitable than the ones with low ROE (Camilleri & Camilleri,
2017).
In case of Caltex, the ROE reduces from 21.81% to 20.98%. Although both the profits and equity
has increased in the year but still the ratio reduces because the increase in net profit was only $9
million whereas the equity reported the change of $298 million. This clearly shows that company
did not have enough profits to distribute them to its shareholders. However, the ratio was way more
than the industry average of 5.95%.
Net profit margin: It expresses the profit as a percentage of company’s total sales. In other
words, it shows the proportion between the net income and revenue of the company.
In 2016 and 2017, the NPR of Caltex remains very close because of the minor increase in its net
margin. However, it reduces in 2017 because of the significant increase in its sales. The industry
10
t dent nameS u – ID TFIN600 X YYYY
A i nment ompanss g – C y
average is negative and the company is already above the benchmark.
Gross profit margin: It also expresses the profitability position of the company but measure
the amount which is earned from the revenue after deducting the cost of sales.
The same trend follows in GPR of Caltex as it shows a reduction of 1% over the years. Reason
being the same, the ratio was 11% in 2016 and 10% in 2017. Moreover, the company is far away
from the industry standard of 44.75%.
Expense Ratio: This ratio identifies the proportion between the expenses and revenue of the
company. It indicates the portion of revenue covered by the operating expenses.
Caltex’s expense ratio remains almost same during the past two years that is 6%. This is because of
the significant increase in its operating expenses and revenue (Godwin & Alderman, 2012).
Cash return on sales: This ratio measures the cash generated from operating activities
against the net sales of the company.
In case of Caltex, the ratio reduces from 5% to 3% because of the reduction in the amount of cash
flow made by the operating activities of the firm. It decreases from $928,202 to $735,052 in 2017.
Market value ratios
They measure the performance of a corporation within the market in which it operates. They
evaluates the trend in company’s share prices and help the investors in taking better decisions
(Jenter & Lewellen, 2015).
Earnings per share: It shows the earnings made by each share of the company.
The EPS of Caltex shows the upward trend and was increased to $237.4 per share in 2017. This was
due to the overall increase in the net profit of the entity and a minor reduction in its number of
ordinary shares. Moreover, in both the years the ratio was way more than the industry average
which is in negative.
Price earnings ratio: It reflects the amount the investors wish to pay for per dollar of
earnings.
11
⊘ This is a preview!⊘
Do you want full access?
Subscribe today to unlock all pages.
Trusted by 1+ million students worldwide
1 out of 22
Related Documents


Your All-in-One AI-Powered Toolkit for Academic Success.
+13062052269
info@desklib.com
Available 24*7 on WhatsApp / Email
![[object Object]](/_next/static/media/star-bottom.7253800d.svg)
Unlock your academic potential
Copyright © 2020–2026 A2Z Services. All Rights Reserved. Developed and managed by ZUCOL.