FIN60003: Social Media Impact on Staff at a Law Firm in Melbourne
VerifiedAdded on 2023/06/03
|18
|3540
|336
Report
AI Summary
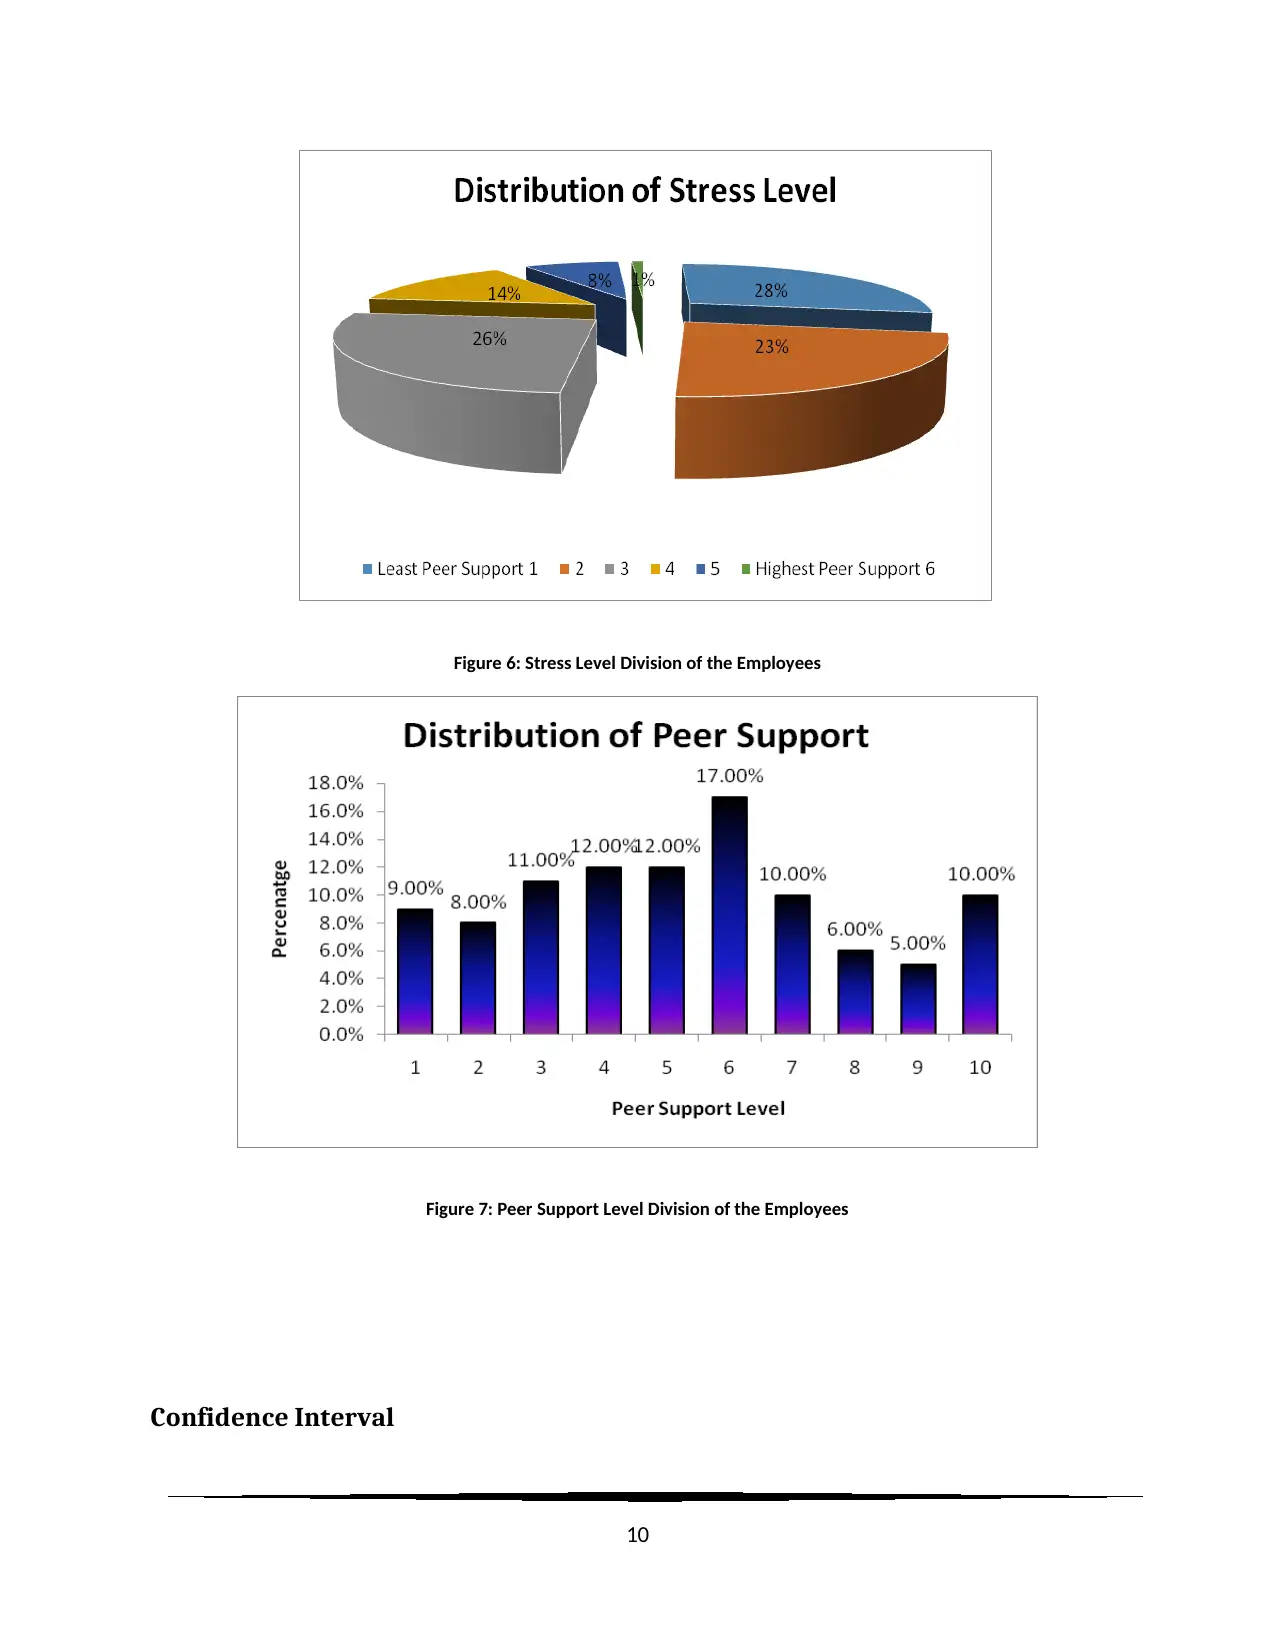
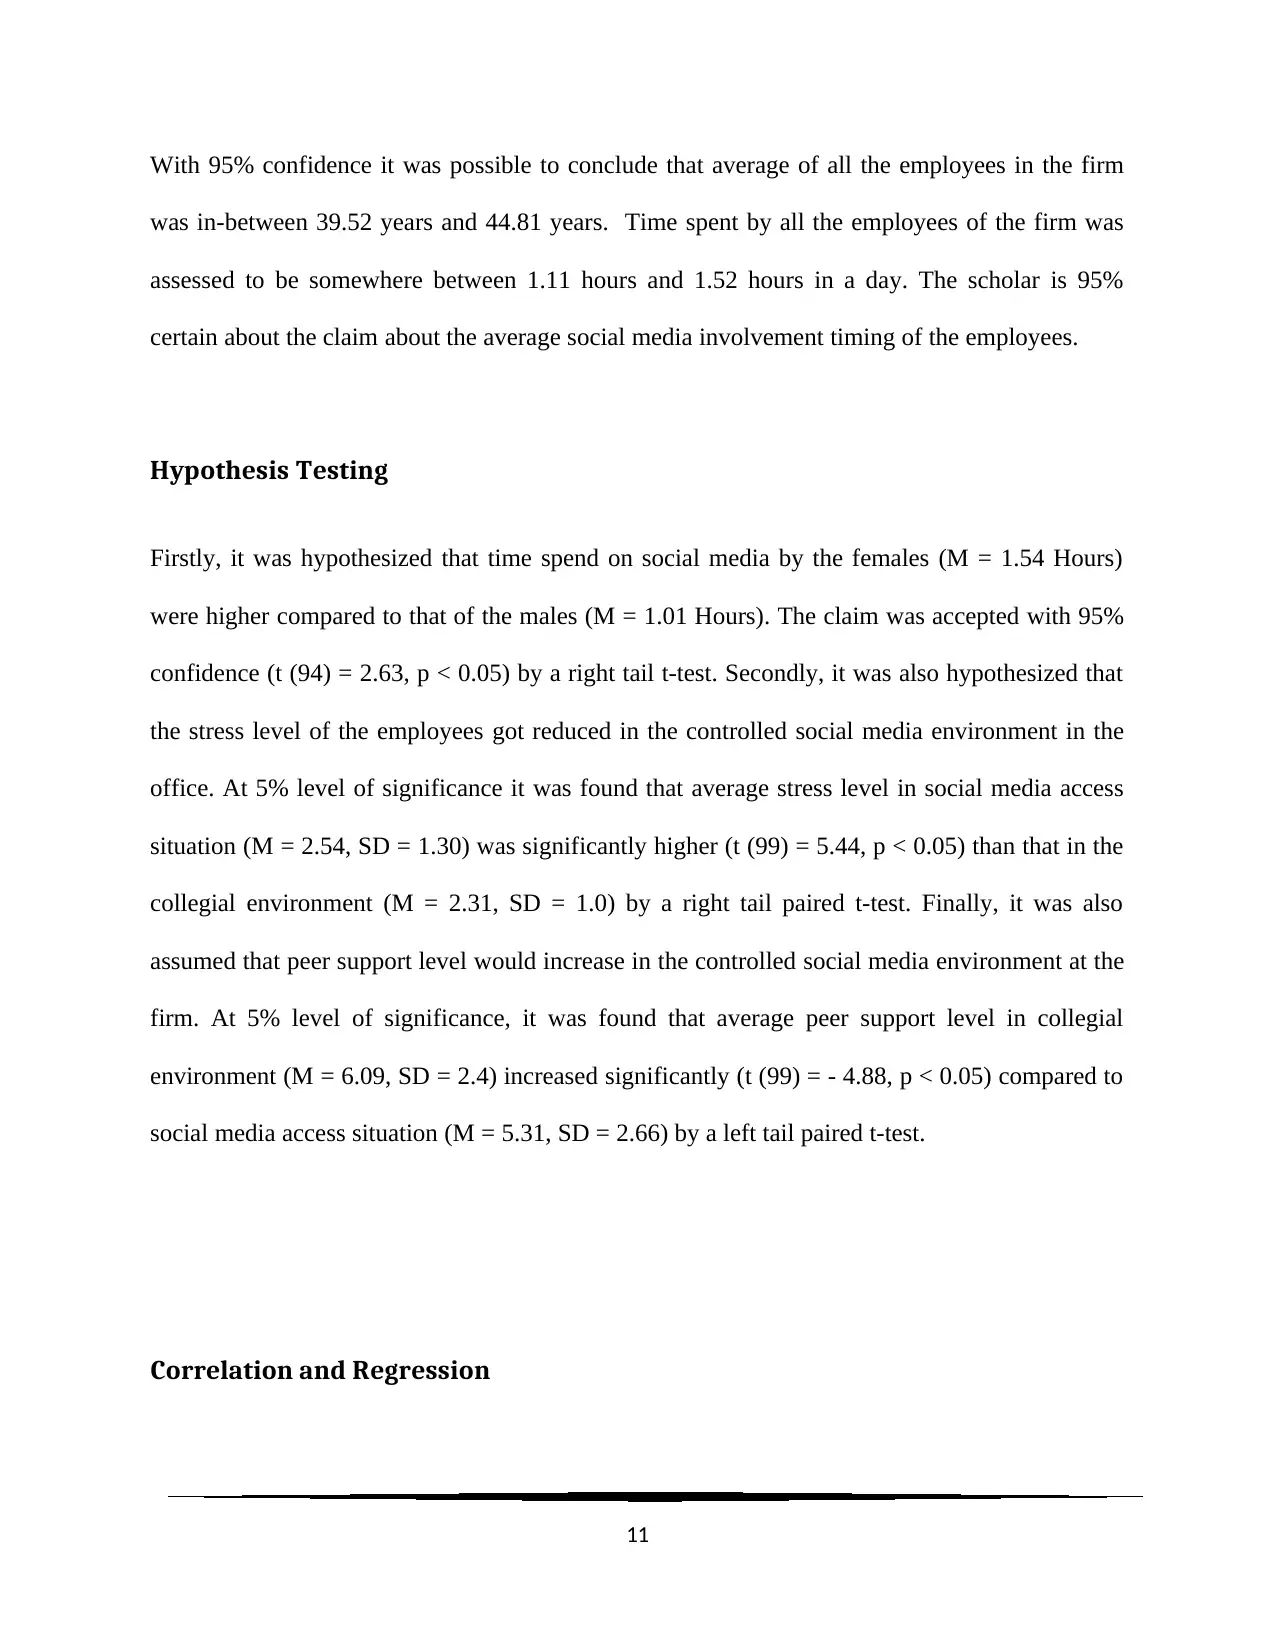
This report investigates the impact of social media on employee satisfaction, stress levels, and peer support within a Melbourne law firm. A controlled social media environment was implemented, and data was collected through questionnaires and software monitoring social media usage. The study found that females were more inclined towards social media use than males and that a collegial environment had a positive impact. Hypothesis testing revealed that stress levels were significantly reduced, and peer support increased in the controlled environment. However, no significant linear relationship was found between social media involvement and job satisfaction. The report concludes that controlling social media access and fostering a collegial atmosphere can be a viable strategy for improving employee well-being, with recommendations focusing on targeted strategies for female employees, high-quality social spaces, and consideration of peer support dynamics.

Employee Satisfaction and Stress Levels in a
Controlled Social Media Environment – A case
Study for a Law Firm in Melbourne
1
Controlled Social Media Environment – A case
Study for a Law Firm in Melbourne
1
Paraphrase This Document
Need a fresh take? Get an instant paraphrase of this document with our AI Paraphraser

Executive Summary
In this task, the scholar developed a business report that assesses the effect of social media on
employees of a law firm. Special software on all computers and devices with Internet connection
settings measured how much time each employee spent per day for different social media.
Initially, with the help of a questionnaire, the scholar asked staff to classify their job satisfaction,
their stress and their perception of the amount of support they received from their counterparts.
Later, the software automatically blocked access to social media on all devices and the staff were
facilitated with some social spaces so that employees can interact more frequently while
enjoying free tea and coffee. It was expected that it would create a collegial atmosphere in which
employees would feel part of a large family. Females were found to be more inclined towards
social media than men. Positive impact of collegial environment was observed in this research.
But, outlandishly no linear relation was observed between the social media involvement and job
satisfaction of the employees.
2

Table of Contents
Executive Summary.........................................................................................2
Introduction.....................................................................................................4
Analysis............................................................................................................5
Descriptive Statistics....................................................................................5
Confidence Interval.....................................................................................10
Hypothesis Testing.....................................................................................11
Correlation and Regression.........................................................................11
Conclusion and Limitations............................................................................12
References.....................................................................................................14
Appendices....................................................................................................14
Confidence Interval Calculations.................................................................14
Hypothesis Testing For Linearity.................................................................18
3
⊘ This is a preview!⊘
Do you want full access?
Subscribe today to unlock all pages.

Trusted by 1+ million students worldwide

Introduction
The Melbourne law firm is currently considering the challenges for the new generation of
workers, and management has decided to implement new strategies in the law firm to improve
the work environment. The owners of the company are interested in expanding their activities
and have identified the area to find the spirit of peers among employees, reduce stress and
improve productivity.
The purpose of this report is to provide the address with preliminary information on: (i) the
general capacity to create a controlled social media environment; and (II) important management
decisions that need to be taken to ensure their job satisfaction, stress and peer-group support. The
study supports the viability of business modeling in job satisfaction and employee stress support;
a global financial analysis of the company is not a supplier because of the modification of the
guidelines.
In the study two analytical concepts were used, namely the descriptive analysis and the
inferential analysis. Descriptive analysis focuses on the age and initial attributes of employees in
the social media access environment in which the firm operates; the inferential analysis
investigates the management hypothesis and finds the difference in the properties of the
employees attribute based on the changed environment. The study data is derived from the help
of a questionnaire covering these two environments, including: job satisfaction, stress and peer
support data, and the age of workers and gender information.
4
Paraphrase This Document
Need a fresh take? Get an instant paraphrase of this document with our AI Paraphraser

Analysis
The report is divided into two main sections: an area of analysis containing information on both
environments, with respect to employees of the law firm; and a final part, which gives suppliers a
concrete closure of the analysis of all the departments of the company.
Descriptive Statistics
Gender of the sample of 100 employees was explored first. This demographic detail of the
employees revealed that there were 58% females with 42% male presence in the sample. The
random sample of 100 employees was selected from the population of 810 employees of the law
firm. Preponderance presence of female employees was identified from the sample’s
demographic characteristics.
Figure 1: Gender Distribution of Sample of 100 Employees
5

Employees were found to be evenly distributed from the details of their age (18.5 years – 69.2
years). Average age of the employees (M = 42.17, SD = 13.32) reflected presence of enough
number of middle-aged employees in the firm. The consistent impact of social media has been
observed earlier for this age group and the introduction of controlled social media environment
was expected to be beneficial for these employees. From the Figure 2 of age distribution it was
identified that employees’ age was normally distributed.
Table 1: Descriptive Details of Age, Social Media Involvement Time, and Productivity Hours
Descriptive Age Time on SM Productivity _Before
Mean 42.166 1.318 16.786
Standard Error 1.332 0.103 0.621
Median 42.4 1.3 16.9
Mode 40.8 0 25
Standard Deviation 13.319 1.029 6.209
Sample Variance 177.385 1.060 38.551
Kurtosis -1.014 -0.738 -0.567
Skewness 0.082 0.373 -0.191
Range 50.7 3.6 28.6
Minimum 18.5 0 3.4
Maximum 69.2 3.6 32
6
⊘ This is a preview!⊘
Do you want full access?
Subscribe today to unlock all pages.

Trusted by 1+ million students worldwide

Figure 2: Distribution of Age of the Sample Employees
Considering the time spent on social media by the employees, the scholar noticed that a major
section of the staffs (P = 72.0%) were involved for less than 2 hours a day on social media
platforms. Remaining 28% of the employees were noted to be addicted to the social media sites,
and were surfing them for more than 2 hours a day. Some of the employees were even spending
3 hours or more on social media sites.
Figure 3: Distribution of Time Spent by the Employees on Social Media
7
Paraphrase This Document
Need a fresh take? Get an instant paraphrase of this document with our AI Paraphraser

The productivity of the employees was measured by the number of billable hours. Distribution
of productivity revealed that 41% of the employees were working around 13 to 17 billable hours
for the firm. An employee with 31.5 billable hours of productivity was also identified from the
distribution. That particular observation could be considered as an uncharacteristic number of
billable hours for an employee.
Figure 4: Histogram of Productivity Hours in Terms of Billable Hours
Job satisfaction, stress level, and support from peer group were measured as categorical variables
and the percentage distribution details have been presented in Table 2. Almost 40% employees
were identified to be disappointed with the firm, and their levels of satisfaction were confined at
3 or below. Stress levels were observed to be comparatively lower and 41% of the responses of
the employees were restricted to level 2 of the scale. Peer support in the firm was noted to be
symmetrically distributed, and the trend was in line with previous literatures of the usual office
culture (Kang, and Sung, 2017). The entire descriptive analysis for categorical variables was
conducted before the blocking of social media access to the employees.
8

Table 2: Percentage Distribution of Likert Scale Responses
Likert Level Percentage of Job Satisfaction Percentage of Stress Level Percentage of Peer Support
1 17.00% 28.00% 9.00%
2 13.00% 23.00% 8.00%
3 10.00% 26.00% 11.00%
4 7.00% 14.00% 12.00%
5 11.00% 8.00% 12.00%
6 7.00% 1.00% 17.00%
7 9.00% 10.00%
8 10.00% 6.00%
9 7.00% 5.00%
10 9.00% 10.00%
Grand Total 100.00% 100.00% 100.00%
Figure 5: Job Satisfaction Level of the Employees
9
⊘ This is a preview!⊘
Do you want full access?
Subscribe today to unlock all pages.

Trusted by 1+ million students worldwide

Figure 6: Stress Level Division of the Employees
Figure 7: Peer Support Level Division of the Employees
Confidence Interval
10
Figure 7: Peer Support Level Division of the Employees
Confidence Interval
10
Paraphrase This Document
Need a fresh take? Get an instant paraphrase of this document with our AI Paraphraser

With 95% confidence it was possible to conclude that average of all the employees in the firm
was in-between 39.52 years and 44.81 years. Time spent by all the employees of the firm was
assessed to be somewhere between 1.11 hours and 1.52 hours in a day. The scholar is 95%
certain about the claim about the average social media involvement timing of the employees.
Hypothesis Testing
Firstly, it was hypothesized that time spend on social media by the females (M = 1.54 Hours)
were higher compared to that of the males (M = 1.01 Hours). The claim was accepted with 95%
confidence (t (94) = 2.63, p < 0.05) by a right tail t-test. Secondly, it was also hypothesized that
the stress level of the employees got reduced in the controlled social media environment in the
office. At 5% level of significance it was found that average stress level in social media access
situation (M = 2.54, SD = 1.30) was significantly higher (t (99) = 5.44, p < 0.05) than that in the
collegial environment (M = 2.31, SD = 1.0) by a right tail paired t-test. Finally, it was also
assumed that peer support level would increase in the controlled social media environment at the
firm. At 5% level of significance, it was found that average peer support level in collegial
environment (M = 6.09, SD = 2.4) increased significantly (t (99) = - 4.88, p < 0.05) compared to
social media access situation (M = 5.31, SD = 2.66) by a left tail paired t-test.
Correlation and Regression
11

The linear relationship between time spent on social media and employees’ productivity was
evaluated. The correlation was almost zero and the trend of the relation was apparent from the
diagram in Figure 8. The estimated regression was done for job satisfaction (JS =Dependent
variable) on time spent on the social media (SM = Independent variable), and the equation was
found as JS=−0. 128 SM +5 . 11 . The linear relation was found to be statistically insignificant at
5% level of significance (Appendix). Increase in social media involvement is identified to
decrease job satisfaction, but the impact was not significant enough for valid evidence.
Figure 8: Scatter Plot Representing Relation between Average Job Satisfaction and Time Spent on Social Media
Conclusion and Limitations
12
⊘ This is a preview!⊘
Do you want full access?
Subscribe today to unlock all pages.

Trusted by 1+ million students worldwide
1 out of 18
Related Documents
Your All-in-One AI-Powered Toolkit for Academic Success.
+13062052269
info@desklib.com
Available 24*7 on WhatsApp / Email
Unlock your academic potential
Copyright © 2020–2026 A2Z Services. All Rights Reserved. Developed and managed by ZUCOL.


