FINA600 TX: In-depth Financial Analysis of Amcor Limited in 2017
VerifiedAdded on 2023/06/10
|16
|5539
|86
Case Study
AI Summary
This case study provides a financial analysis of Amcor Limited, comparing its financial performance over two fiscal years and benchmarking it against industry averages. It assesses the economic and market conditions in Australia that could impact Amcor's financial progress. The analysis employs key financial ratios such as profitability, liquidity, efficiency, and gearing to evaluate Amcor's financial position. The report examines Amcor's financial statements, including income statements and balance sheets, noting improvements in net income and total assets. It also considers the Australian economic outlook, including GDP growth and stock market performance. The ratio analysis covers return on assets, return on equity, profit margins, expense ratios, earnings per share, and asset turnover, providing insights into Amcor's financial health and investment potential. The study concludes with recommendations based on the financial analysis.
Amcor Limited
FIN600 TX 2017
NAME: STUDENT ID:
FIN600 TX 2017
NAME: STUDENT ID:
Paraphrase This Document
Need a fresh take? Get an instant paraphrase of this document with our AI Paraphraser
Student name – ID FIN600 TX 2017
Assignment – Amcor Limited Company
Executive Summary
The financial performance of Amcor Limited is mainly conducted over the period of two fiscal
years and compared with the industry average to understand its financial progress. In addition, the
economic and market condition of Australia is also evaluated, which might affect financial progress
of the organization. The ratios such a profitability, liquidity, efficiency and gearing is mainly used
for the calculation purposes, as it might help in depicting the actual financial position of the
organization over the period of two fiscal years. Therefore, the evaluation of the financial ratios
could help investors make adequate investment decisions by evaluating the future returns and
progress that could be generated from investment.
1
Student name – ID FIN600 TX 2017
Assignment – Amcor Limited Company
Contents
1 Introduction...................................................................................................................................3
3 Ratio Analysis...............................................................................................................................5
4 Recommendations and overall assessment...................................................................................8
5 References/Bibliography.............................................................................................................10
Appendices – attached Excel Spreadsheet.........................................................................................12
2
⊘ This is a preview!⊘
Do you want full access?
Subscribe today to unlock all pages.
Trusted by 1+ million students worldwide
Student name – ID FIN600 TX 2017
Assignment – Amcor Limited Company
1 Introduction
1.1 Background and Business
Amcor is one of the largest global packing companies situated in Australia, as it aims in
developing and producing the flexible packaging system used by the organization all around the
globe. In addition, the company has been supporting different types of packaging requirement of
companies such as flexible packing system, specialty cartons, rigid containers and closures.
Moreover, Amcor has been packing for companies such as, pharmaceutical, medical-device,
personal care, home care, food, beverages and other products. The company has been operating
since 1986, where it become Amcor and increased the level of operations, which could be generated
from operations. In the current era the company has a total employee strength of 35,211 people and
has been generating a whooping revenue of US$9 billion in sales by conducing operation in 40
countries with 200 different locations (Amcor.com, 2018). The main product line of the
organization is packaging, which is an essential part of the product delivery, as it contains the actual
product that is being transported to the customers.
2 Company Analysis
2.1 Financial statements, Current Financial performance, economic outlook
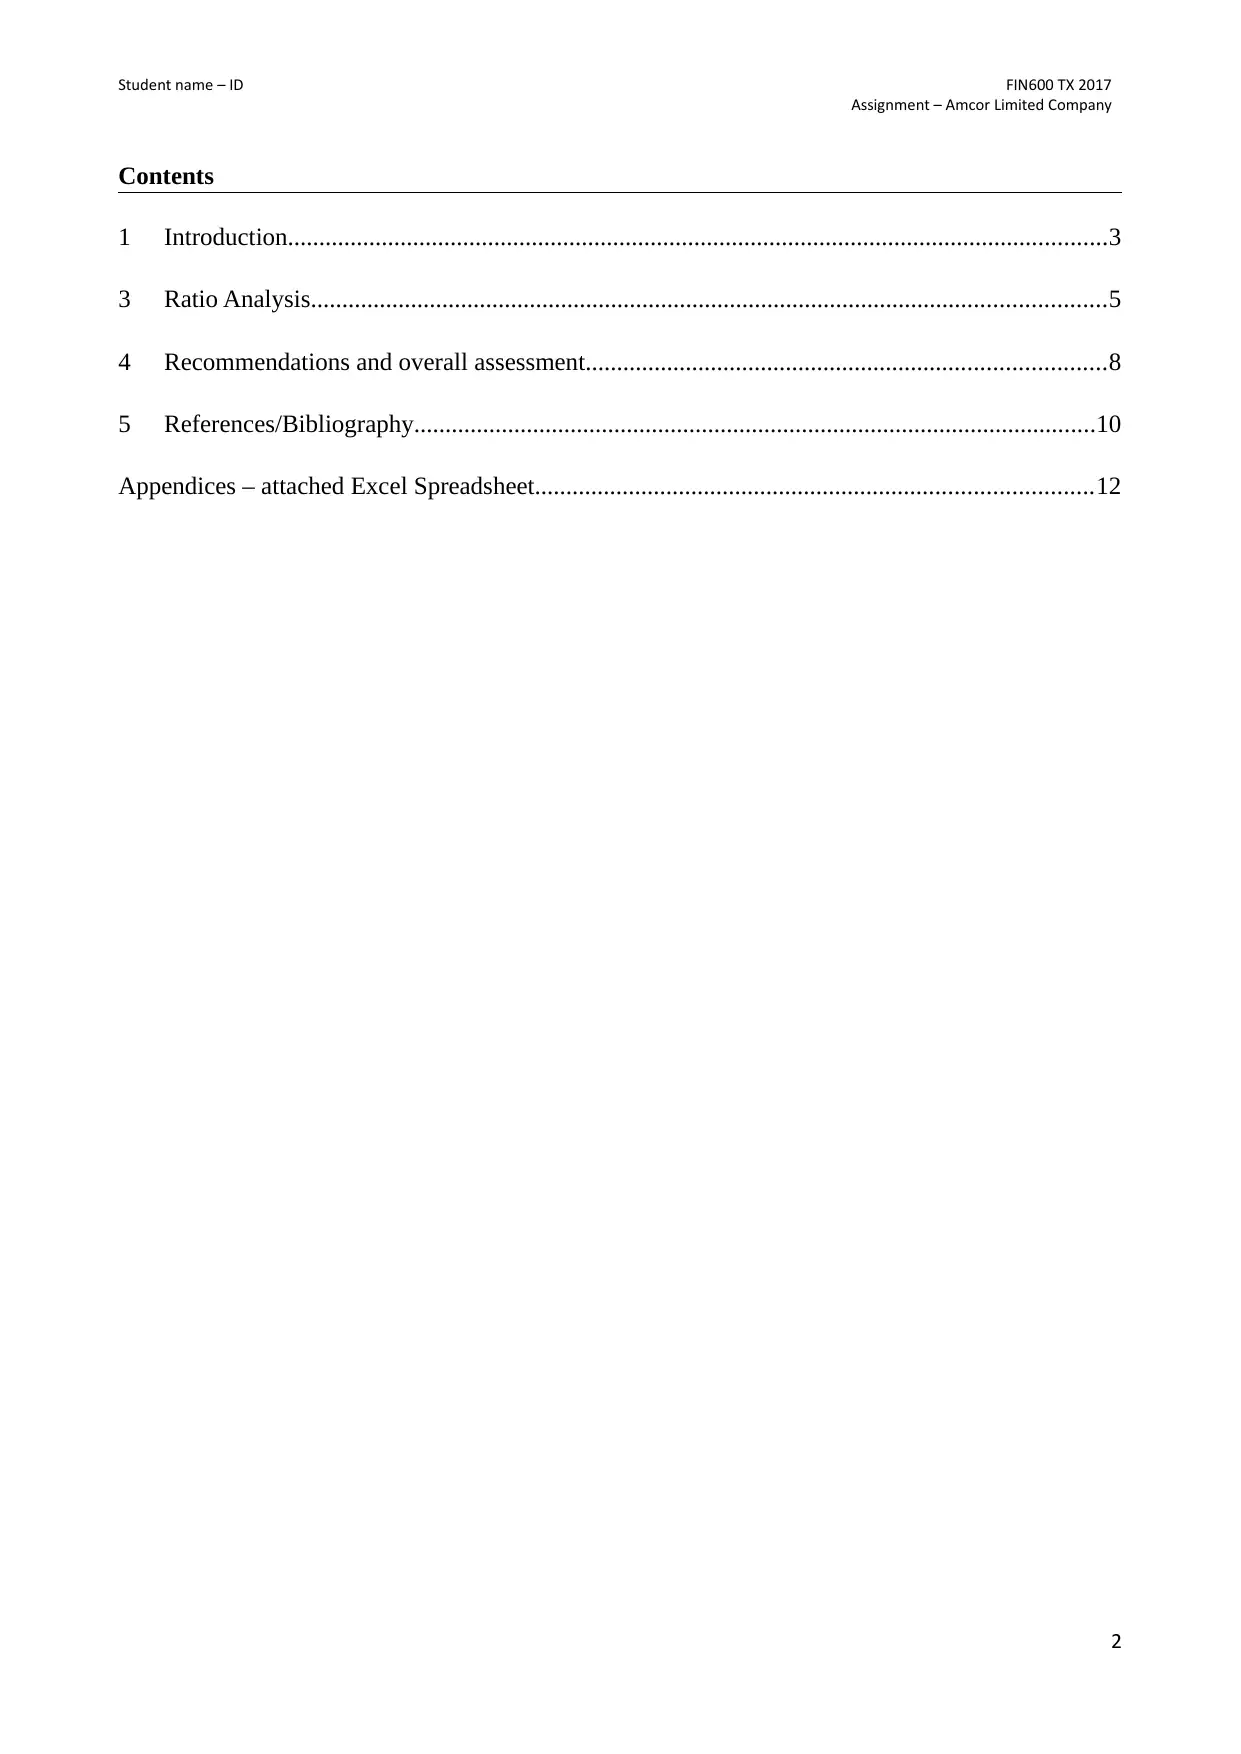
The financial statement of Amcor indicates the overall progress, which has been made by
the organization during the fiscal year of 2017 as compared to 2016. The company’s financial health
has improved, which can be seen from the rising net income. In addition, from the evaluation it
could also be detected that the overall total assets have improved adequately, which uplifted the
financial position of the organization. after evaluation the income statement of the organization,
decline in the General and administration expenses can be seen, which was the main reason behind
the increment in operating profit of the company. The overall revenues for the company have
mainly declined during 2017, as compared to 2016, which led to the decline in its cost of sales and
gross profit. The other expense of the company remained same, which mainly helped in increasing
the level of operating income from 575.7 million in 2016 to 752.7 million in 2017 (Amcor.com,
2018). This allowed the organization to minimizing their cash outflow during the fiscal year and led
to the increment in net profits. The further evaluation of the annual report indicated the increment in
total assets, which depicted the financial performance and adherence of the organization to obtain
sustainable growth. Hence, the organization was able to improve the level of income and assets for
supporting its future growth.
3
Assignment – Amcor Limited Company
1 Introduction
1.1 Background and Business
Amcor is one of the largest global packing companies situated in Australia, as it aims in
developing and producing the flexible packaging system used by the organization all around the
globe. In addition, the company has been supporting different types of packaging requirement of
companies such as flexible packing system, specialty cartons, rigid containers and closures.
Moreover, Amcor has been packing for companies such as, pharmaceutical, medical-device,
personal care, home care, food, beverages and other products. The company has been operating
since 1986, where it become Amcor and increased the level of operations, which could be generated
from operations. In the current era the company has a total employee strength of 35,211 people and
has been generating a whooping revenue of US$9 billion in sales by conducing operation in 40
countries with 200 different locations (Amcor.com, 2018). The main product line of the
organization is packaging, which is an essential part of the product delivery, as it contains the actual
product that is being transported to the customers.
2 Company Analysis
2.1 Financial statements, Current Financial performance, economic outlook
The financial statement of Amcor indicates the overall progress, which has been made by
the organization during the fiscal year of 2017 as compared to 2016. The company’s financial health
has improved, which can be seen from the rising net income. In addition, from the evaluation it
could also be detected that the overall total assets have improved adequately, which uplifted the
financial position of the organization. after evaluation the income statement of the organization,
decline in the General and administration expenses can be seen, which was the main reason behind
the increment in operating profit of the company. The overall revenues for the company have
mainly declined during 2017, as compared to 2016, which led to the decline in its cost of sales and
gross profit. The other expense of the company remained same, which mainly helped in increasing
the level of operating income from 575.7 million in 2016 to 752.7 million in 2017 (Amcor.com,
2018). This allowed the organization to minimizing their cash outflow during the fiscal year and led
to the increment in net profits. The further evaluation of the annual report indicated the increment in
total assets, which depicted the financial performance and adherence of the organization to obtain
sustainable growth. Hence, the organization was able to improve the level of income and assets for
supporting its future growth.
3
Paraphrase This Document
Need a fresh take? Get an instant paraphrase of this document with our AI Paraphraser
Student name – ID FIN600 TX 2017
Assignment – Amcor Limited Company
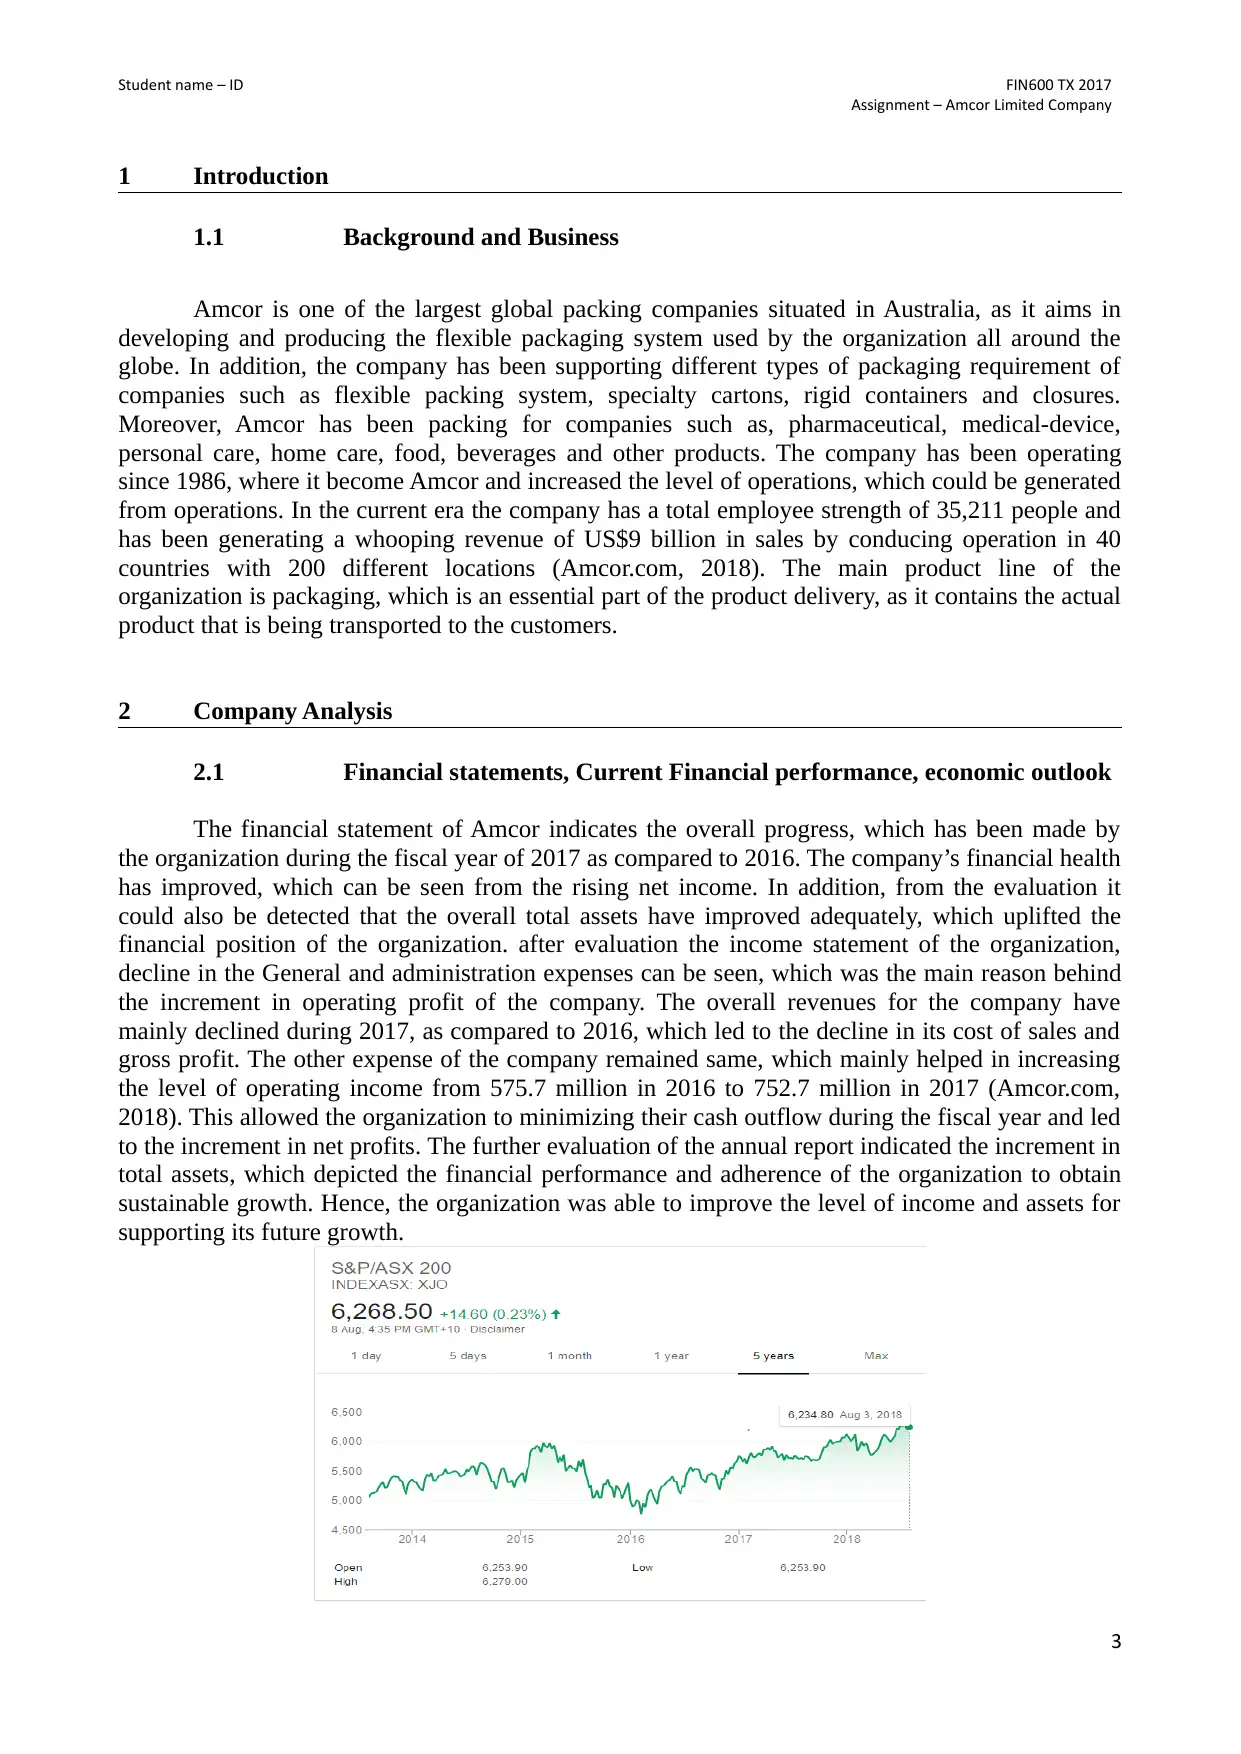
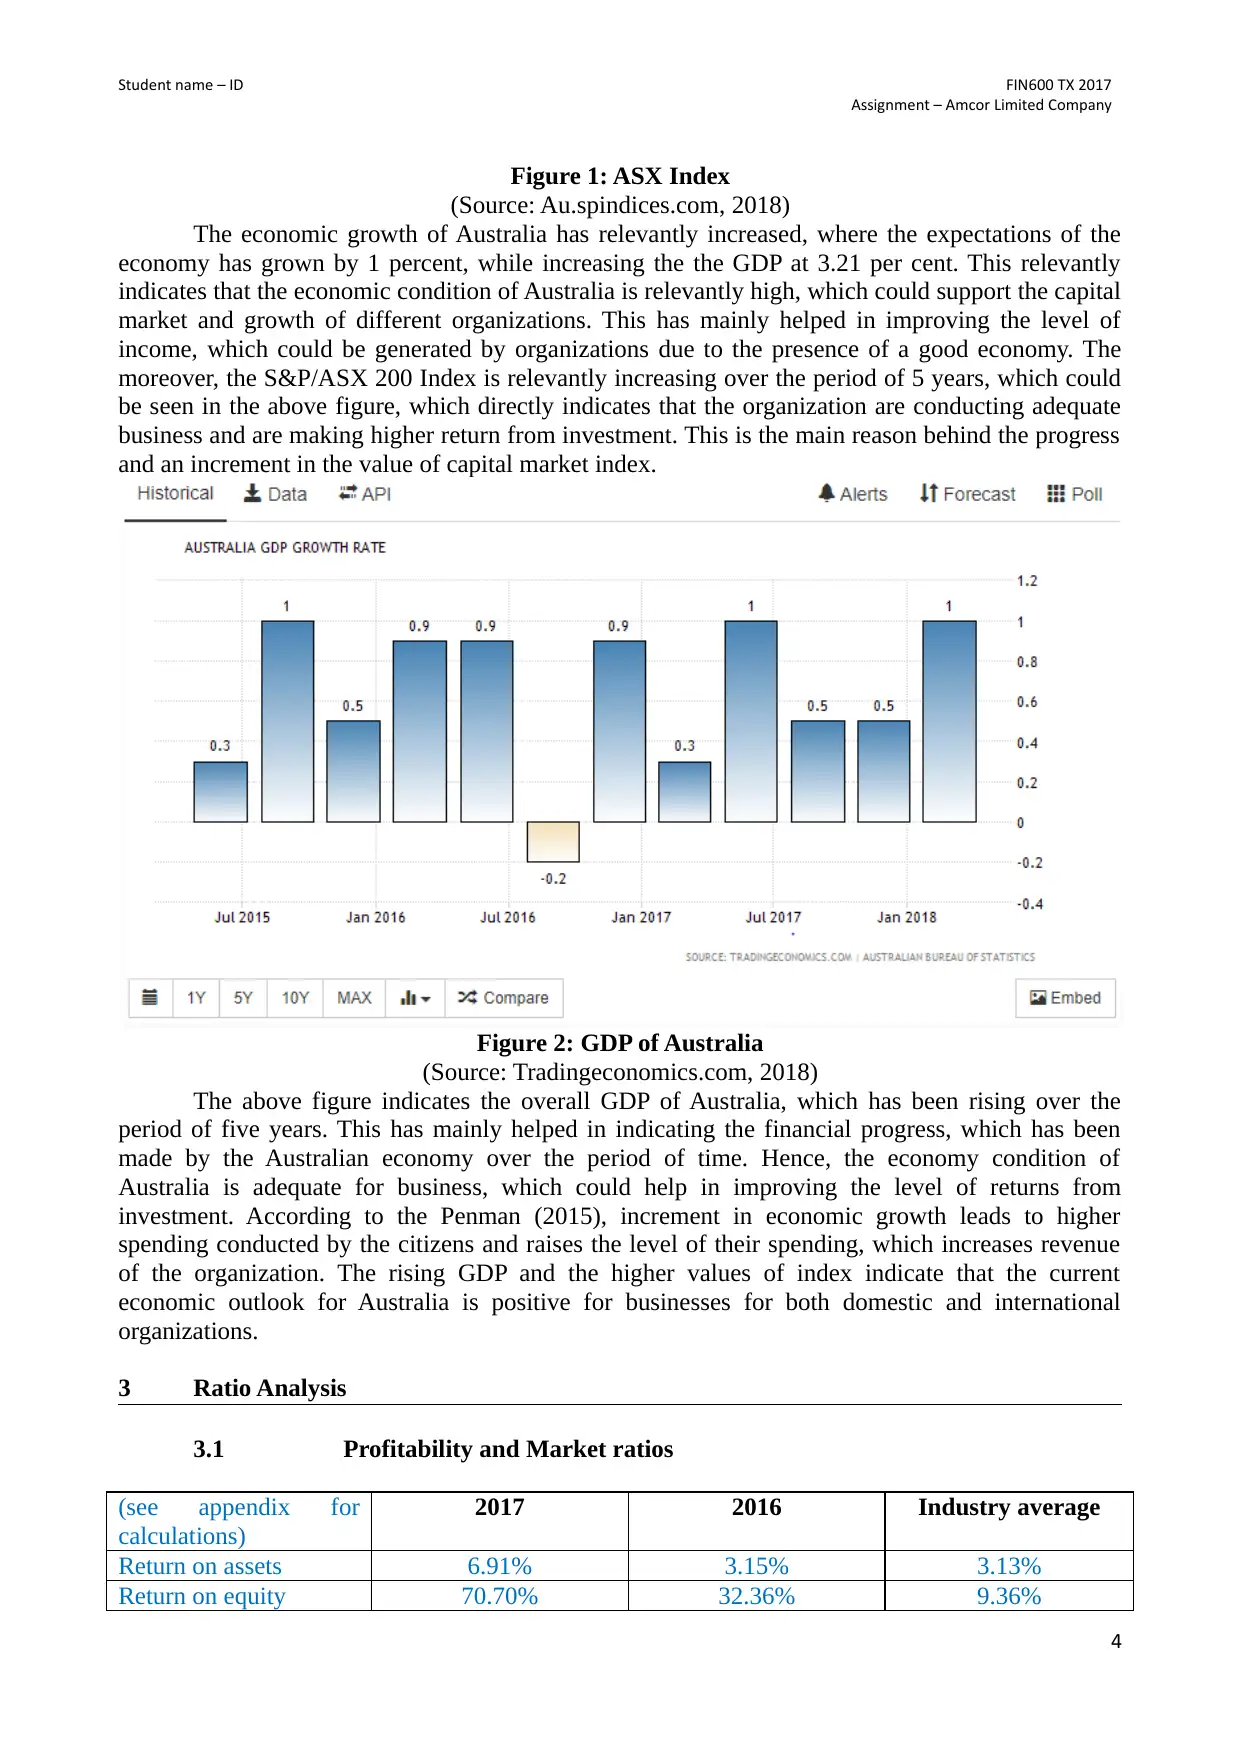
Figure 1: ASX Index
(Source: Au.spindices.com, 2018)
The economic growth of Australia has relevantly increased, where the expectations of the
economy has grown by 1 percent, while increasing the the GDP at 3.21 per cent. This relevantly
indicates that the economic condition of Australia is relevantly high, which could support the capital
market and growth of different organizations. This has mainly helped in improving the level of
income, which could be generated by organizations due to the presence of a good economy. The
moreover, the S&P/ASX 200 Index is relevantly increasing over the period of 5 years, which could
be seen in the above figure, which directly indicates that the organization are conducting adequate
business and are making higher return from investment. This is the main reason behind the progress
and an increment in the value of capital market index.
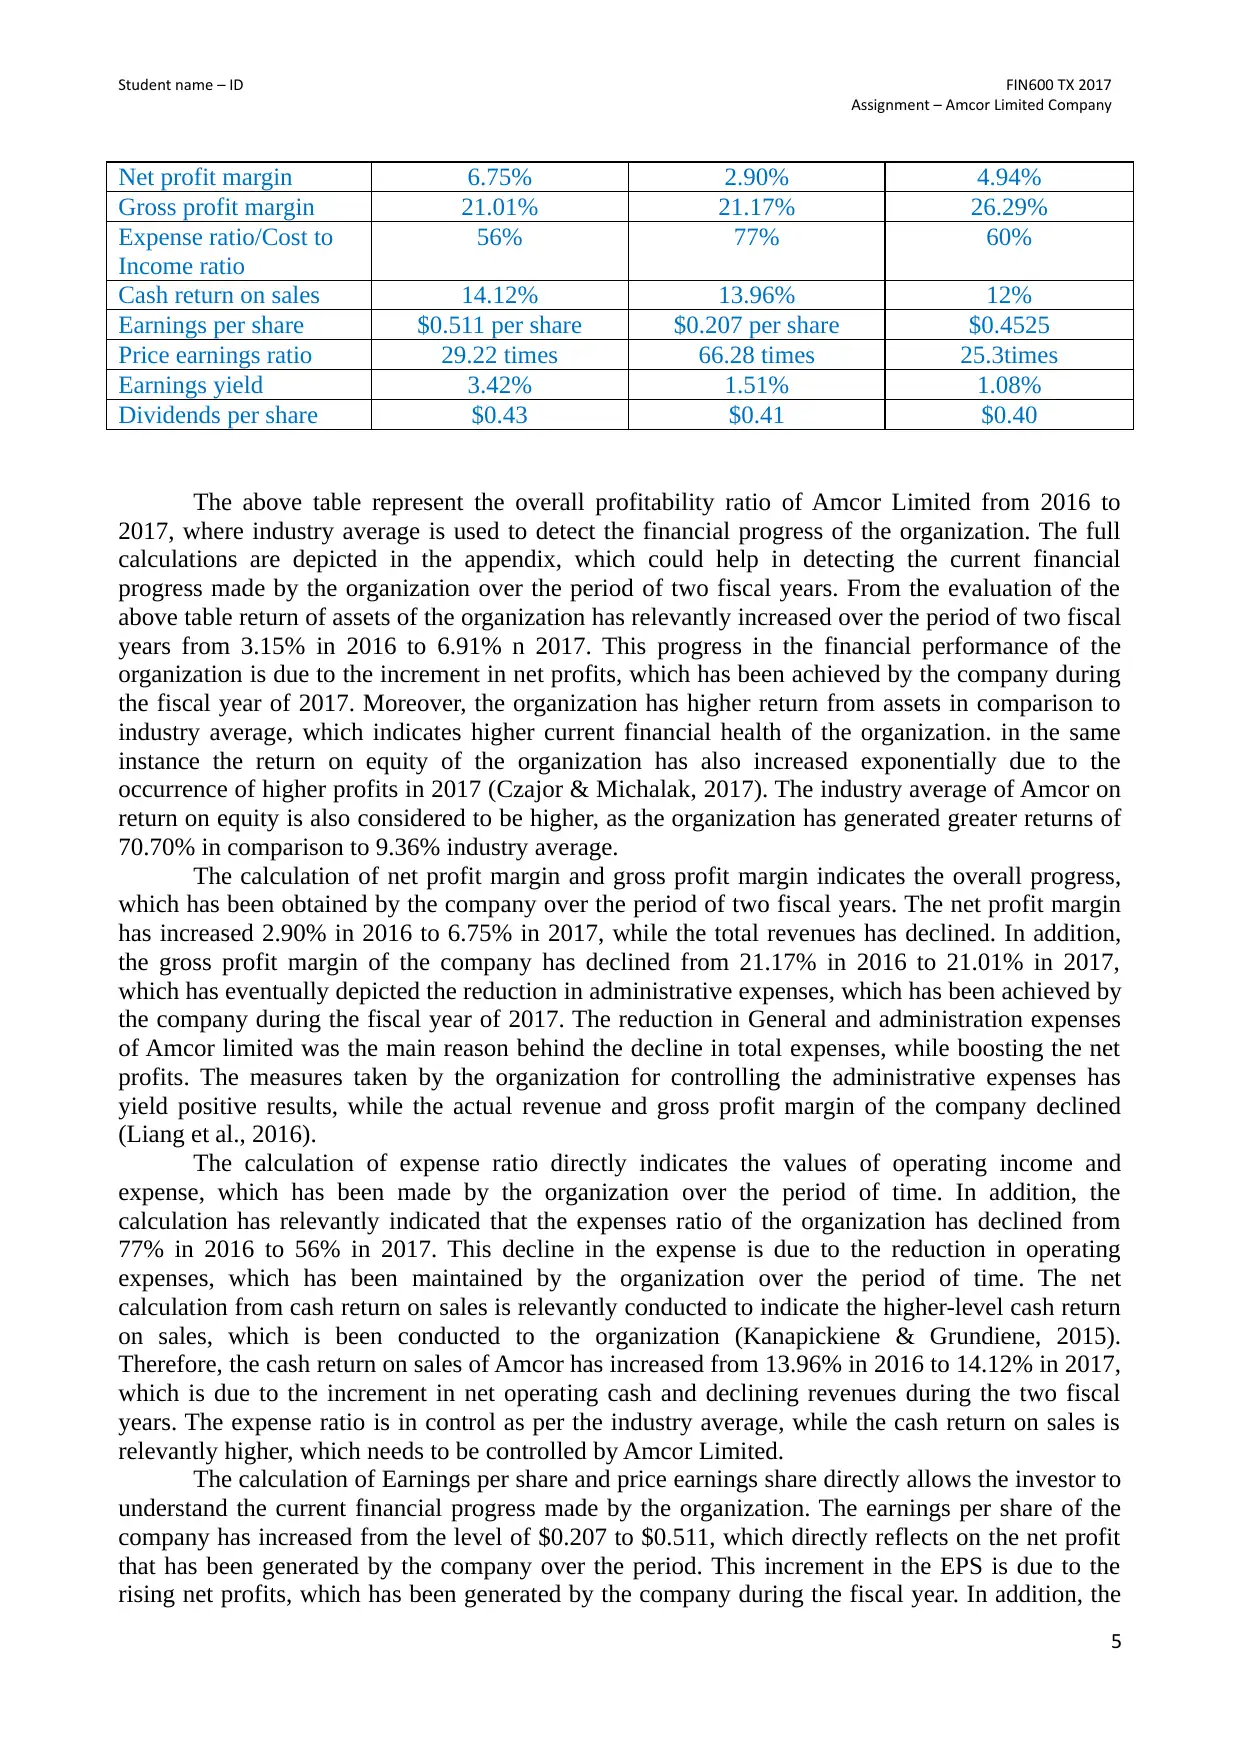
Figure 2: GDP of Australia
(Source: Tradingeconomics.com, 2018)
The above figure indicates the overall GDP of Australia, which has been rising over the
period of five years. This has mainly helped in indicating the financial progress, which has been
made by the Australian economy over the period of time. Hence, the economy condition of
Australia is adequate for business, which could help in improving the level of returns from
investment. According to the Penman (2015), increment in economic growth leads to higher
spending conducted by the citizens and raises the level of their spending, which increases revenue
of the organization. The rising GDP and the higher values of index indicate that the current
economic outlook for Australia is positive for businesses for both domestic and international
organizations.
3 Ratio Analysis
3.1 Profitability and Market ratios
(see appendix for
calculations)
2017 2016 Industry average
Return on assets 6.91% 3.15% 3.13%
Return on equity 70.70% 32.36% 9.36%
4
Assignment – Amcor Limited Company
Figure 1: ASX Index
(Source: Au.spindices.com, 2018)
The economic growth of Australia has relevantly increased, where the expectations of the
economy has grown by 1 percent, while increasing the the GDP at 3.21 per cent. This relevantly
indicates that the economic condition of Australia is relevantly high, which could support the capital
market and growth of different organizations. This has mainly helped in improving the level of
income, which could be generated by organizations due to the presence of a good economy. The
moreover, the S&P/ASX 200 Index is relevantly increasing over the period of 5 years, which could
be seen in the above figure, which directly indicates that the organization are conducting adequate
business and are making higher return from investment. This is the main reason behind the progress
and an increment in the value of capital market index.
Figure 2: GDP of Australia
(Source: Tradingeconomics.com, 2018)
The above figure indicates the overall GDP of Australia, which has been rising over the
period of five years. This has mainly helped in indicating the financial progress, which has been
made by the Australian economy over the period of time. Hence, the economy condition of
Australia is adequate for business, which could help in improving the level of returns from
investment. According to the Penman (2015), increment in economic growth leads to higher
spending conducted by the citizens and raises the level of their spending, which increases revenue
of the organization. The rising GDP and the higher values of index indicate that the current
economic outlook for Australia is positive for businesses for both domestic and international
organizations.
3 Ratio Analysis
3.1 Profitability and Market ratios
(see appendix for
calculations)
2017 2016 Industry average
Return on assets 6.91% 3.15% 3.13%
Return on equity 70.70% 32.36% 9.36%
4
Student name – ID FIN600 TX 2017
Assignment – Amcor Limited Company
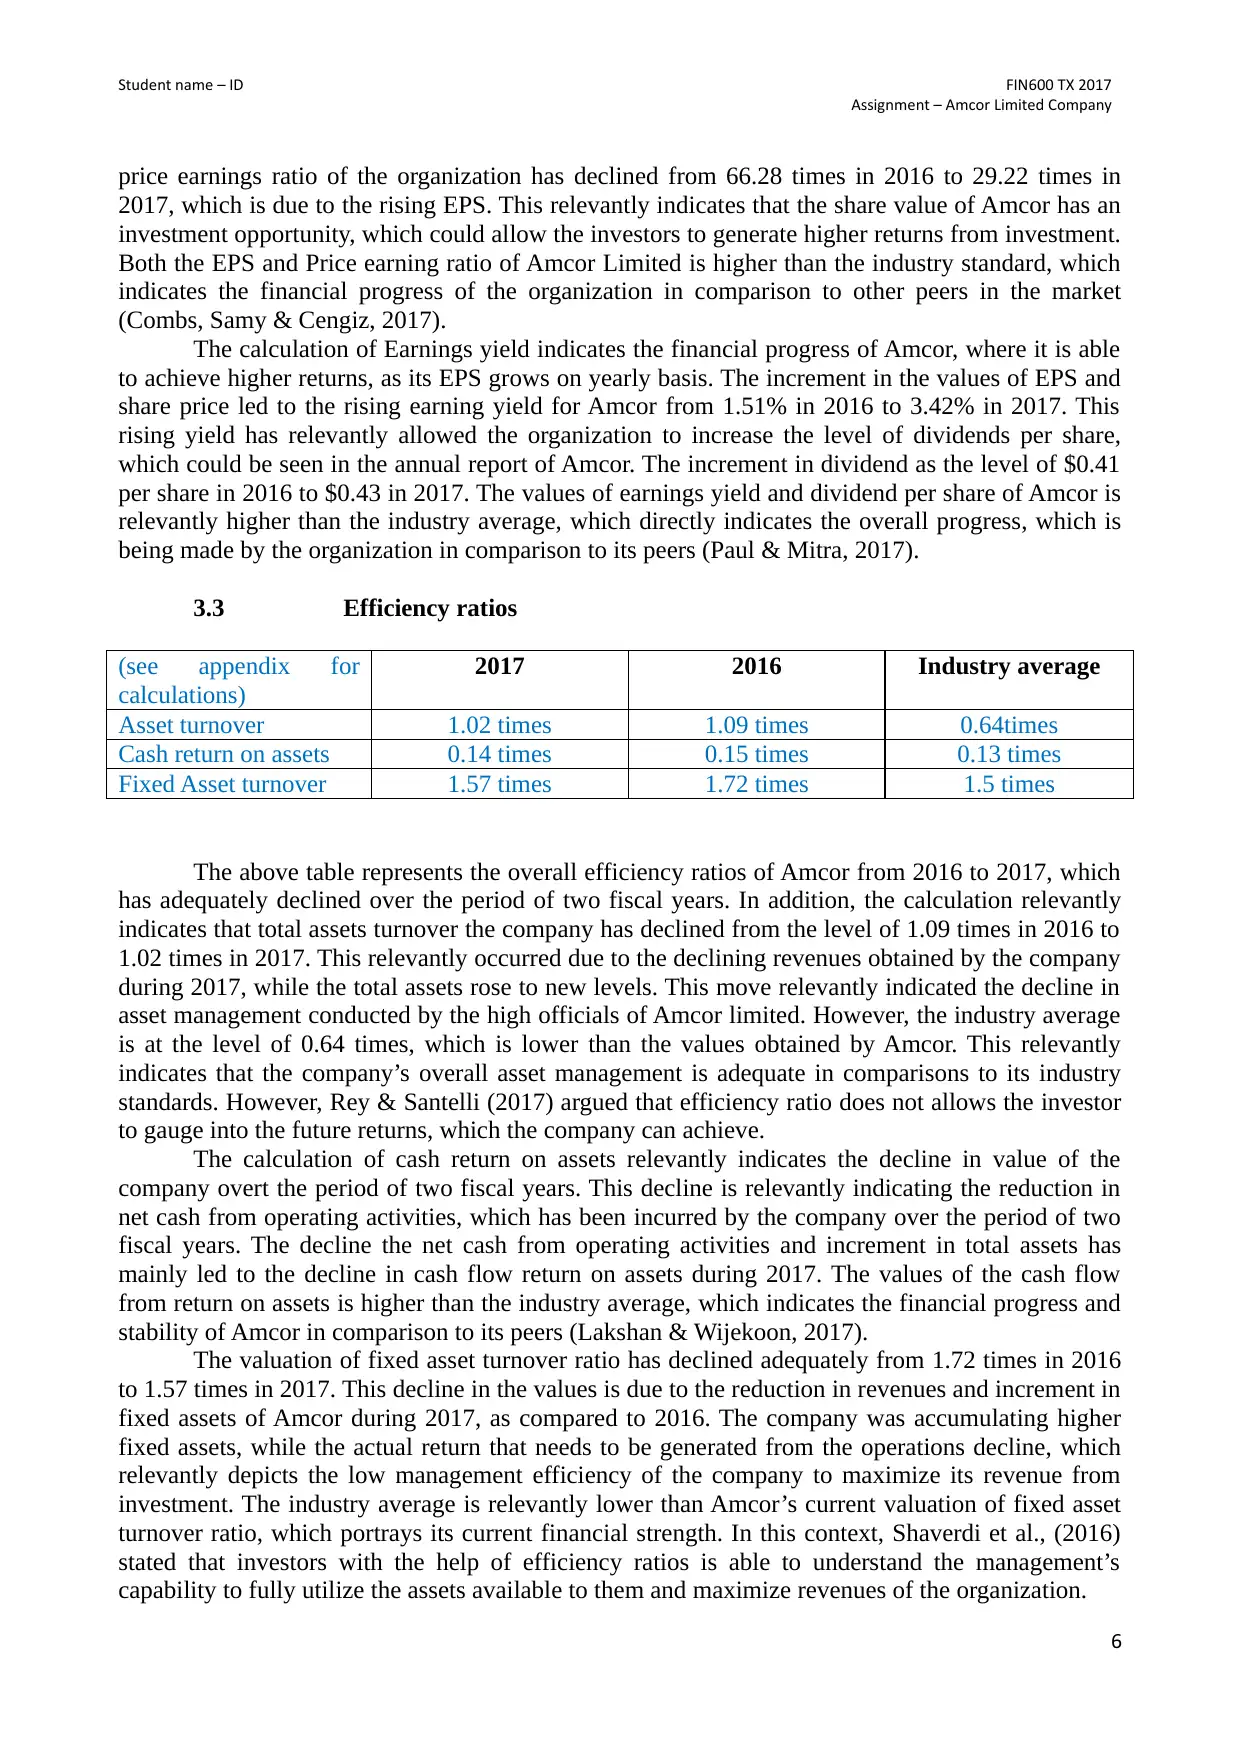
Net profit margin 6.75% 2.90% 4.94%
Gross profit margin 21.01% 21.17% 26.29%
Expense ratio/Cost to
Income ratio
56% 77% 60%
Cash return on sales 14.12% 13.96% 12%
Earnings per share $0.511 per share $0.207 per share $0.4525
Price earnings ratio 29.22 times 66.28 times 25.3times
Earnings yield 3.42% 1.51% 1.08%
Dividends per share $0.43 $0.41 $0.40
The above table represent the overall profitability ratio of Amcor Limited from 2016 to
2017, where industry average is used to detect the financial progress of the organization. The full
calculations are depicted in the appendix, which could help in detecting the current financial
progress made by the organization over the period of two fiscal years. From the evaluation of the
above table return of assets of the organization has relevantly increased over the period of two fiscal
years from 3.15% in 2016 to 6.91% n 2017. This progress in the financial performance of the
organization is due to the increment in net profits, which has been achieved by the company during
the fiscal year of 2017. Moreover, the organization has higher return from assets in comparison to
industry average, which indicates higher current financial health of the organization. in the same
instance the return on equity of the organization has also increased exponentially due to the
occurrence of higher profits in 2017 (Czajor & Michalak, 2017). The industry average of Amcor on
return on equity is also considered to be higher, as the organization has generated greater returns of
70.70% in comparison to 9.36% industry average.
The calculation of net profit margin and gross profit margin indicates the overall progress,
which has been obtained by the company over the period of two fiscal years. The net profit margin
has increased 2.90% in 2016 to 6.75% in 2017, while the total revenues has declined. In addition,
the gross profit margin of the company has declined from 21.17% in 2016 to 21.01% in 2017,
which has eventually depicted the reduction in administrative expenses, which has been achieved by
the company during the fiscal year of 2017. The reduction in General and administration expenses
of Amcor limited was the main reason behind the decline in total expenses, while boosting the net
profits. The measures taken by the organization for controlling the administrative expenses has
yield positive results, while the actual revenue and gross profit margin of the company declined
(Liang et al., 2016).
The calculation of expense ratio directly indicates the values of operating income and
expense, which has been made by the organization over the period of time. In addition, the
calculation has relevantly indicated that the expenses ratio of the organization has declined from
77% in 2016 to 56% in 2017. This decline in the expense is due to the reduction in operating
expenses, which has been maintained by the organization over the period of time. The net
calculation from cash return on sales is relevantly conducted to indicate the higher-level cash return
on sales, which is been conducted to the organization (Kanapickiene & Grundiene, 2015).
Therefore, the cash return on sales of Amcor has increased from 13.96% in 2016 to 14.12% in 2017,
which is due to the increment in net operating cash and declining revenues during the two fiscal
years. The expense ratio is in control as per the industry average, while the cash return on sales is
relevantly higher, which needs to be controlled by Amcor Limited.
The calculation of Earnings per share and price earnings share directly allows the investor to
understand the current financial progress made by the organization. The earnings per share of the
company has increased from the level of $0.207 to $0.511, which directly reflects on the net profit
that has been generated by the company over the period. This increment in the EPS is due to the
rising net profits, which has been generated by the company during the fiscal year. In addition, the
5
Assignment – Amcor Limited Company
Net profit margin 6.75% 2.90% 4.94%
Gross profit margin 21.01% 21.17% 26.29%
Expense ratio/Cost to
Income ratio
56% 77% 60%
Cash return on sales 14.12% 13.96% 12%
Earnings per share $0.511 per share $0.207 per share $0.4525
Price earnings ratio 29.22 times 66.28 times 25.3times
Earnings yield 3.42% 1.51% 1.08%
Dividends per share $0.43 $0.41 $0.40
The above table represent the overall profitability ratio of Amcor Limited from 2016 to
2017, where industry average is used to detect the financial progress of the organization. The full
calculations are depicted in the appendix, which could help in detecting the current financial
progress made by the organization over the period of two fiscal years. From the evaluation of the
above table return of assets of the organization has relevantly increased over the period of two fiscal
years from 3.15% in 2016 to 6.91% n 2017. This progress in the financial performance of the
organization is due to the increment in net profits, which has been achieved by the company during
the fiscal year of 2017. Moreover, the organization has higher return from assets in comparison to
industry average, which indicates higher current financial health of the organization. in the same
instance the return on equity of the organization has also increased exponentially due to the
occurrence of higher profits in 2017 (Czajor & Michalak, 2017). The industry average of Amcor on
return on equity is also considered to be higher, as the organization has generated greater returns of
70.70% in comparison to 9.36% industry average.
The calculation of net profit margin and gross profit margin indicates the overall progress,
which has been obtained by the company over the period of two fiscal years. The net profit margin
has increased 2.90% in 2016 to 6.75% in 2017, while the total revenues has declined. In addition,
the gross profit margin of the company has declined from 21.17% in 2016 to 21.01% in 2017,
which has eventually depicted the reduction in administrative expenses, which has been achieved by
the company during the fiscal year of 2017. The reduction in General and administration expenses
of Amcor limited was the main reason behind the decline in total expenses, while boosting the net
profits. The measures taken by the organization for controlling the administrative expenses has
yield positive results, while the actual revenue and gross profit margin of the company declined
(Liang et al., 2016).
The calculation of expense ratio directly indicates the values of operating income and
expense, which has been made by the organization over the period of time. In addition, the
calculation has relevantly indicated that the expenses ratio of the organization has declined from
77% in 2016 to 56% in 2017. This decline in the expense is due to the reduction in operating
expenses, which has been maintained by the organization over the period of time. The net
calculation from cash return on sales is relevantly conducted to indicate the higher-level cash return
on sales, which is been conducted to the organization (Kanapickiene & Grundiene, 2015).
Therefore, the cash return on sales of Amcor has increased from 13.96% in 2016 to 14.12% in 2017,
which is due to the increment in net operating cash and declining revenues during the two fiscal
years. The expense ratio is in control as per the industry average, while the cash return on sales is
relevantly higher, which needs to be controlled by Amcor Limited.
The calculation of Earnings per share and price earnings share directly allows the investor to
understand the current financial progress made by the organization. The earnings per share of the
company has increased from the level of $0.207 to $0.511, which directly reflects on the net profit
that has been generated by the company over the period. This increment in the EPS is due to the
rising net profits, which has been generated by the company during the fiscal year. In addition, the
5
⊘ This is a preview!⊘
Do you want full access?
Subscribe today to unlock all pages.
Trusted by 1+ million students worldwide
Student name – ID FIN600 TX 2017
Assignment – Amcor Limited Company
price earnings ratio of the organization has declined from 66.28 times in 2016 to 29.22 times in
2017, which is due to the rising EPS. This relevantly indicates that the share value of Amcor has an
investment opportunity, which could allow the investors to generate higher returns from investment.
Both the EPS and Price earning ratio of Amcor Limited is higher than the industry standard, which
indicates the financial progress of the organization in comparison to other peers in the market
(Combs, Samy & Cengiz, 2017).
The calculation of Earnings yield indicates the financial progress of Amcor, where it is able
to achieve higher returns, as its EPS grows on yearly basis. The increment in the values of EPS and
share price led to the rising earning yield for Amcor from 1.51% in 2016 to 3.42% in 2017. This
rising yield has relevantly allowed the organization to increase the level of dividends per share,
which could be seen in the annual report of Amcor. The increment in dividend as the level of $0.41
per share in 2016 to $0.43 in 2017. The values of earnings yield and dividend per share of Amcor is
relevantly higher than the industry average, which directly indicates the overall progress, which is
being made by the organization in comparison to its peers (Paul & Mitra, 2017).
3.3 Efficiency ratios
(see appendix for
calculations)
2017 2016 Industry average
Asset turnover 1.02 times 1.09 times 0.64times
Cash return on assets 0.14 times 0.15 times 0.13 times
Fixed Asset turnover 1.57 times 1.72 times 1.5 times
The above table represents the overall efficiency ratios of Amcor from 2016 to 2017, which
has adequately declined over the period of two fiscal years. In addition, the calculation relevantly
indicates that total assets turnover the company has declined from the level of 1.09 times in 2016 to
1.02 times in 2017. This relevantly occurred due to the declining revenues obtained by the company
during 2017, while the total assets rose to new levels. This move relevantly indicated the decline in
asset management conducted by the high officials of Amcor limited. However, the industry average
is at the level of 0.64 times, which is lower than the values obtained by Amcor. This relevantly
indicates that the company’s overall asset management is adequate in comparisons to its industry
standards. However, Rey & Santelli (2017) argued that efficiency ratio does not allows the investor
to gauge into the future returns, which the company can achieve.
The calculation of cash return on assets relevantly indicates the decline in value of the
company overt the period of two fiscal years. This decline is relevantly indicating the reduction in
net cash from operating activities, which has been incurred by the company over the period of two
fiscal years. The decline the net cash from operating activities and increment in total assets has
mainly led to the decline in cash flow return on assets during 2017. The values of the cash flow
from return on assets is higher than the industry average, which indicates the financial progress and
stability of Amcor in comparison to its peers (Lakshan & Wijekoon, 2017).
The valuation of fixed asset turnover ratio has declined adequately from 1.72 times in 2016
to 1.57 times in 2017. This decline in the values is due to the reduction in revenues and increment in
fixed assets of Amcor during 2017, as compared to 2016. The company was accumulating higher
fixed assets, while the actual return that needs to be generated from the operations decline, which
relevantly depicts the low management efficiency of the company to maximize its revenue from
investment. The industry average is relevantly lower than Amcor’s current valuation of fixed asset
turnover ratio, which portrays its current financial strength. In this context, Shaverdi et al., (2016)
stated that investors with the help of efficiency ratios is able to understand the management’s
capability to fully utilize the assets available to them and maximize revenues of the organization.
6
Paraphrase This Document
Need a fresh take? Get an instant paraphrase of this document with our AI Paraphraser
Student name – ID FIN600 TX 2017
Assignment – Amcor Limited Company
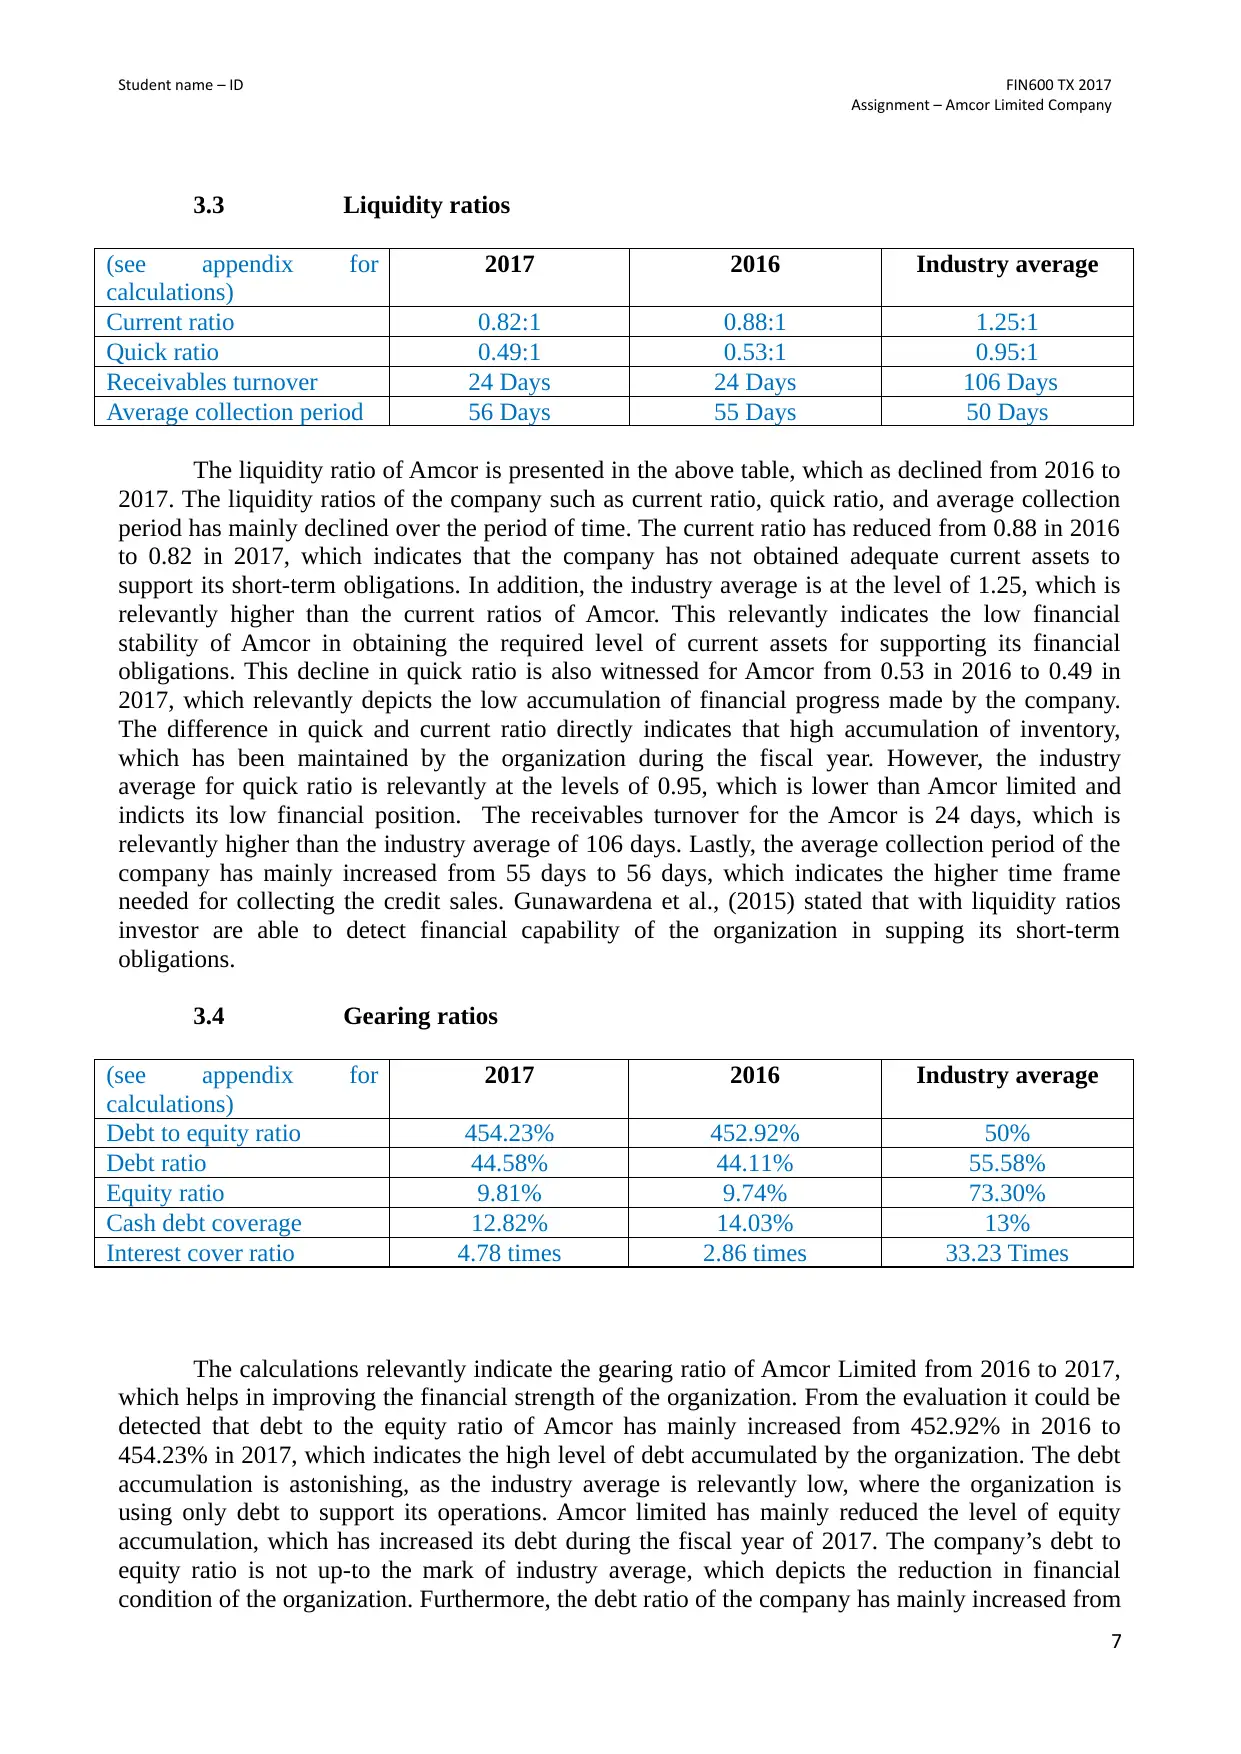
3.3 Liquidity ratios
(see appendix for
calculations)
2017 2016 Industry average
Current ratio 0.82:1 0.88:1 1.25:1
Quick ratio 0.49:1 0.53:1 0.95:1
Receivables turnover 24 Days 24 Days 106 Days
Average collection period 56 Days 55 Days 50 Days
The liquidity ratio of Amcor is presented in the above table, which as declined from 2016 to
2017. The liquidity ratios of the company such as current ratio, quick ratio, and average collection
period has mainly declined over the period of time. The current ratio has reduced from 0.88 in 2016
to 0.82 in 2017, which indicates that the company has not obtained adequate current assets to
support its short-term obligations. In addition, the industry average is at the level of 1.25, which is
relevantly higher than the current ratios of Amcor. This relevantly indicates the low financial
stability of Amcor in obtaining the required level of current assets for supporting its financial
obligations. This decline in quick ratio is also witnessed for Amcor from 0.53 in 2016 to 0.49 in
2017, which relevantly depicts the low accumulation of financial progress made by the company.
The difference in quick and current ratio directly indicates that high accumulation of inventory,
which has been maintained by the organization during the fiscal year. However, the industry
average for quick ratio is relevantly at the levels of 0.95, which is lower than Amcor limited and
indicts its low financial position. The receivables turnover for the Amcor is 24 days, which is
relevantly higher than the industry average of 106 days. Lastly, the average collection period of the
company has mainly increased from 55 days to 56 days, which indicates the higher time frame
needed for collecting the credit sales. Gunawardena et al., (2015) stated that with liquidity ratios
investor are able to detect financial capability of the organization in supping its short-term
obligations.
3.4 Gearing ratios
(see appendix for
calculations)
2017 2016 Industry average
Debt to equity ratio 454.23% 452.92% 50%
Debt ratio 44.58% 44.11% 55.58%
Equity ratio 9.81% 9.74% 73.30%
Cash debt coverage 12.82% 14.03% 13%
Interest cover ratio 4.78 times 2.86 times 33.23 Times
The calculations relevantly indicate the gearing ratio of Amcor Limited from 2016 to 2017,
which helps in improving the financial strength of the organization. From the evaluation it could be
detected that debt to the equity ratio of Amcor has mainly increased from 452.92% in 2016 to
454.23% in 2017, which indicates the high level of debt accumulated by the organization. The debt
accumulation is astonishing, as the industry average is relevantly low, where the organization is
using only debt to support its operations. Amcor limited has mainly reduced the level of equity
accumulation, which has increased its debt during the fiscal year of 2017. The company’s debt to
equity ratio is not up-to the mark of industry average, which depicts the reduction in financial
condition of the organization. Furthermore, the debt ratio of the company has mainly increased from
7
Assignment – Amcor Limited Company
3.3 Liquidity ratios
(see appendix for
calculations)
2017 2016 Industry average
Current ratio 0.82:1 0.88:1 1.25:1
Quick ratio 0.49:1 0.53:1 0.95:1
Receivables turnover 24 Days 24 Days 106 Days
Average collection period 56 Days 55 Days 50 Days
The liquidity ratio of Amcor is presented in the above table, which as declined from 2016 to
2017. The liquidity ratios of the company such as current ratio, quick ratio, and average collection
period has mainly declined over the period of time. The current ratio has reduced from 0.88 in 2016
to 0.82 in 2017, which indicates that the company has not obtained adequate current assets to
support its short-term obligations. In addition, the industry average is at the level of 1.25, which is
relevantly higher than the current ratios of Amcor. This relevantly indicates the low financial
stability of Amcor in obtaining the required level of current assets for supporting its financial
obligations. This decline in quick ratio is also witnessed for Amcor from 0.53 in 2016 to 0.49 in
2017, which relevantly depicts the low accumulation of financial progress made by the company.
The difference in quick and current ratio directly indicates that high accumulation of inventory,
which has been maintained by the organization during the fiscal year. However, the industry
average for quick ratio is relevantly at the levels of 0.95, which is lower than Amcor limited and
indicts its low financial position. The receivables turnover for the Amcor is 24 days, which is
relevantly higher than the industry average of 106 days. Lastly, the average collection period of the
company has mainly increased from 55 days to 56 days, which indicates the higher time frame
needed for collecting the credit sales. Gunawardena et al., (2015) stated that with liquidity ratios
investor are able to detect financial capability of the organization in supping its short-term
obligations.
3.4 Gearing ratios
(see appendix for
calculations)
2017 2016 Industry average
Debt to equity ratio 454.23% 452.92% 50%
Debt ratio 44.58% 44.11% 55.58%
Equity ratio 9.81% 9.74% 73.30%
Cash debt coverage 12.82% 14.03% 13%
Interest cover ratio 4.78 times 2.86 times 33.23 Times
The calculations relevantly indicate the gearing ratio of Amcor Limited from 2016 to 2017,
which helps in improving the financial strength of the organization. From the evaluation it could be
detected that debt to the equity ratio of Amcor has mainly increased from 452.92% in 2016 to
454.23% in 2017, which indicates the high level of debt accumulated by the organization. The debt
accumulation is astonishing, as the industry average is relevantly low, where the organization is
using only debt to support its operations. Amcor limited has mainly reduced the level of equity
accumulation, which has increased its debt during the fiscal year of 2017. The company’s debt to
equity ratio is not up-to the mark of industry average, which depicts the reduction in financial
condition of the organization. Furthermore, the debt ratio of the company has mainly increased from
7
Student name – ID FIN600 TX 2017
Assignment – Amcor Limited Company
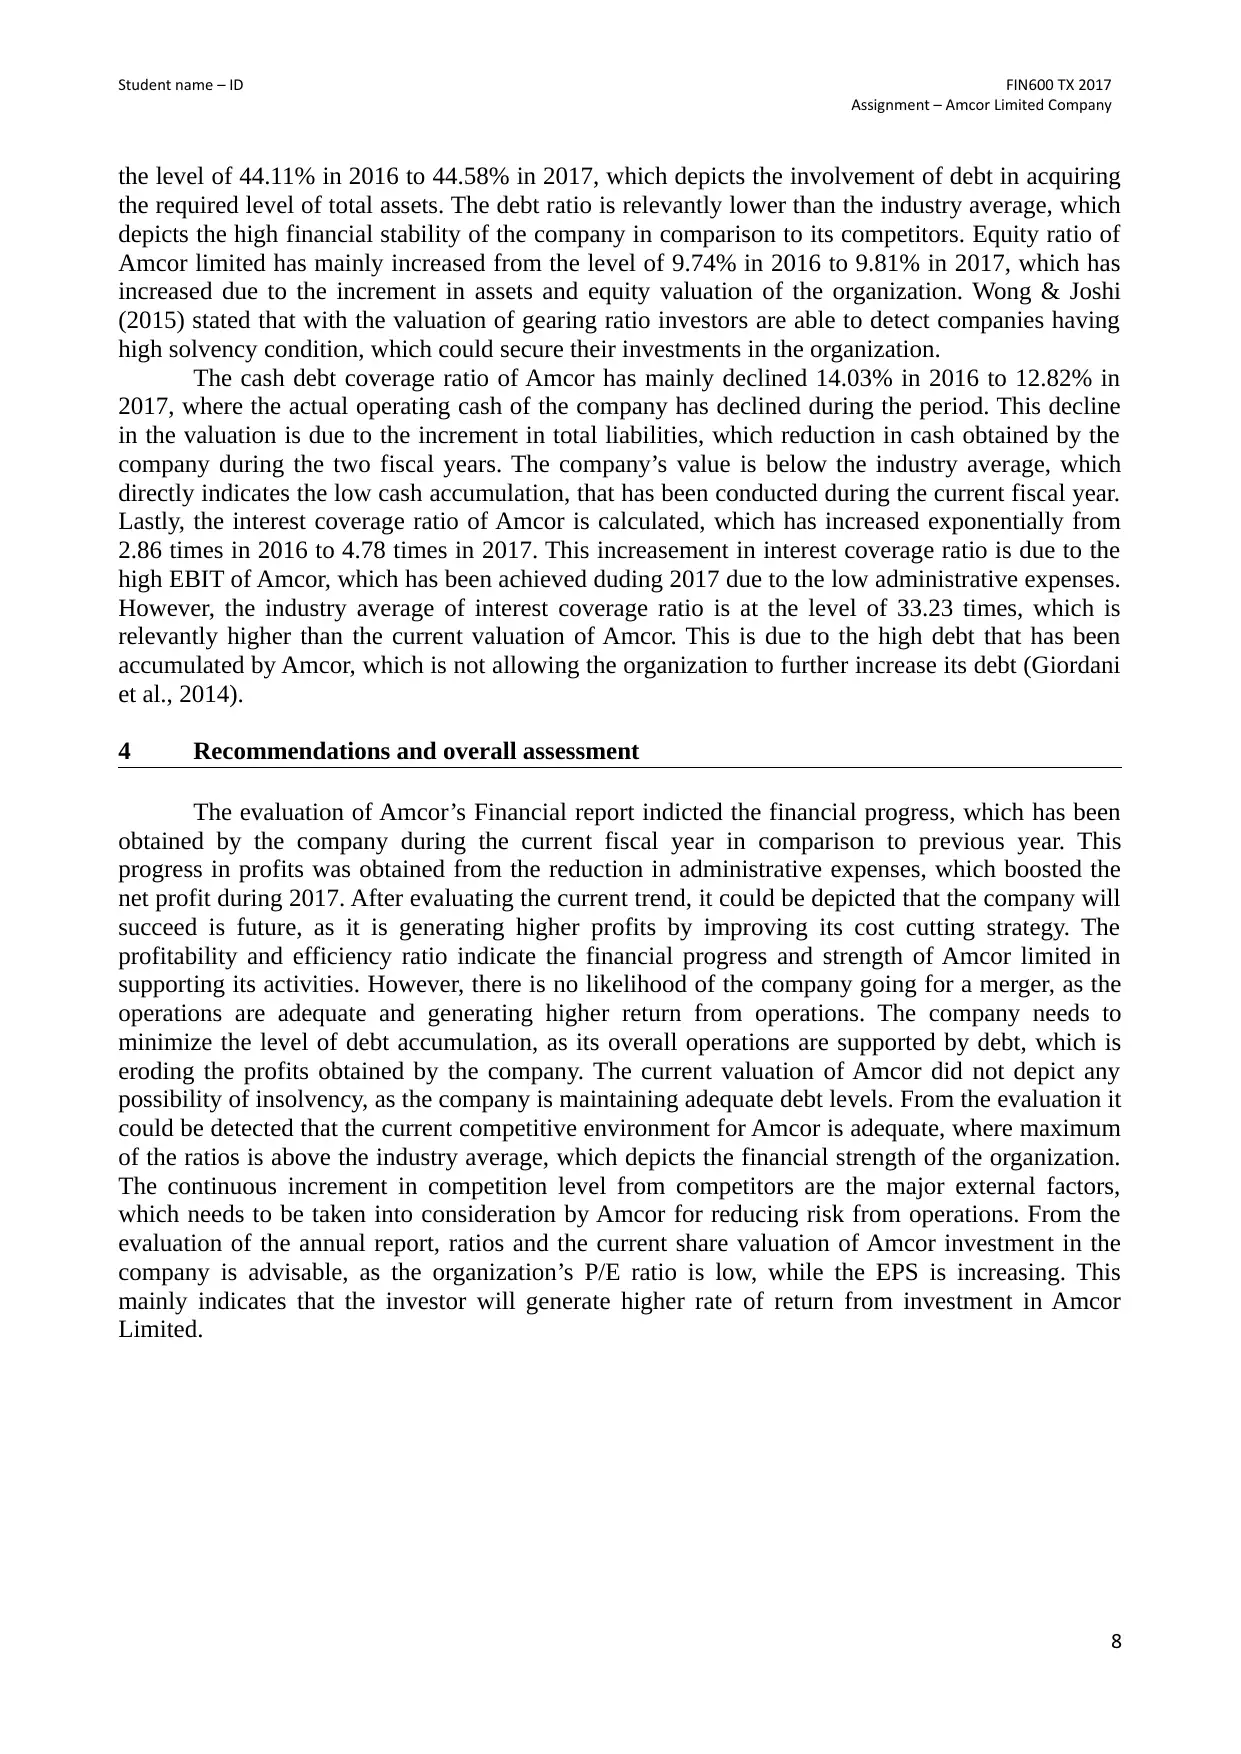
the level of 44.11% in 2016 to 44.58% in 2017, which depicts the involvement of debt in acquiring
the required level of total assets. The debt ratio is relevantly lower than the industry average, which
depicts the high financial stability of the company in comparison to its competitors. Equity ratio of
Amcor limited has mainly increased from the level of 9.74% in 2016 to 9.81% in 2017, which has
increased due to the increment in assets and equity valuation of the organization. Wong & Joshi
(2015) stated that with the valuation of gearing ratio investors are able to detect companies having
high solvency condition, which could secure their investments in the organization.
The cash debt coverage ratio of Amcor has mainly declined 14.03% in 2016 to 12.82% in
2017, where the actual operating cash of the company has declined during the period. This decline
in the valuation is due to the increment in total liabilities, which reduction in cash obtained by the
company during the two fiscal years. The company’s value is below the industry average, which
directly indicates the low cash accumulation, that has been conducted during the current fiscal year.
Lastly, the interest coverage ratio of Amcor is calculated, which has increased exponentially from
2.86 times in 2016 to 4.78 times in 2017. This increasement in interest coverage ratio is due to the
high EBIT of Amcor, which has been achieved duding 2017 due to the low administrative expenses.
However, the industry average of interest coverage ratio is at the level of 33.23 times, which is
relevantly higher than the current valuation of Amcor. This is due to the high debt that has been
accumulated by Amcor, which is not allowing the organization to further increase its debt (Giordani
et al., 2014).
4 Recommendations and overall assessment
The evaluation of Amcor’s Financial report indicted the financial progress, which has been
obtained by the company during the current fiscal year in comparison to previous year. This
progress in profits was obtained from the reduction in administrative expenses, which boosted the
net profit during 2017. After evaluating the current trend, it could be depicted that the company will
succeed is future, as it is generating higher profits by improving its cost cutting strategy. The
profitability and efficiency ratio indicate the financial progress and strength of Amcor limited in
supporting its activities. However, there is no likelihood of the company going for a merger, as the
operations are adequate and generating higher return from operations. The company needs to
minimize the level of debt accumulation, as its overall operations are supported by debt, which is
eroding the profits obtained by the company. The current valuation of Amcor did not depict any
possibility of insolvency, as the company is maintaining adequate debt levels. From the evaluation it
could be detected that the current competitive environment for Amcor is adequate, where maximum
of the ratios is above the industry average, which depicts the financial strength of the organization.
The continuous increment in competition level from competitors are the major external factors,
which needs to be taken into consideration by Amcor for reducing risk from operations. From the
evaluation of the annual report, ratios and the current share valuation of Amcor investment in the
company is advisable, as the organization’s P/E ratio is low, while the EPS is increasing. This
mainly indicates that the investor will generate higher rate of return from investment in Amcor
Limited.
8
Assignment – Amcor Limited Company
the level of 44.11% in 2016 to 44.58% in 2017, which depicts the involvement of debt in acquiring
the required level of total assets. The debt ratio is relevantly lower than the industry average, which
depicts the high financial stability of the company in comparison to its competitors. Equity ratio of
Amcor limited has mainly increased from the level of 9.74% in 2016 to 9.81% in 2017, which has
increased due to the increment in assets and equity valuation of the organization. Wong & Joshi
(2015) stated that with the valuation of gearing ratio investors are able to detect companies having
high solvency condition, which could secure their investments in the organization.
The cash debt coverage ratio of Amcor has mainly declined 14.03% in 2016 to 12.82% in
2017, where the actual operating cash of the company has declined during the period. This decline
in the valuation is due to the increment in total liabilities, which reduction in cash obtained by the
company during the two fiscal years. The company’s value is below the industry average, which
directly indicates the low cash accumulation, that has been conducted during the current fiscal year.
Lastly, the interest coverage ratio of Amcor is calculated, which has increased exponentially from
2.86 times in 2016 to 4.78 times in 2017. This increasement in interest coverage ratio is due to the
high EBIT of Amcor, which has been achieved duding 2017 due to the low administrative expenses.
However, the industry average of interest coverage ratio is at the level of 33.23 times, which is
relevantly higher than the current valuation of Amcor. This is due to the high debt that has been
accumulated by Amcor, which is not allowing the organization to further increase its debt (Giordani
et al., 2014).
4 Recommendations and overall assessment
The evaluation of Amcor’s Financial report indicted the financial progress, which has been
obtained by the company during the current fiscal year in comparison to previous year. This
progress in profits was obtained from the reduction in administrative expenses, which boosted the
net profit during 2017. After evaluating the current trend, it could be depicted that the company will
succeed is future, as it is generating higher profits by improving its cost cutting strategy. The
profitability and efficiency ratio indicate the financial progress and strength of Amcor limited in
supporting its activities. However, there is no likelihood of the company going for a merger, as the
operations are adequate and generating higher return from operations. The company needs to
minimize the level of debt accumulation, as its overall operations are supported by debt, which is
eroding the profits obtained by the company. The current valuation of Amcor did not depict any
possibility of insolvency, as the company is maintaining adequate debt levels. From the evaluation it
could be detected that the current competitive environment for Amcor is adequate, where maximum
of the ratios is above the industry average, which depicts the financial strength of the organization.
The continuous increment in competition level from competitors are the major external factors,
which needs to be taken into consideration by Amcor for reducing risk from operations. From the
evaluation of the annual report, ratios and the current share valuation of Amcor investment in the
company is advisable, as the organization’s P/E ratio is low, while the EPS is increasing. This
mainly indicates that the investor will generate higher rate of return from investment in Amcor
Limited.
8
⊘ This is a preview!⊘
Do you want full access?
Subscribe today to unlock all pages.
Trusted by 1+ million students worldwide
Student name – ID FIN600 TX 2017
Assignment – Amcor Limited Company
5 References/Bibliography
Abdul-Baki, Z., Uthman, A. B., & Sannia, M. (2014). Financial ratios as performance measure: A
comparison of IFRS and Nigerian GAAP. Accounting and Management Information
Systems, 13(1), 82.
Abdul-Baki, Z., Uthman, A. B., & Sannia, M. (2014). Financial ratios as performance measure: A
comparison of IFRS and Nigerian GAAP. Accounting and Management Information
Systems, 13(1), 82.
Adam, M. H. M. (2014). Evaluating the Financial Performance of Banks using financial ratios-A
case study of Erbil Bank for Investment and Finance. European Journal of Accounting
Auditing and Finance Research, 2(6), 162-177.
Amcor.com. (2018). Amcor.com. Retrieved 10 August 2018, from
https://www.amcor.com/investors/financial-information/annual-reports
Au.spindices.com. (2018). Au.spindices.com. Retrieved 10 August 2018, from
https://au.spindices.com/indices/equity/sp-asx-200
Christian, S. (2015). The Impact of Financial Ratios on Stock Return: Evidence From Retail
Company Listed in Indonesia Stock Exchange During 2011-2013. iBuss Management, 3(2).
Combs, A. M., Samy, M., & Cengiz, H. (2017). An Analysis of how Financial Ratios of Companies
in Turkey Are Affected by National Standards, and IFRS. International Business Research.
Czajor, P., & Michalak, M. (2017). Operating Lease Capitalization-Reasons and its Impact on
Financial Ratios of WIG30 and sWIG80 Companies. Przedsiębiorczość i Zarządzanie, 18(1,
cz. 1 Practical and Theoretical Issues in Contemporary Financial Management), 23-36.
Giordani, P., Jacobson, T., Von Schedvin, E., & Villani, M. (2014). Taking the twists into account:
Predicting firm bankruptcy risk with splines of financial ratios. Journal of Financial and
Quantitative Analysis, 49(4), 1071-1099.
Gunawardena, M. M. D., Peiris, H. R. I., Wijesundera, A. A. V. I., Weerasinghe, D. A. S., &
Krishna, T. P. C. R. (2015). Predictability of Stock Returns Using Financial Ratios Empirical
Evidence from Colombo Stock Exchange.
Ibrahim, S. N. S., Arif, H. M., & Paino, H. (2017). The Relationship between Corporate
Governance Disclosures and Balance Sheet Ratios. Gading Journal for the Social
Sciences, 11(02), 33-40.
Johri, S., & Maheshwari, T. (2015). An empirical study on the practical efficacy of ideal financial
ratios. Pranjana, 18(1), 41.
Kanapickienė, R., & Grundienė, Ž. (2015). The model of fraud detection in financial statements by
means of financial ratios. Procedia-Social and Behavioral Sciences, 213, 321-327.
Khan, M. N., & Khokhar, I. (2015). The effect of selected financial ratios on profitability: an
empirical analysis of listed firms of cement sector in Saudi Arabia. Quarterly Journal of
Econometrics Research, 1(1), 1-12.
Lakshan, A. I., & Wijekoon, W. M. H. N. (2017). The use of financial ratios in predicting corporate
failure in Sri Lanka. GSTF Journal on Business Review (GBR), 2(4).
Li, T., Zhang, F., Zhang, H., & Chen, L. (2016). Predictability of Foodstuff Stock Returns Using
Financial Ratios in the UK and US Food Markets. Advance Journal of Food Science and
Technology, 10(5), 336-342.
Liang, D., Lu, C. C., Tsai, C. F., & Shih, G. A. (2016). Financial ratios and corporate governance
indicators in bankruptcy prediction: A comprehensive study. European Journal of
Operational Research, 252(2), 561-572.
Morales-Díaz, J., & Zamora-Ramírez, C. (2018). The Impact of IFRS 16 on Key Financial Ratios:
A New Methodological Approach. Accounting in Europe, 15(1), 105-133.
Paul, S., & Mitra, G. (2017). Impact of Financial Ratios on Stock Price: A Comparative Study with
Hang Seng and Nifty Data. Research Bulletin, 43(2), 64-71.
9
Paraphrase This Document
Need a fresh take? Get an instant paraphrase of this document with our AI Paraphraser
Student name – ID FIN600 TX 2017
Assignment – Amcor Limited Company
Penman, S. H. (2015). Financial Ratios and Equity Valuation. Wiley Encyclopedia of Management,
1-7.
Rey, A., & Santelli, F. (2017). The Relationship between Financial Ratios and Sporting Performance
in Italy’s Serie A. International Journal of Business and Management, 12(12), 53.
Shaverdi, M., Ramezani, I., Tahmasebi, R., & Rostamy, A. A. A. (2016). Combining fuzzy AHP and
fuzzy TOPSIS with financial ratios to design a novel performance evaluation
model. International Journal of Fuzzy Systems, 18(2), 248-262.
Tradingeconomics.com. (2018). Tradingeconomics.com. Retrieved 10 August 2018, from
https://tradingeconomics.com/australia/gdp-growth
Wong, K., & Joshi, M. (2015). The impact of lease capitalisation on financial statements and key
ratios: Evidence from Australia. Australasian Accounting, Business and Finance
Journal, 9(3), 27-44.
10
Student name – ID FIN600 TX 2017
Assignment – Amcor Limited Company
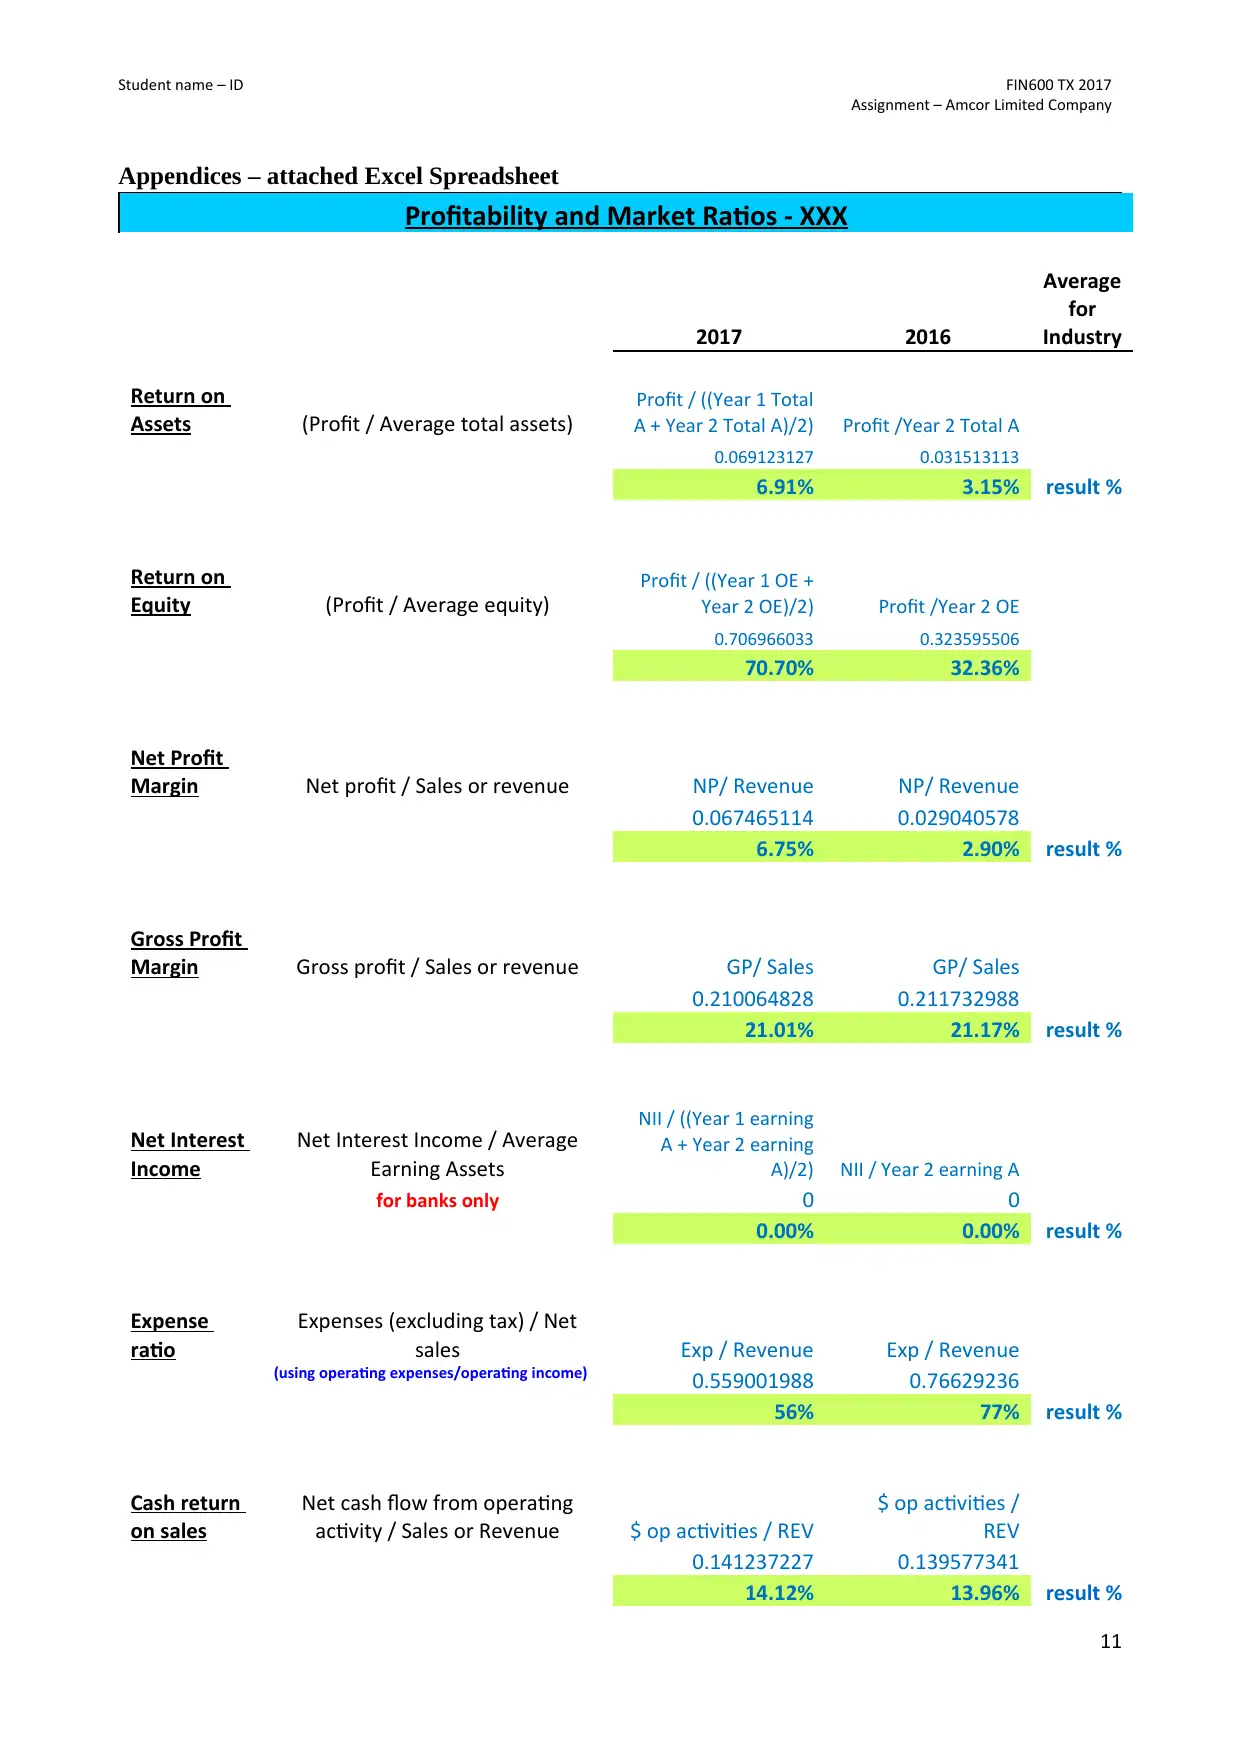
Appendices – attached Excel Spreadsheet
Profitability and Market Ratios - XXX
2017 2016
Average
for
Industry
Return on
Assets (Profit / Average total assets)
Profit / ((Year 1 Total
A + Year 2 Total A)/2) Profit /Year 2 Total A
0.069123127 0.031513113
6.91% 3.15% result %
Return on
Equity (Profit / Average equity)
Profit / ((Year 1 OE +
Year 2 OE)/2) Profit /Year 2 OE
0.706966033 0.323595506
70.70% 32.36%
Net Profit
Margin Net profit / Sales or revenue NP/ Revenue NP/ Revenue
0.067465114 0.029040578
6.75% 2.90% result %
Gross Profit
Margin Gross profit / Sales or revenue GP/ Sales GP/ Sales
0.210064828 0.211732988
21.01% 21.17% result %
Net Interest
Income
Net Interest Income / Average
Earning Assets
NII / ((Year 1 earning
A + Year 2 earning
A)/2) NII / Year 2 earning A
for banks only 0 0
0.00% 0.00% result %
Expense
ratio
Expenses (excluding tax) / Net
sales Exp / Revenue Exp / Revenue
(using operating expenses/operating income) 0.559001988 0.76629236
56% 77% result %
Cash return
on sales
Net cash flow from operating
activity / Sales or Revenue $ op activities / REV
$ op activities /
REV
0.141237227 0.139577341
14.12% 13.96% result %
11
Assignment – Amcor Limited Company
Appendices – attached Excel Spreadsheet
Profitability and Market Ratios - XXX
2017 2016
Average
for
Industry
Return on
Assets (Profit / Average total assets)
Profit / ((Year 1 Total
A + Year 2 Total A)/2) Profit /Year 2 Total A
0.069123127 0.031513113
6.91% 3.15% result %
Return on
Equity (Profit / Average equity)
Profit / ((Year 1 OE +
Year 2 OE)/2) Profit /Year 2 OE
0.706966033 0.323595506
70.70% 32.36%
Net Profit
Margin Net profit / Sales or revenue NP/ Revenue NP/ Revenue
0.067465114 0.029040578
6.75% 2.90% result %
Gross Profit
Margin Gross profit / Sales or revenue GP/ Sales GP/ Sales
0.210064828 0.211732988
21.01% 21.17% result %
Net Interest
Income
Net Interest Income / Average
Earning Assets
NII / ((Year 1 earning
A + Year 2 earning
A)/2) NII / Year 2 earning A
for banks only 0 0
0.00% 0.00% result %
Expense
ratio
Expenses (excluding tax) / Net
sales Exp / Revenue Exp / Revenue
(using operating expenses/operating income) 0.559001988 0.76629236
56% 77% result %
Cash return
on sales
Net cash flow from operating
activity / Sales or Revenue $ op activities / REV
$ op activities /
REV
0.141237227 0.139577341
14.12% 13.96% result %
11
⊘ This is a preview!⊘
Do you want full access?
Subscribe today to unlock all pages.
Trusted by 1+ million students worldwide
1 out of 16
Related Documents


Your All-in-One AI-Powered Toolkit for Academic Success.
+13062052269
info@desklib.com
Available 24*7 on WhatsApp / Email
![[object Object]](/_next/static/media/star-bottom.7253800d.svg)
Unlock your academic potential
Copyright © 2020–2026 A2Z Services. All Rights Reserved. Developed and managed by ZUCOL.