FINA600 Financial Analysis of OZ Minerals: A Case Study Report
VerifiedAdded on 2023/05/30
|17
|4231
|484
Report
AI Summary
This report provides a financial analysis of ASX-listed OZ Minerals, comparing its financial performance and position between 2016 and 2017. The analysis includes a review of consolidated financial statements (income, equity, balance sheet, and cash flows) and a detailed ratio analysis covering profitability, liquidity, market performance, efficiency, and capital structure. The report further discusses the impact of the competitive and political environment, ethical considerations related to insolvency, external factors, and the potential for mergers or acquisitions. Based on the analysis, the report concludes with recommendations regarding the suitability of OZ Minerals as an investment opportunity.
Running head: FINANCIAL MANAGEMENT
Financial management
Name of the student
Name of the university
Student ID
Author note
Financial management
Name of the student
Name of the university
Student ID
Author note
Paraphrase This Document
Need a fresh take? Get an instant paraphrase of this document with our AI Paraphraser
1FINANCIAL MANAGEMENT
Table of Contents
Introduction................................................................................................................................2
Financial statement analysis.......................................................................................................3
Ratio analysis.............................................................................................................................4
Comparison with industry peer..................................................................................................9
Impact of competitive and political environment on business.................................................10
Ethical considerations while becomes insolvent......................................................................11
External factors........................................................................................................................11
Likelihood for merger and acquisition.....................................................................................12
Recommendation......................................................................................................................12
Reference..................................................................................................................................13
Appendix..................................................................................................................................16
2FINANCIAL MANAGEMENT
Introduction
The main objective of the report is to focus on the financial position and financial
performance of ASX listed company OZ minerals for the year 2017 and it will compared
with the performance of the year 2016. In analysing and comparing the financial performance
of the company the report will analyse the company’s financial statements for the year ended
2017. Various key ratios those will be considered under the report are profitability ratio,
liquidity ratio, market performance ratio, efficiency ratio and capital structure ratio. After
analysing the financial position of the company the report will highlight the impact of
competitive and political environment on the business. Further, the report will discuss the
relevant ethical considerations in case the entity becomes insolvent. It will further focus on
the external factors required to be considered and potential if acquisition or merger. Finally,
on the basis of interpretation the report will deliver some recommendations regarding
whether the company is suitable for making investment into or not (Ozminerals.com, 2018).
The Australian based and ASX 100 listed company OZ Minerals is one of the biggest
mining company that is focussed on copper. It was established through merging 2 Australian
based companies Oxiana and Zinifex during the year 2008. The company is further focussed
on providing opportunities to its employees and committed for providing values, safety and
capital discipline. Main growth strategy of the company is to focus on the creation of value
for its shareholders. The company owns and operates the copper – silver – gold mine at
Prominent Hall. Further, at present it is developing biggest copper gold resources at
Carrapateena of Australia. Various mines operated by the company are West Musgrave,
Prominent Hall, Carrapateena, Centrogold, Antas and Pedra Branca. It has exceptional
experience regarding exploration in Australia and global sites. Major strategy of the company
⊘ This is a preview!⊘
Do you want full access?
Subscribe today to unlock all pages.
Trusted by 1+ million students worldwide
3FINANCIAL MANAGEMENT
is to grow through the exploration which in turn will add value to the company
(Ozminerals.com, 2018).
Financial statement analysis
From analysis of the annual report of the company for the year ended 31st December
2017 it has been found that the company’s annual report includes 4 financial statements.
These are –
Consolidated statement of comprehensive income
Consolidated statement of changes in equity
Consolidated balance sheet
Consolidated statement of cash flows
From analysing above mentioned financial statements of the company it has been
identified that the operating profit of the company amounted to $ 320.70 million and net
profit was amounted to $ 231.10 million. Apart from the sales revenue, significant amount
was received by the company from changes in the inventories of concentrates and ores. Major
expenses of the company were towards consumables and other direct costs amounted to $
332.3 million and depreciation expenses amounted to $ 323.5 million. Looking into the
statement of changes in equity it has been found that the opening balance for shareholders
equity was amounted to $ 2,354.3 million whereas the closing balance of the same was
amounted to $ 2,516.3 million. The reason of changes in the opening balance and closing
balance was addition of comprehensive income and subtraction of dividends and other
transactions directly attribution to equity (Asx.com.au, 2018). While analysing the balance
sheet of the company it has been found that the balance sheet of the company is segregated
into 5 sections including the current assets, non-current assets, current liabilities, non-current
liabilities and equity. Total assets including current as well as non-current assets amounted to
Paraphrase This Document
Need a fresh take? Get an instant paraphrase of this document with our AI Paraphraser
4FINANCIAL MANAGEMENT
$ 227 million whereas Total liabilities including current as well as non-current liabilities
amounted to $ 310 million. However, it is found that the current assets of the company are
sufficient to meet current liabilities of the company. Further, it is found that the equity of the
company amounted to $ 2,516 million. Hence, it is evidential from the balance sheet that the
major portion of the capital structure of the company includes equity and nominal portion
includes debt. Hence it can be stated that the company’s capital sources is mainly the equity
and its liabilities do not include any short term or long term borrowings. Finally, the cash
flow statement of the company is segregated into 3 sections including cash flow from the
operating activities, cash flow from the investing activities and cash flow from the financing
activities (Harris & Mazibas, 2013). Total cash generated by the company from operating
activities amounted to $ 342.9 million, cash outflow towards investing activities amounted to
$ 197 million and cash outflow towards financing activities amounted to $ 67 million. Net
increase in the cash held was amounted to $ 78.9 million. Major source of cash generated
from operating activities was cash receipts from customers amounted to $ 1000.3 million
whereas cash payments towards operating activities was cash payments to employees and
suppliers amounted to $ 568.5 million. Further, during the year the company made payment
towards plant, property and equipment amounted to $ 151.20 million (He & Krishnamurthy,
2013).
Ratio analysis
Once the company’s financial statements are prepared they shall be analysed for
interpreting the company’s financial position and comparing its financial performance with
its peers in the industry or with the company’s previous year’s results. Various techniques are
there to analyse the financial statement of the company. However, here in the given case the
performance of OZ Minerals will be analysed through using various ratios like profitability
5FINANCIAL MANAGEMENT
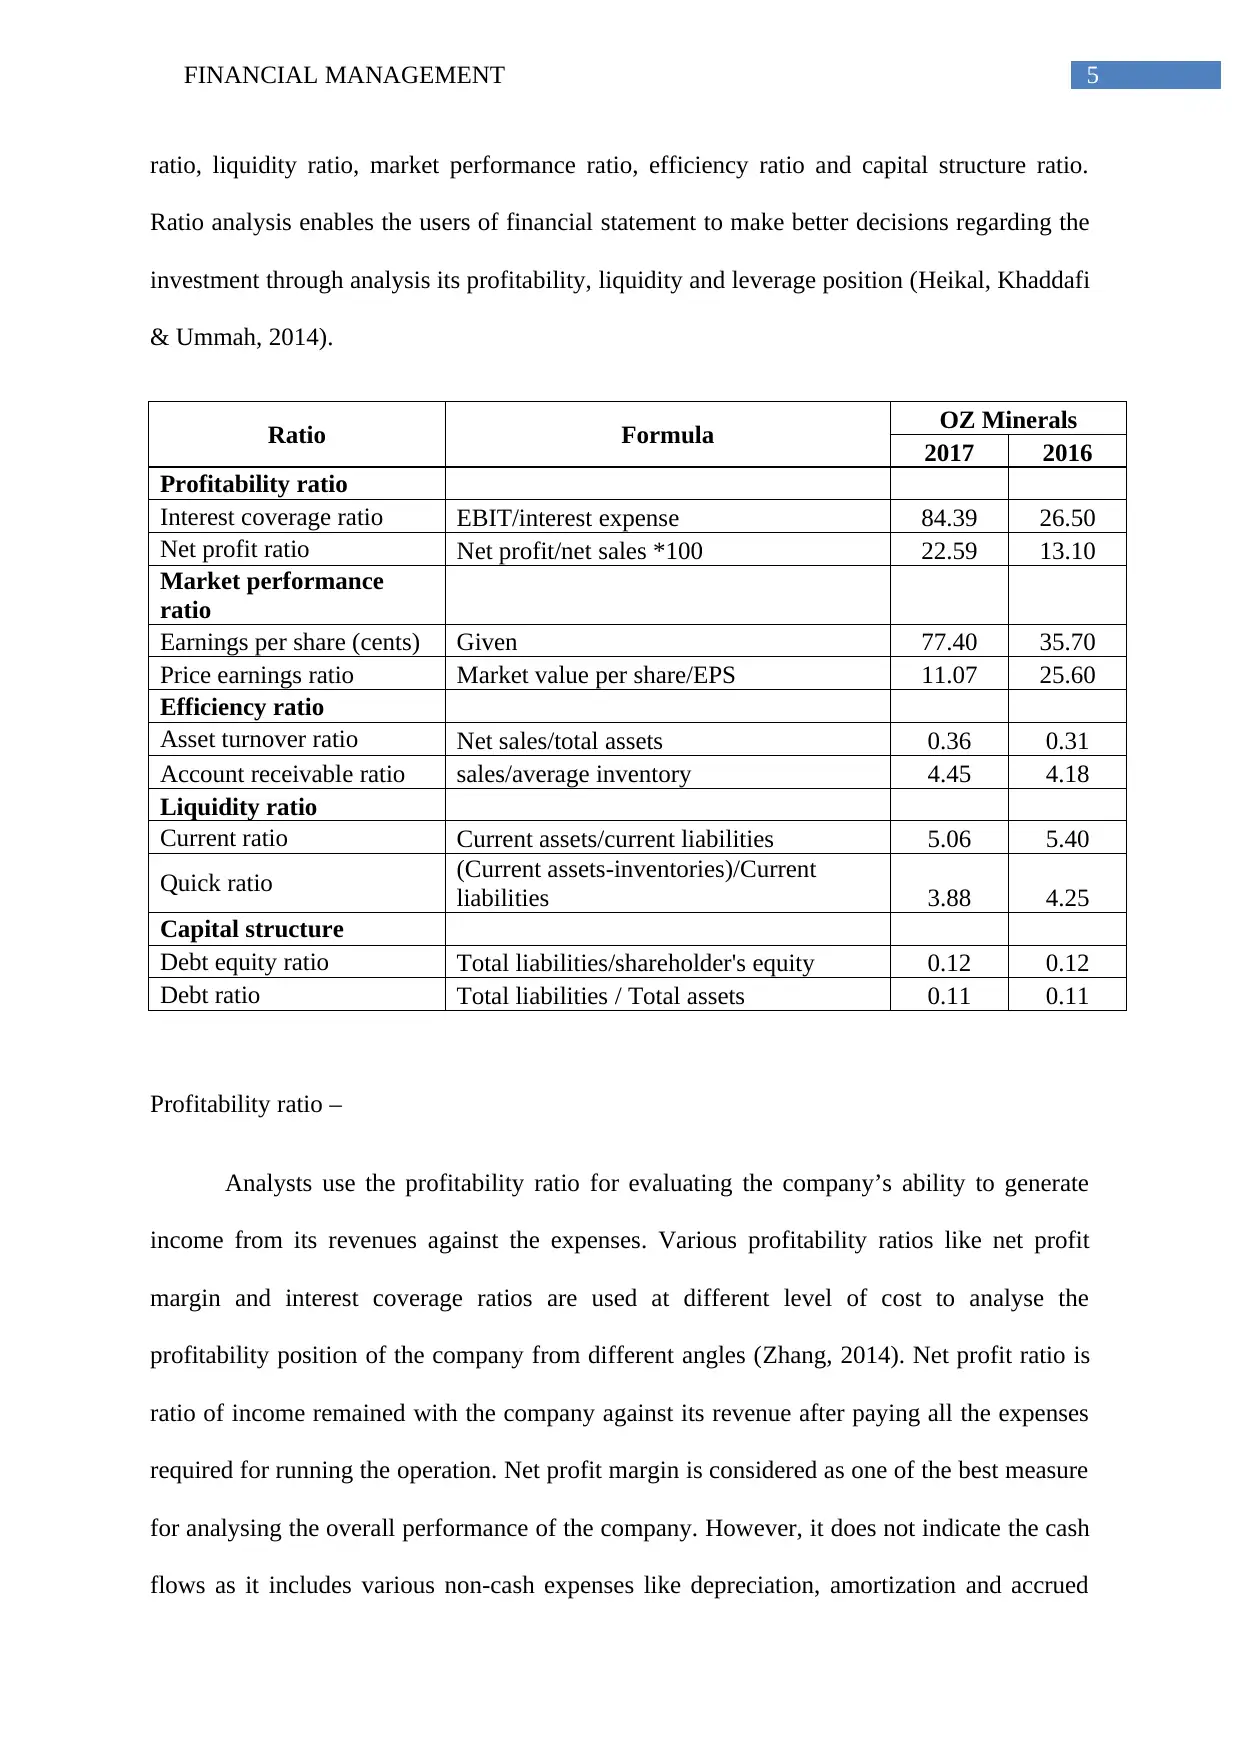
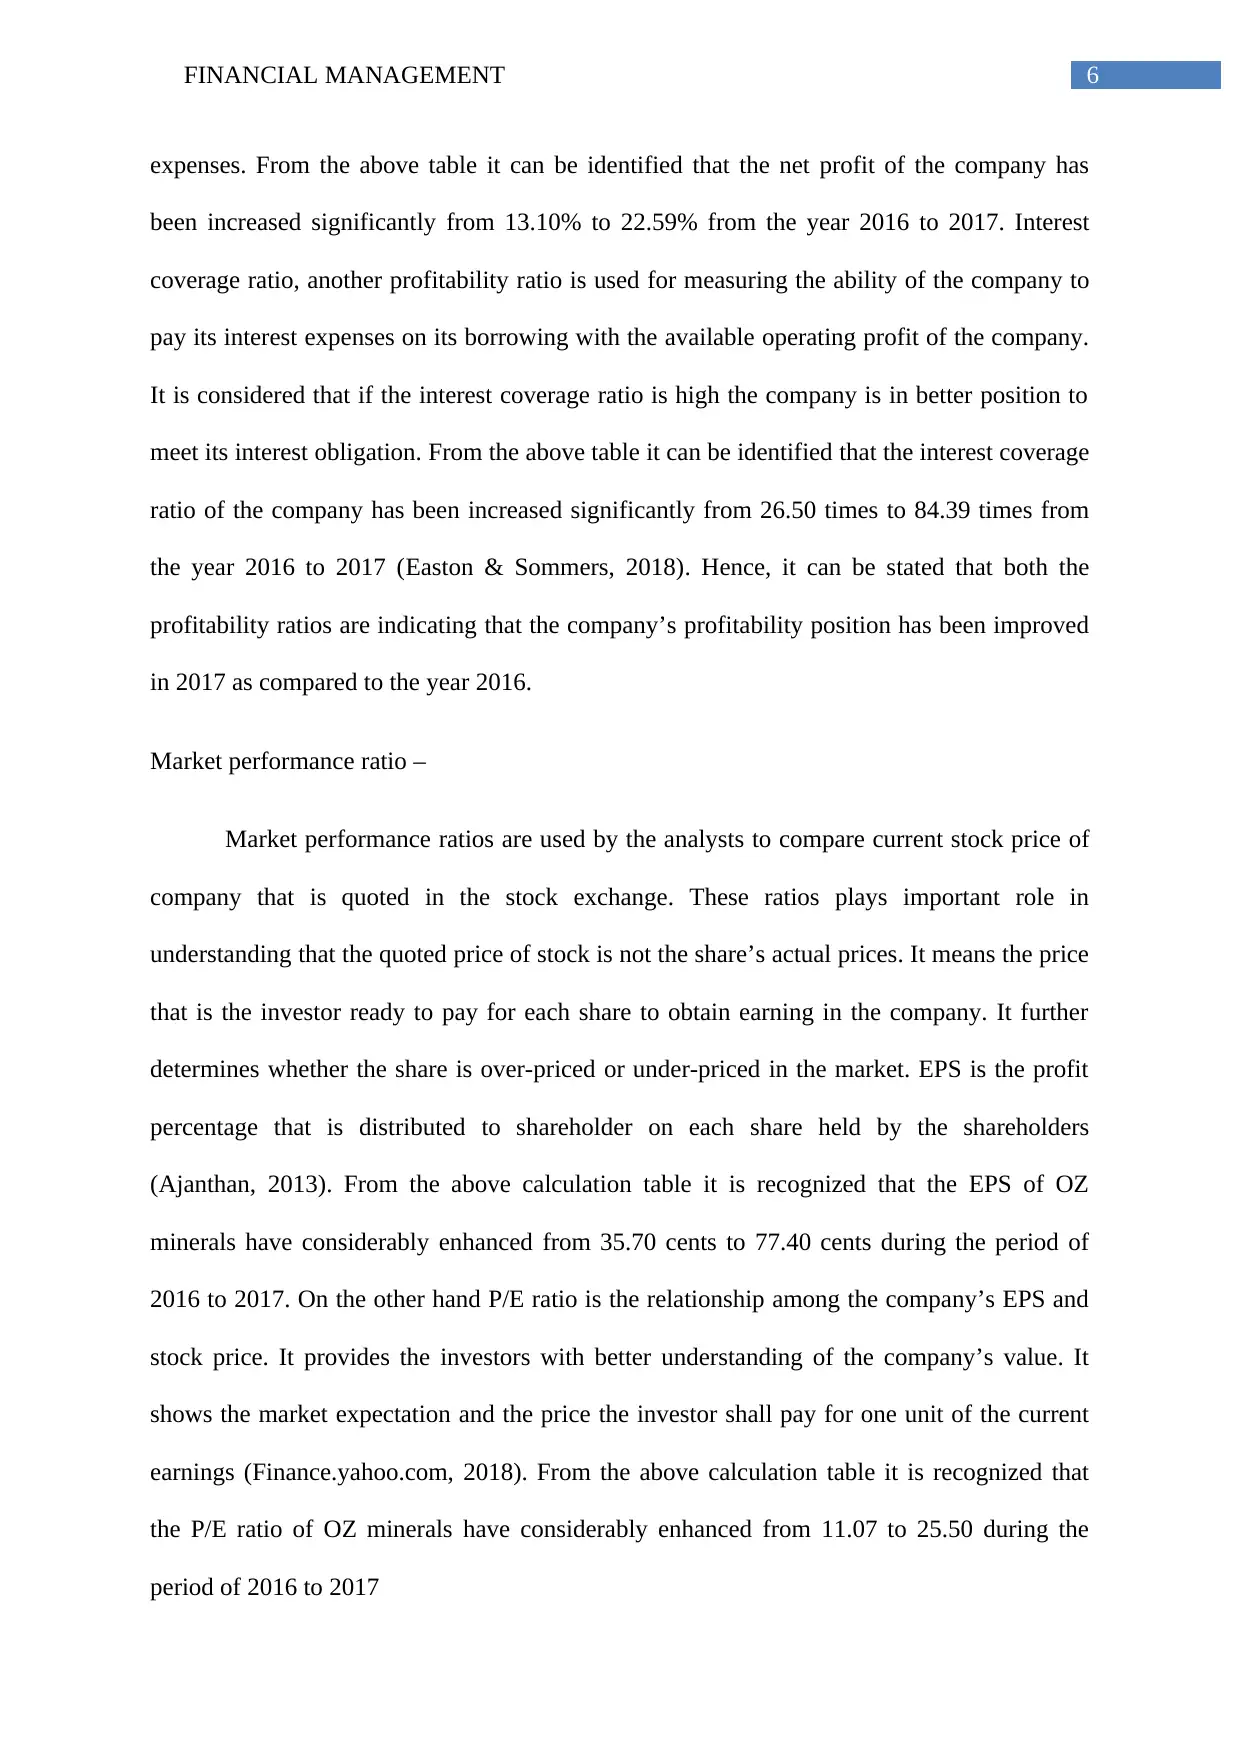
ratio, liquidity ratio, market performance ratio, efficiency ratio and capital structure ratio.
Ratio analysis enables the users of financial statement to make better decisions regarding the
investment through analysis its profitability, liquidity and leverage position (Heikal, Khaddafi
& Ummah, 2014).
Ratio Formula OZ Minerals
2017 2016
Profitability ratio
Interest coverage ratio EBIT/interest expense 84.39 26.50
Net profit ratio Net profit/net sales *100 22.59 13.10
Market performance
ratio
Earnings per share (cents) Given 77.40 35.70
Price earnings ratio Market value per share/EPS 11.07 25.60
Efficiency ratio
Asset turnover ratio Net sales/total assets 0.36 0.31
Account receivable ratio sales/average inventory 4.45 4.18
Liquidity ratio
Current ratio Current assets/current liabilities 5.06 5.40
Quick ratio (Current assets-inventories)/Current
liabilities 3.88 4.25
Capital structure
Debt equity ratio Total liabilities/shareholder's equity 0.12 0.12
Debt ratio Total liabilities / Total assets 0.11 0.11
Profitability ratio –
Analysts use the profitability ratio for evaluating the company’s ability to generate
income from its revenues against the expenses. Various profitability ratios like net profit
margin and interest coverage ratios are used at different level of cost to analyse the
profitability position of the company from different angles (Zhang, 2014). Net profit ratio is
ratio of income remained with the company against its revenue after paying all the expenses
required for running the operation. Net profit margin is considered as one of the best measure
for analysing the overall performance of the company. However, it does not indicate the cash
flows as it includes various non-cash expenses like depreciation, amortization and accrued
⊘ This is a preview!⊘
Do you want full access?
Subscribe today to unlock all pages.
Trusted by 1+ million students worldwide
6FINANCIAL MANAGEMENT
expenses. From the above table it can be identified that the net profit of the company has
been increased significantly from 13.10% to 22.59% from the year 2016 to 2017. Interest
coverage ratio, another profitability ratio is used for measuring the ability of the company to
pay its interest expenses on its borrowing with the available operating profit of the company.
It is considered that if the interest coverage ratio is high the company is in better position to
meet its interest obligation. From the above table it can be identified that the interest coverage
ratio of the company has been increased significantly from 26.50 times to 84.39 times from
the year 2016 to 2017 (Easton & Sommers, 2018). Hence, it can be stated that both the
profitability ratios are indicating that the company’s profitability position has been improved
in 2017 as compared to the year 2016.
Market performance ratio –
Market performance ratios are used by the analysts to compare current stock price of
company that is quoted in the stock exchange. These ratios plays important role in
understanding that the quoted price of stock is not the share’s actual prices. It means the price
that is the investor ready to pay for each share to obtain earning in the company. It further
determines whether the share is over-priced or under-priced in the market. EPS is the profit
percentage that is distributed to shareholder on each share held by the shareholders
(Ajanthan, 2013). From the above calculation table it is recognized that the EPS of OZ
minerals have considerably enhanced from 35.70 cents to 77.40 cents during the period of
2016 to 2017. On the other hand P/E ratio is the relationship among the company’s EPS and
stock price. It provides the investors with better understanding of the company’s value. It
shows the market expectation and the price the investor shall pay for one unit of the current
earnings (Finance.yahoo.com, 2018). From the above calculation table it is recognized that
the P/E ratio of OZ minerals have considerably enhanced from 11.07 to 25.50 during the
period of 2016 to 2017
Paraphrase This Document
Need a fresh take? Get an instant paraphrase of this document with our AI Paraphraser
7FINANCIAL MANAGEMENT
Efficiency ratio –
Efficiency ratio is used for measuring the ability of the company regarding usage of
its assets and managing the liabilities. Various ratios used for measuring the efficiencies are
accounts receivables ratio and asset turnover ratio. Asset turnover ratio is utilised to measure
total amount of revenues that is earned by the company against each dollar of the asset owned
by it. This ratio is computed by the analysts for analysing the business efficiencies regarding
the asset utilization for generating revenues (Halili, Saleh & Zeitun, 2015). It determines the
company’s efficiency regarding asset deployment and higher ratio denotes better performance
of the company. From the above calculation table it is recognized that the asset turnover ratio
of OZ minerals has been increased from 0.31 to 0.36 over the period of 2016 to 2017. On the
other hand, the receivable turnover ratio is used for measuring the efficiency regarding the
activeness of the company in collecting the debts and extending the credits (Bodie, Kane &
Marcus, 2014). The company with higher receivable ratio is considered as favourable and the
company will be regarded as more efficient. From the above calculation table it is recognized
that the receivable turnover ratio of OZ minerals have increased from 4.18 to 4.45 during the
period of 2016 to 2017.
Liquidity ratio –
Liquidity ratio or the short-term solvency ratios are computed to measure the ability
of the entity regarding its ability to meet the short-term obligations with the short-term
available assets of the company. These ratios are used to determine the company’s ability to
avoid financial distress over the short term period. 2 liquidity ratios computed for measuring
the liquidity status of OZ Minerals are current ratio and quick ratio. The company’s current
assets are the assets that are likely to be converted into cash in 12 months period and current
liabilities are likely to be paid in 12 months period (Altaf & Shah, 2017). Though the current
8FINANCIAL MANAGEMENT
ratio of the company is dependent upon the type of industry it is dealing in, generally the
current ratio of 1 or more is considered good. From the above calculation table it is
recognized that though the current ratio of OZ minerals are considerably high for both the
years it is reduced from 5.40 to 5.06 during the period of 2016 to 2017. On the other hand
while calculating the quick ratio the assets those take reasonable time to convert into cash
like inventories are not considered. From the above calculation table it is recognized that
though the quick ratio of OZ minerals are considerably high for both the years it is reduced
from 4.25 to 3.88 during the period of 2016 to 2017
Capital structure ratio –
Capital structure ratios are computed by the analysts to measure the ability of the
company to meet its financial obligation over the long term period. The analysts who use
these ratios are mainly the creditors and shareholders to make it sure that the money invested
by them will be repaid by the company. Debt equity ratio reveals the relationship among the
fund raised by the company through borrowing and equity. To be more specific it is the
borrowing that is raised from outsiders and are payable after 12 months period. On the other
hand, equity is the amount invested by the shareholders. Though the appropriate debt equity
ratio of the company depends upon the type of the industry in which the company operates,
2:1 is considered better for any company (Akeem et al., 2014). It is found that for both 2016
as well as 2017 the company’s debt equity ratio is 0.12. On the other hand, the debt ratio
measures the leverage extension of the company. It is the proportion of total debt against the
assets of the company. In other words, it reveals the percentage of company’s asset financed
through debt. It is found that for both 2016 as well as 2017 the company’s debt ratio is 0.11
(Albul, Jaffee & Tchistyi, 2015).
⊘ This is a preview!⊘
Do you want full access?
Subscribe today to unlock all pages.
Trusted by 1+ million students worldwide
9FINANCIAL MANAGEMENT
Hence, from the above discussion it can be determined that the profitability position
as well as the market performance of the company has been improved in 2017 as compared to
the previous year. Further, the efficiency of the company has been improved along with the
stability in capital structure. However, the liquidity position of the company has been fallen
slightly in 2017 as compared to 2016.
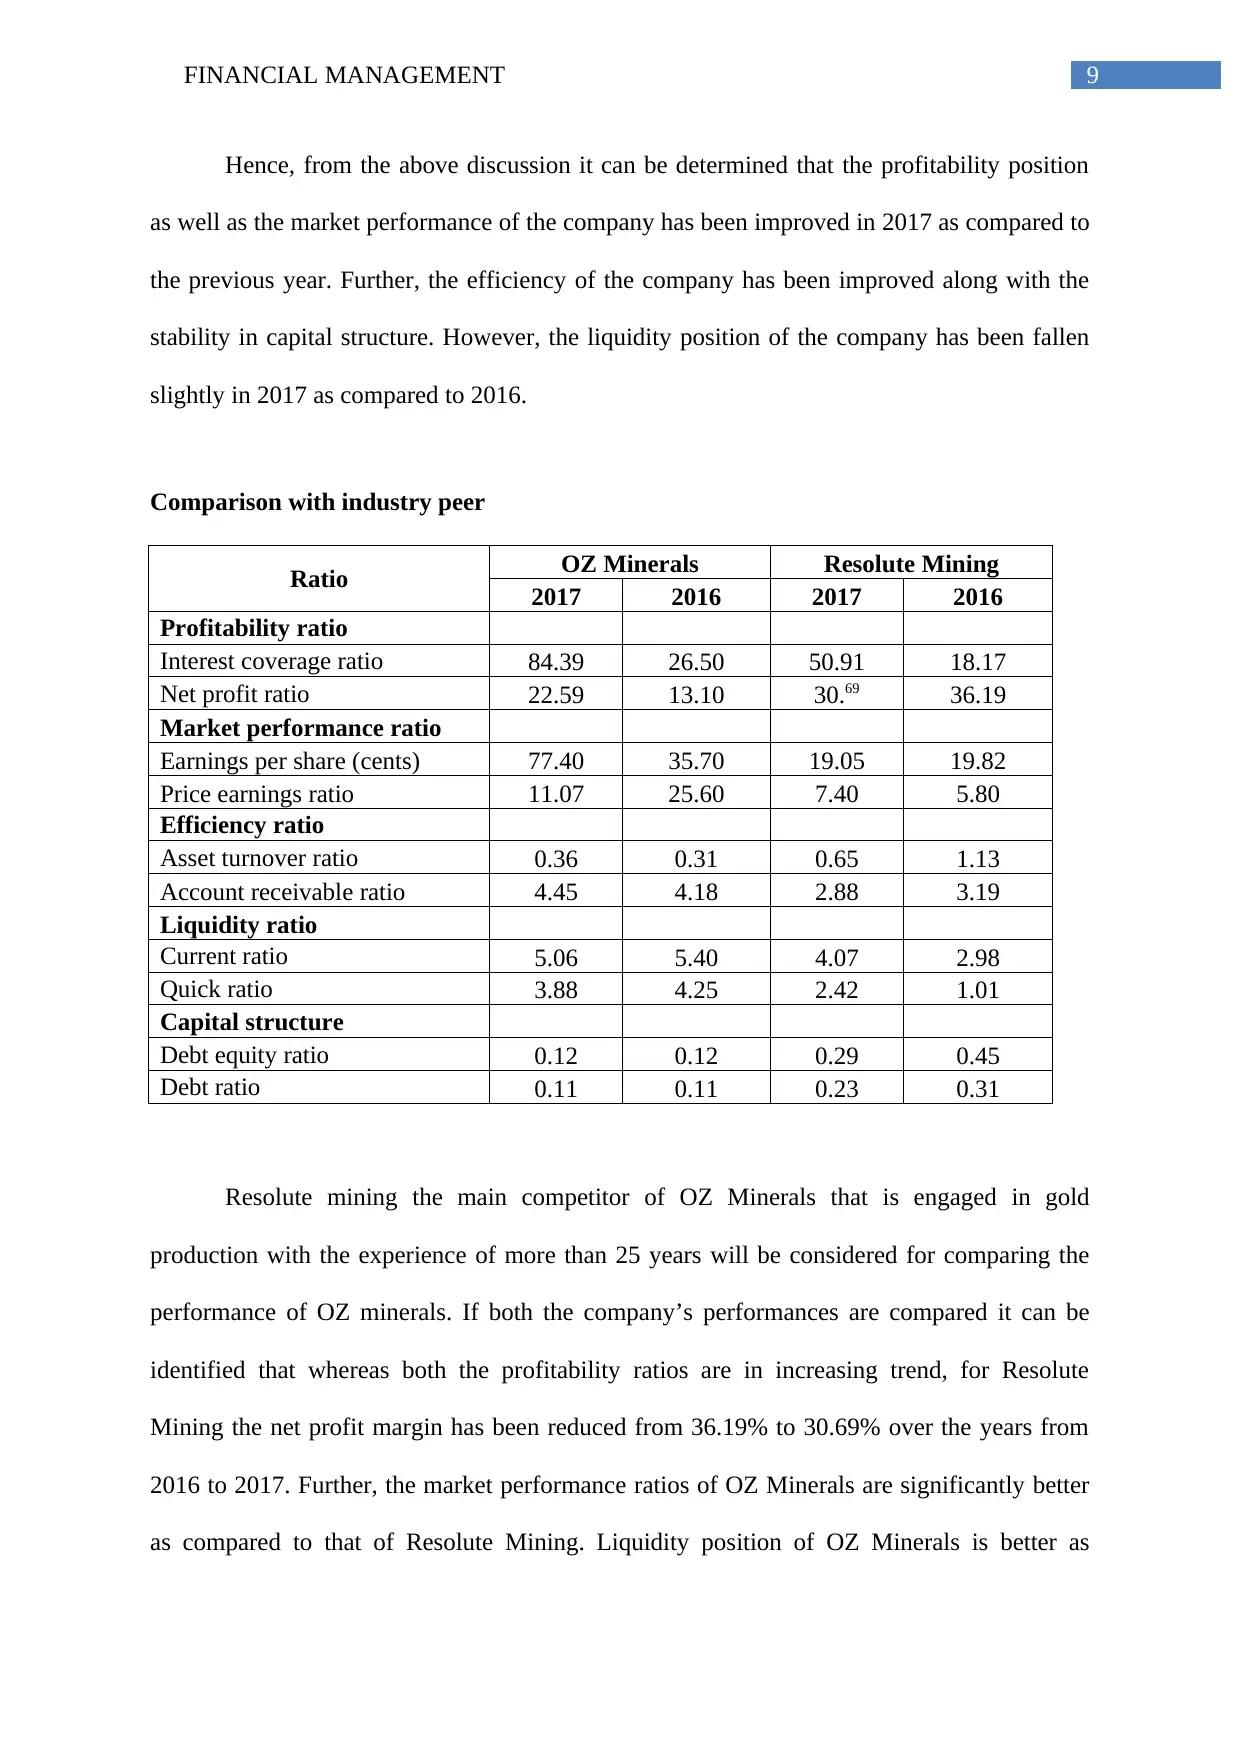
Comparison with industry peer
Ratio OZ Minerals Resolute Mining
2017 2016 2017 2016
Profitability ratio
Interest coverage ratio 84.39 26.50 50.91 18.17
Net profit ratio 22.59 13.10 30.69 36.19
Market performance ratio
Earnings per share (cents) 77.40 35.70 19.05 19.82
Price earnings ratio 11.07 25.60 7.40 5.80
Efficiency ratio
Asset turnover ratio 0.36 0.31 0.65 1.13
Account receivable ratio 4.45 4.18 2.88 3.19
Liquidity ratio
Current ratio 5.06 5.40 4.07 2.98
Quick ratio 3.88 4.25 2.42 1.01
Capital structure
Debt equity ratio 0.12 0.12 0.29 0.45
Debt ratio 0.11 0.11 0.23 0.31
Resolute mining the main competitor of OZ Minerals that is engaged in gold
production with the experience of more than 25 years will be considered for comparing the
performance of OZ minerals. If both the company’s performances are compared it can be
identified that whereas both the profitability ratios are in increasing trend, for Resolute
Mining the net profit margin has been reduced from 36.19% to 30.69% over the years from
2016 to 2017. Further, the market performance ratios of OZ Minerals are significantly better
as compared to that of Resolute Mining. Liquidity position of OZ Minerals is better as
Hence, from the above discussion it can be determined that the profitability position
as well as the market performance of the company has been improved in 2017 as compared to
the previous year. Further, the efficiency of the company has been improved along with the
stability in capital structure. However, the liquidity position of the company has been fallen
slightly in 2017 as compared to 2016.
Comparison with industry peer
Ratio OZ Minerals Resolute Mining
2017 2016 2017 2016
Profitability ratio
Interest coverage ratio 84.39 26.50 50.91 18.17
Net profit ratio 22.59 13.10 30.69 36.19
Market performance ratio
Earnings per share (cents) 77.40 35.70 19.05 19.82
Price earnings ratio 11.07 25.60 7.40 5.80
Efficiency ratio
Asset turnover ratio 0.36 0.31 0.65 1.13
Account receivable ratio 4.45 4.18 2.88 3.19
Liquidity ratio
Current ratio 5.06 5.40 4.07 2.98
Quick ratio 3.88 4.25 2.42 1.01
Capital structure
Debt equity ratio 0.12 0.12 0.29 0.45
Debt ratio 0.11 0.11 0.23 0.31
Resolute mining the main competitor of OZ Minerals that is engaged in gold
production with the experience of more than 25 years will be considered for comparing the
performance of OZ minerals. If both the company’s performances are compared it can be
identified that whereas both the profitability ratios are in increasing trend, for Resolute
Mining the net profit margin has been reduced from 36.19% to 30.69% over the years from
2016 to 2017. Further, the market performance ratios of OZ Minerals are significantly better
as compared to that of Resolute Mining. Liquidity position of OZ Minerals is better as
Paraphrase This Document
Need a fresh take? Get an instant paraphrase of this document with our AI Paraphraser
10FINANCIAL MANAGEMENT
compared to that of Resolute Mining and it is more leveraged as compared to OZ Minerals.
Hence, if overall performance of the companies is considered, it can be stated that OZ
Minerals is financially more stable as compared to its competitor Resolute Mining (Resolute,
2018).
Impact of competitive and political environment on business
Political factors play major role in finding out factors that have an impact on the long
term profitability of OZ Minerals. As the company is operating its business in various
countries it exposes itself to various political system and environmental risks. Therefore to
get success the company shall diversify its systematic risk with regard to political risks (Basu
et al., 2015). Various political factors that have impact on business of OZ minerals are as
follows –
Political importance and stability for the material sector in the economy of the
country
Corruption level particularly the regulation level in mining sector
Interference and bureaucracy in mining industry by the government
Anti-trust laws associated with mining
Trade tariffs and regulation related to business
Incentives and tax rates (Sykes & Trench, 2016)
Wage legislation that is the overtime and minimum wages
Mandatory benefits to the employees
Legal framework for the contract enforcement
On the other hand, if the impact of competitive environment is considered, it can be
stated that OZ minerals is among the leading mining companies in Australia. During the last
few years the company redefined the ways for carrying out the business in the mining
11FINANCIAL MANAGEMENT
industry. Whereas the levels of copper are declining, OZ minerals is producing high grade of
copper with low impurities. However, as the prices for some specific commodities are in
reducing trend the mining companies are looking for the ways for staying competitive in
industry along with paying their employee’s wages at stable rate (Zharan & Bongaerts, 2017).
Further some costs are there like employees safety and productivity cannot be reduced. These
add challenges in running the business successfully.
Ethical considerations while becomes insolvent
Inability to pay for the debts leads any organization to insolvency. Managing this time
of heading towards insolvency is difficult. However, various ethical considerations are there
those needs to be taken into consideration. These are –
Aware of the duties – while deemed insolvent or there is high risk of insolvency the
business directors shall be tasked with particular ethical duties. These duties include
maintaining records and books regarding all financial data during the period. Further,
interests of all the creditors shall be safeguarded (Chamberlains, 2015).
Shall not be involved in further trade – it is the ethical obligation to prevent the
business from trading when it is heading towards insolvency. As the business already
have some debts, the director shall disallow further trade during that period.
External factors
Political factor – Favourable ambience with regard to politics
Economical – existing business, capital availability and raw material prices
Social – infrastructure establishment and local support
Technological – edge over the competitors
Legal – differentiated relations
⊘ This is a preview!⊘
Do you want full access?
Subscribe today to unlock all pages.
Trusted by 1+ million students worldwide
1 out of 17
Related Documents


Your All-in-One AI-Powered Toolkit for Academic Success.
+13062052269
info@desklib.com
Available 24*7 on WhatsApp / Email
![[object Object]](/_next/static/media/star-bottom.7253800d.svg)
Unlock your academic potential
Copyright © 2020–2026 A2Z Services. All Rights Reserved. Developed and managed by ZUCOL.